AI Edit for QGIS: The Complete Guide
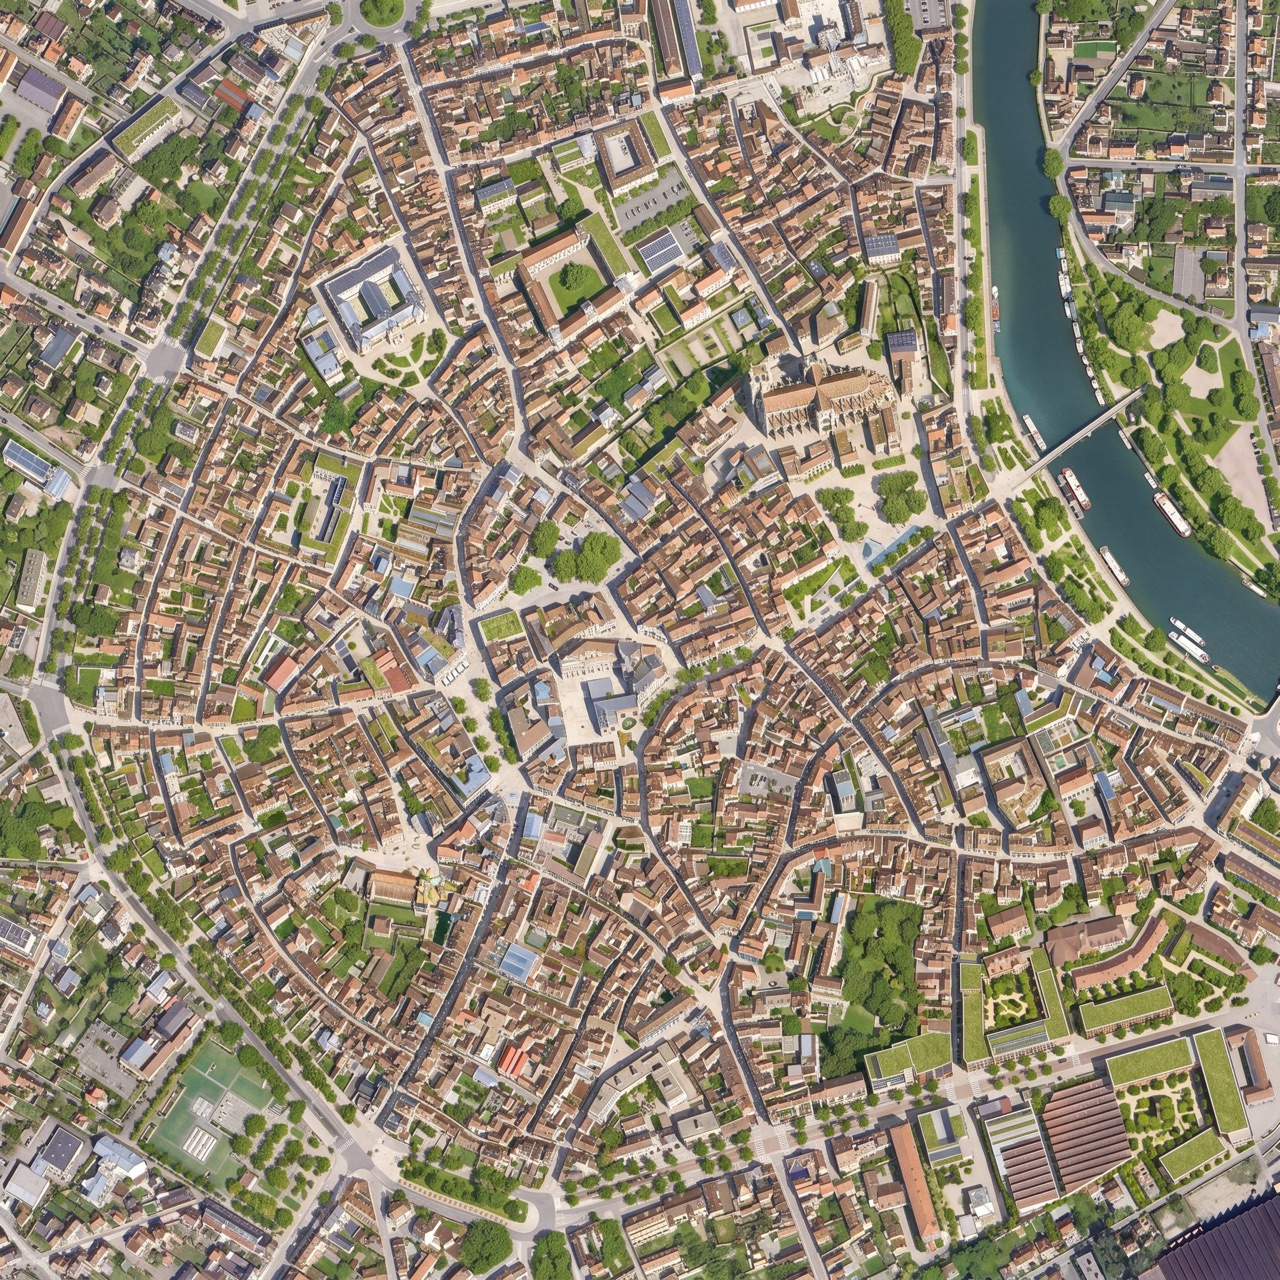
Turn the aerial imagery in your ![]() QGIS canvas into edits, clean maps, and vector data, all from plain-language prompts. Draw a box, describe the change, and the result drops back onto the map, perfectly aligned. This guide walks through the whole tool: your first edit, the prompt library, Markup, Vectorize, and reference images.
QGIS canvas into edits, clean maps, and vector data, all from plain-language prompts. Draw a box, describe the change, and the result drops back onto the map, perfectly aligned. This guide walks through the whole tool: your first edit, the prompt library, Markup, Vectorize, and reference images.
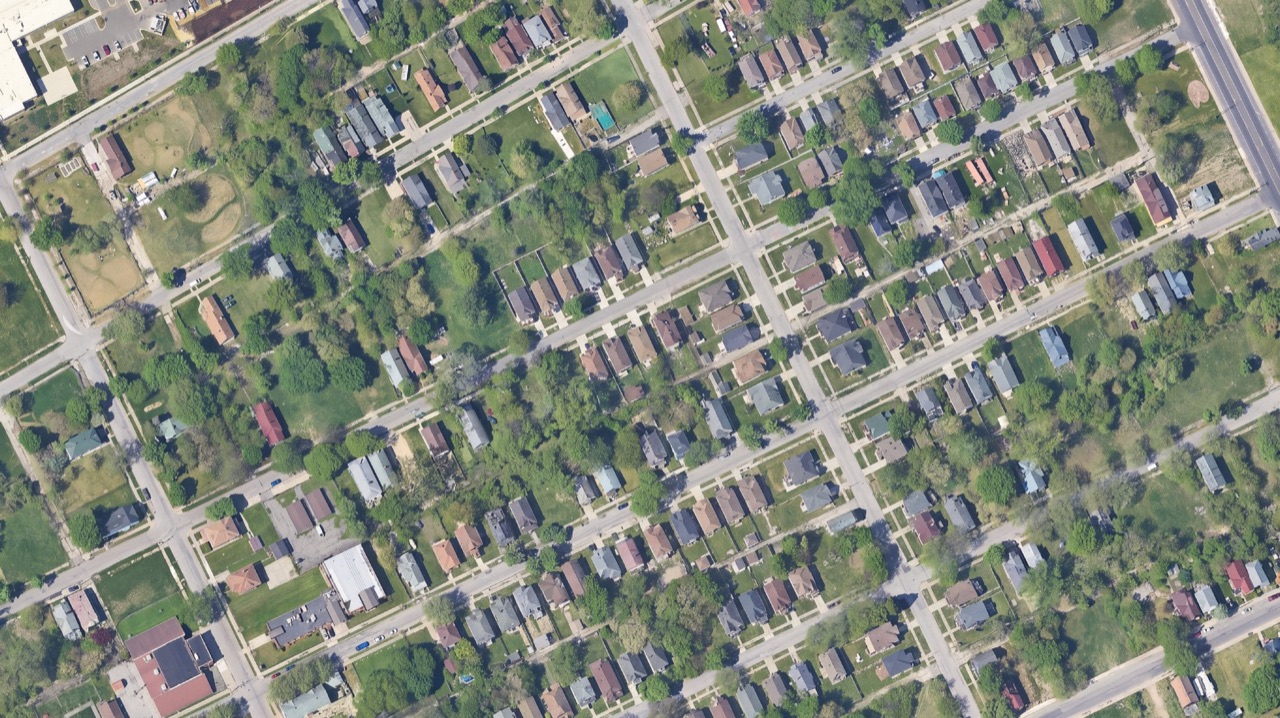
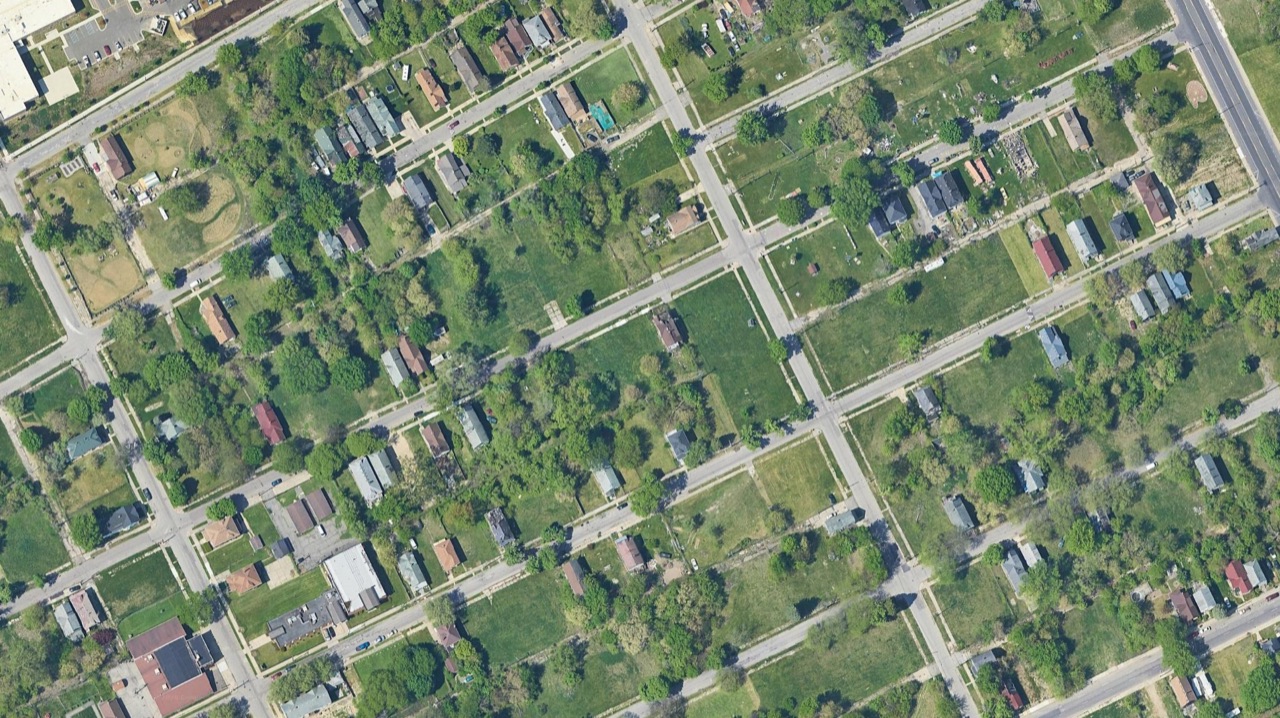
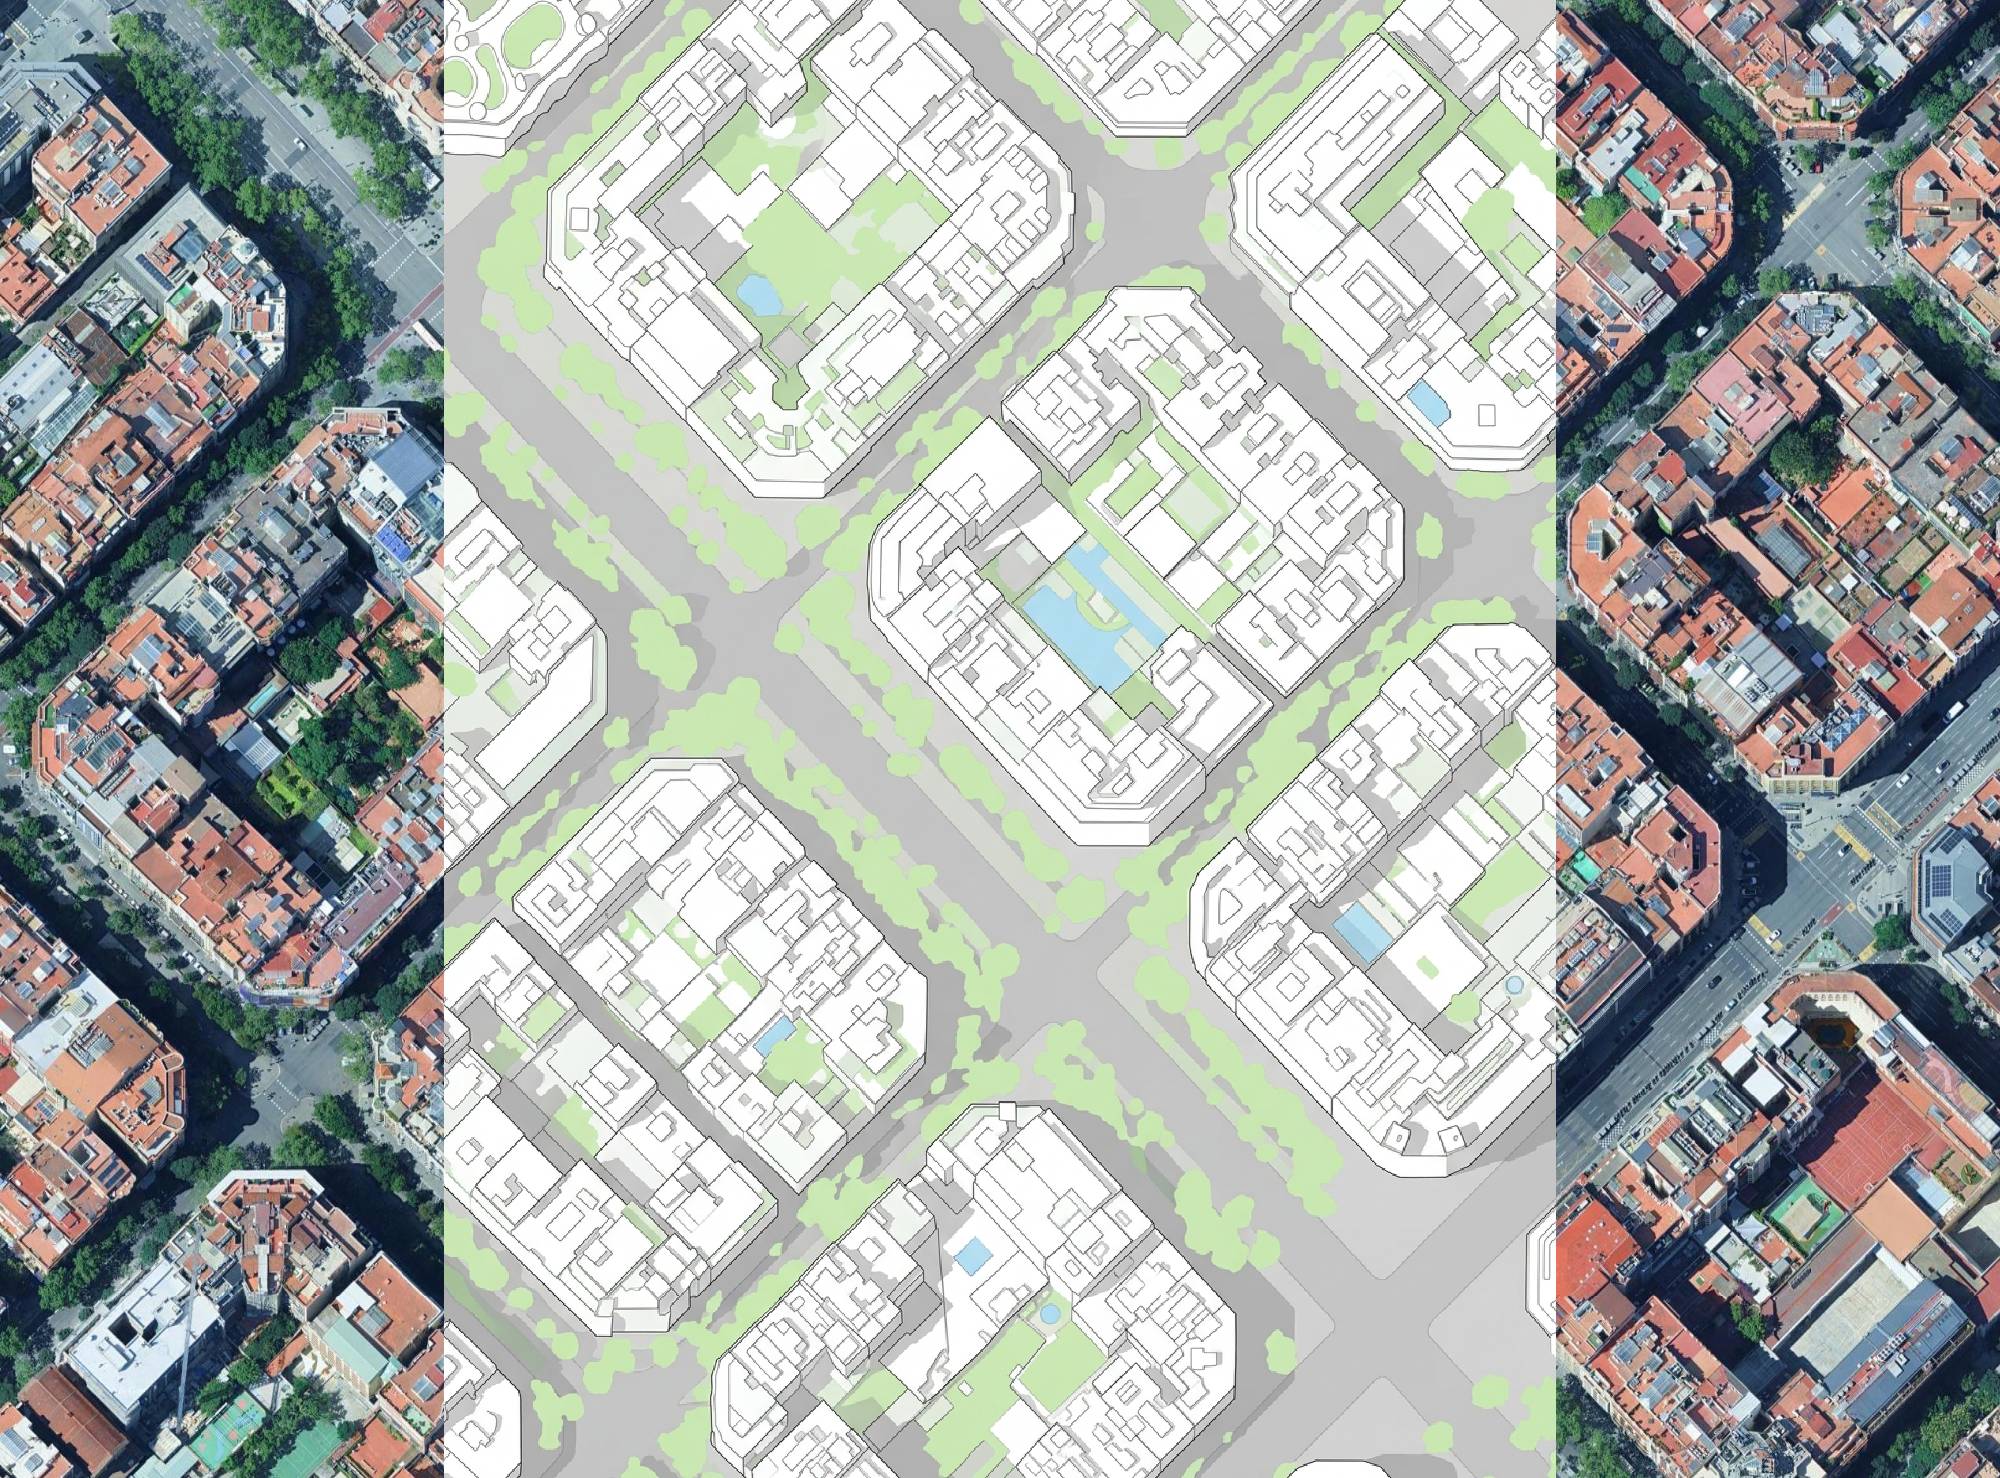
Examples
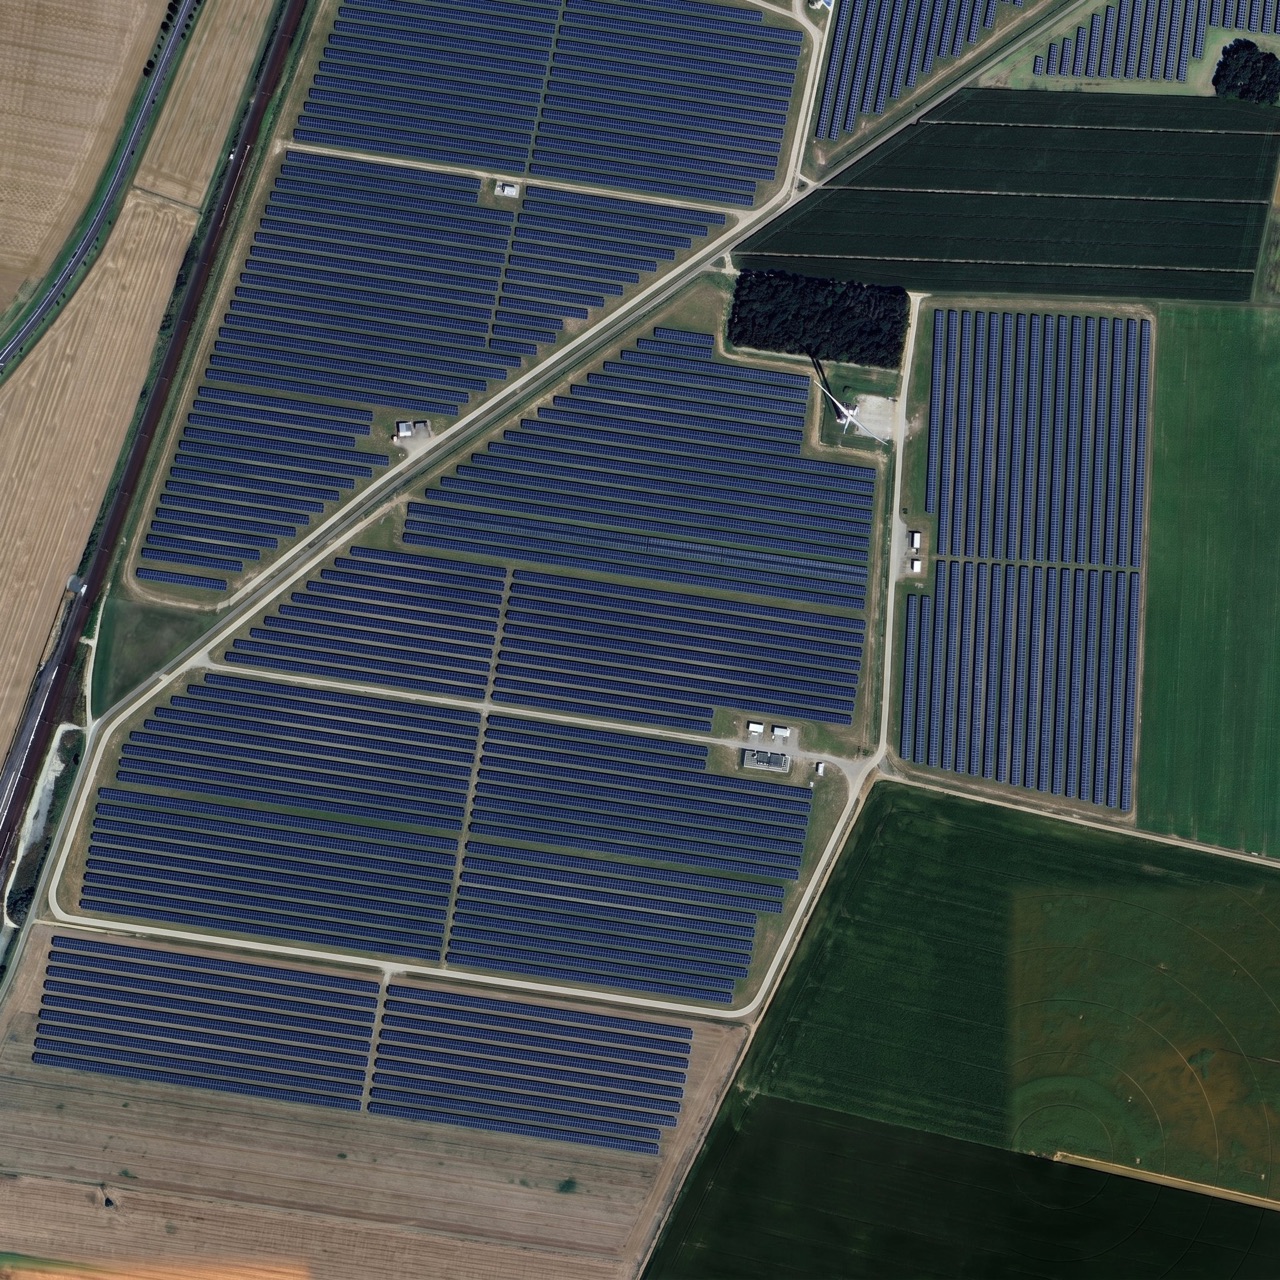
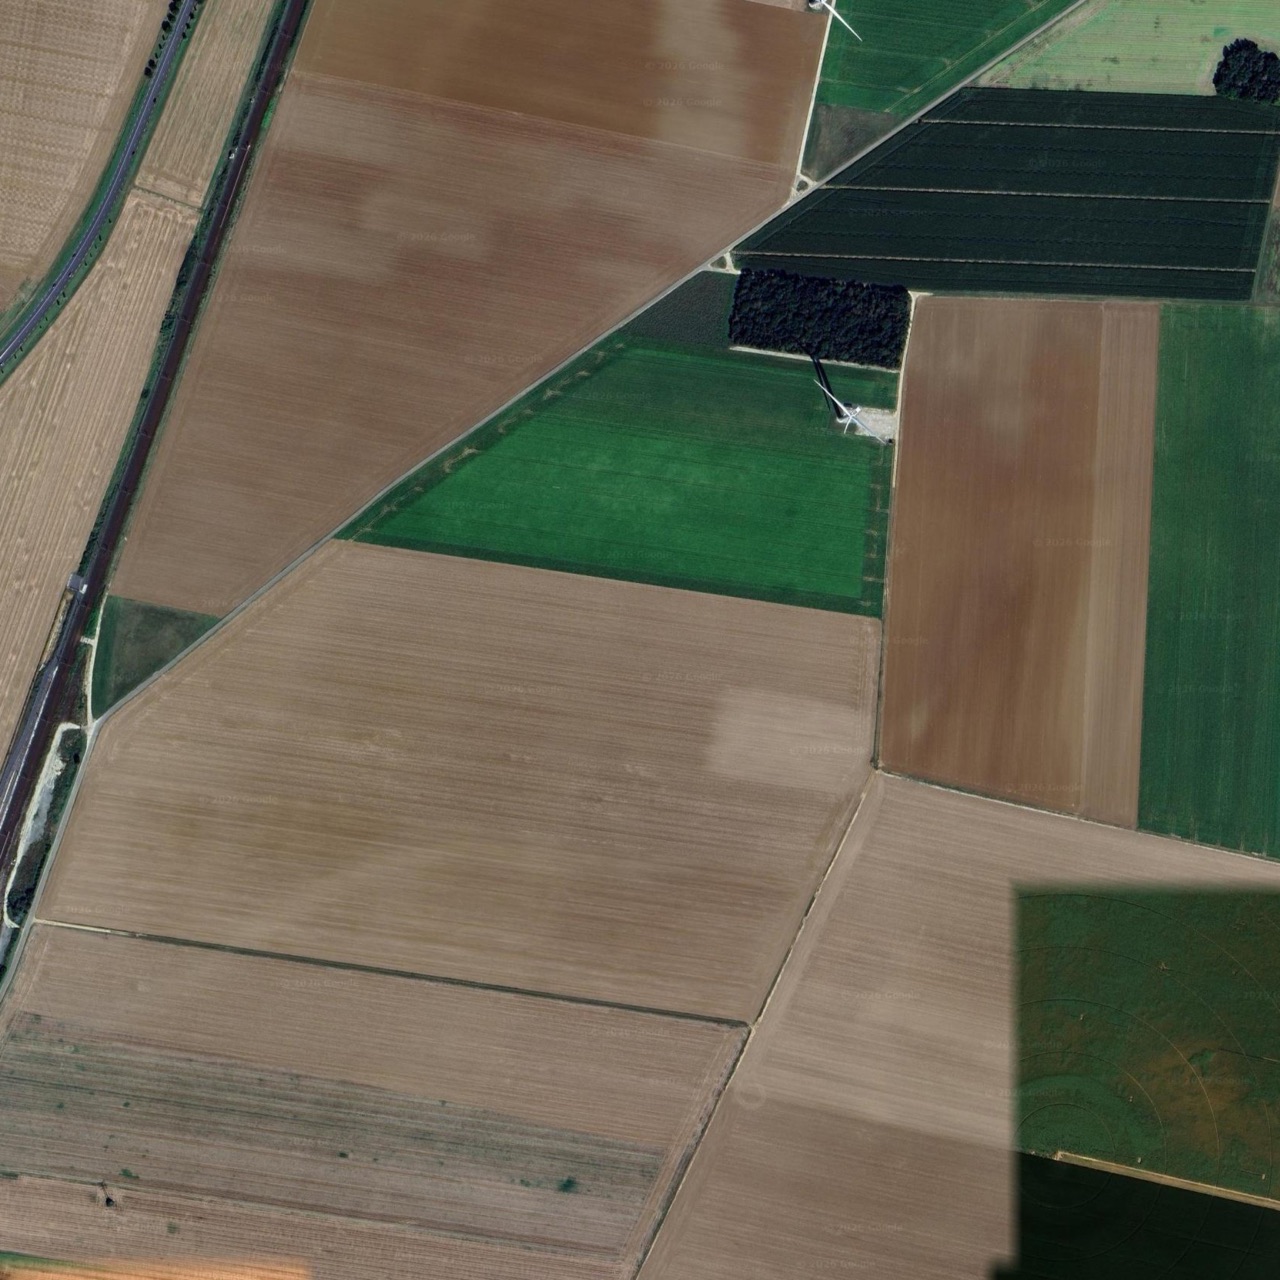
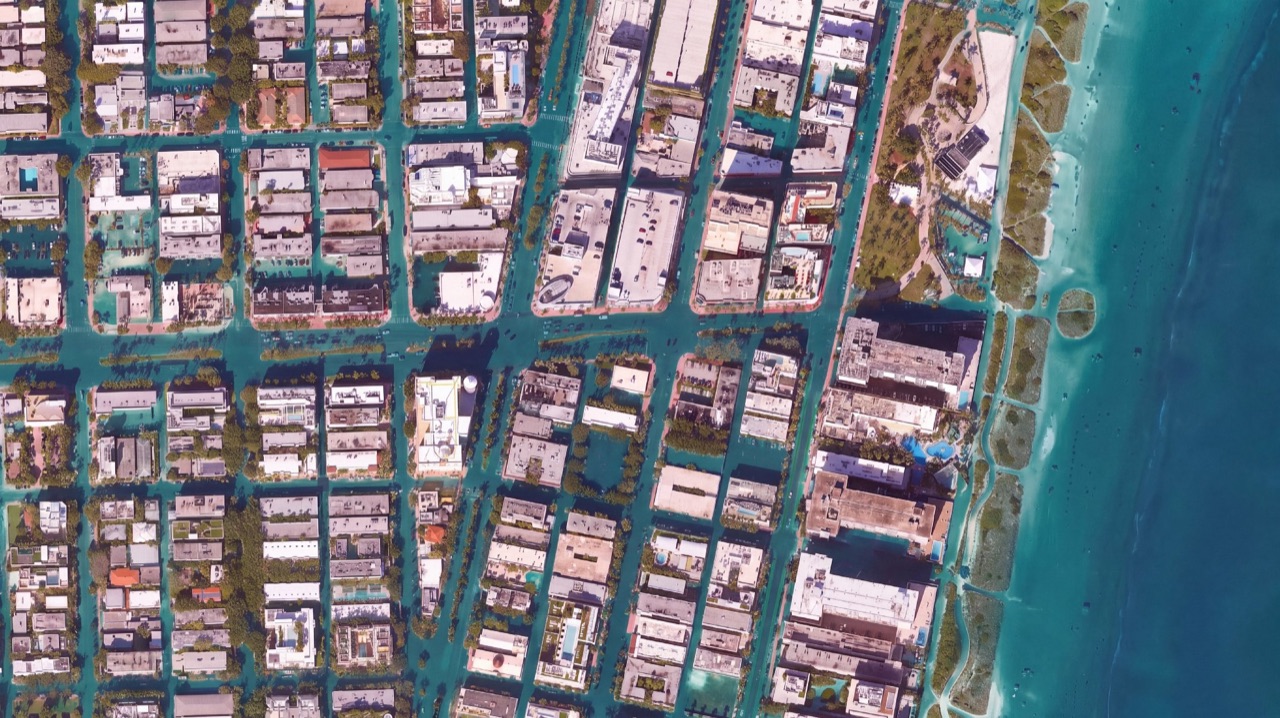
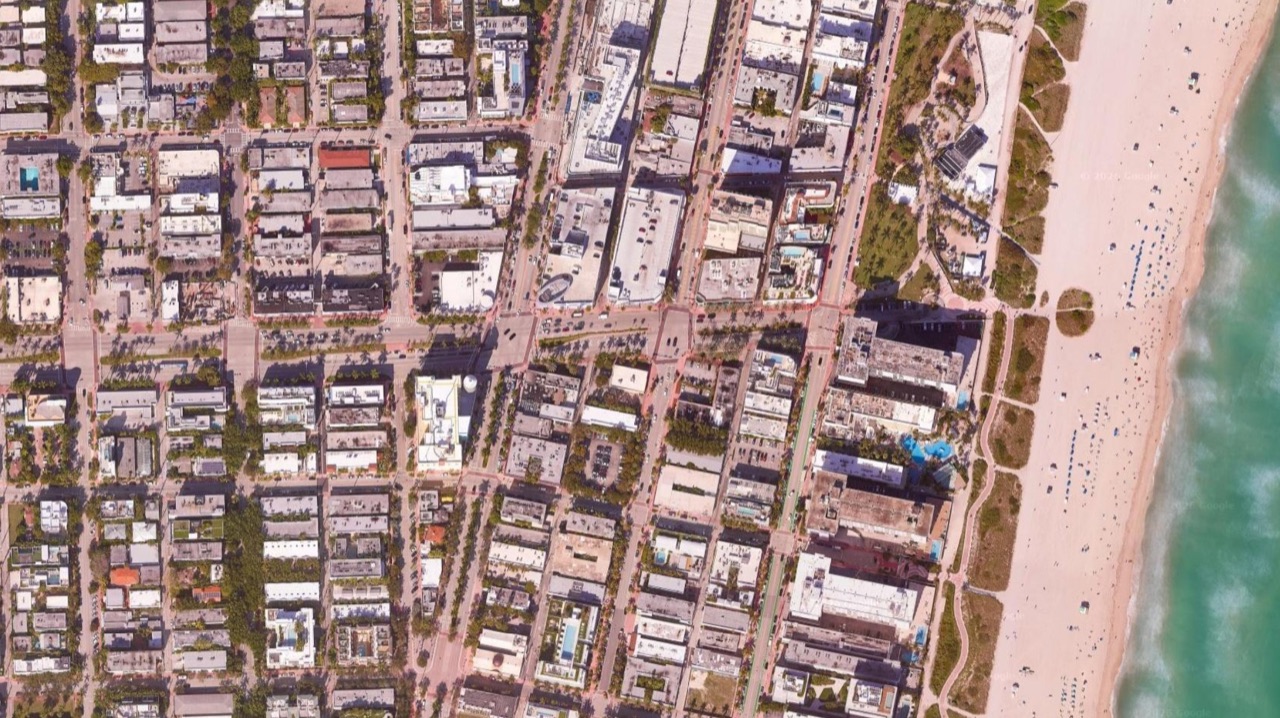
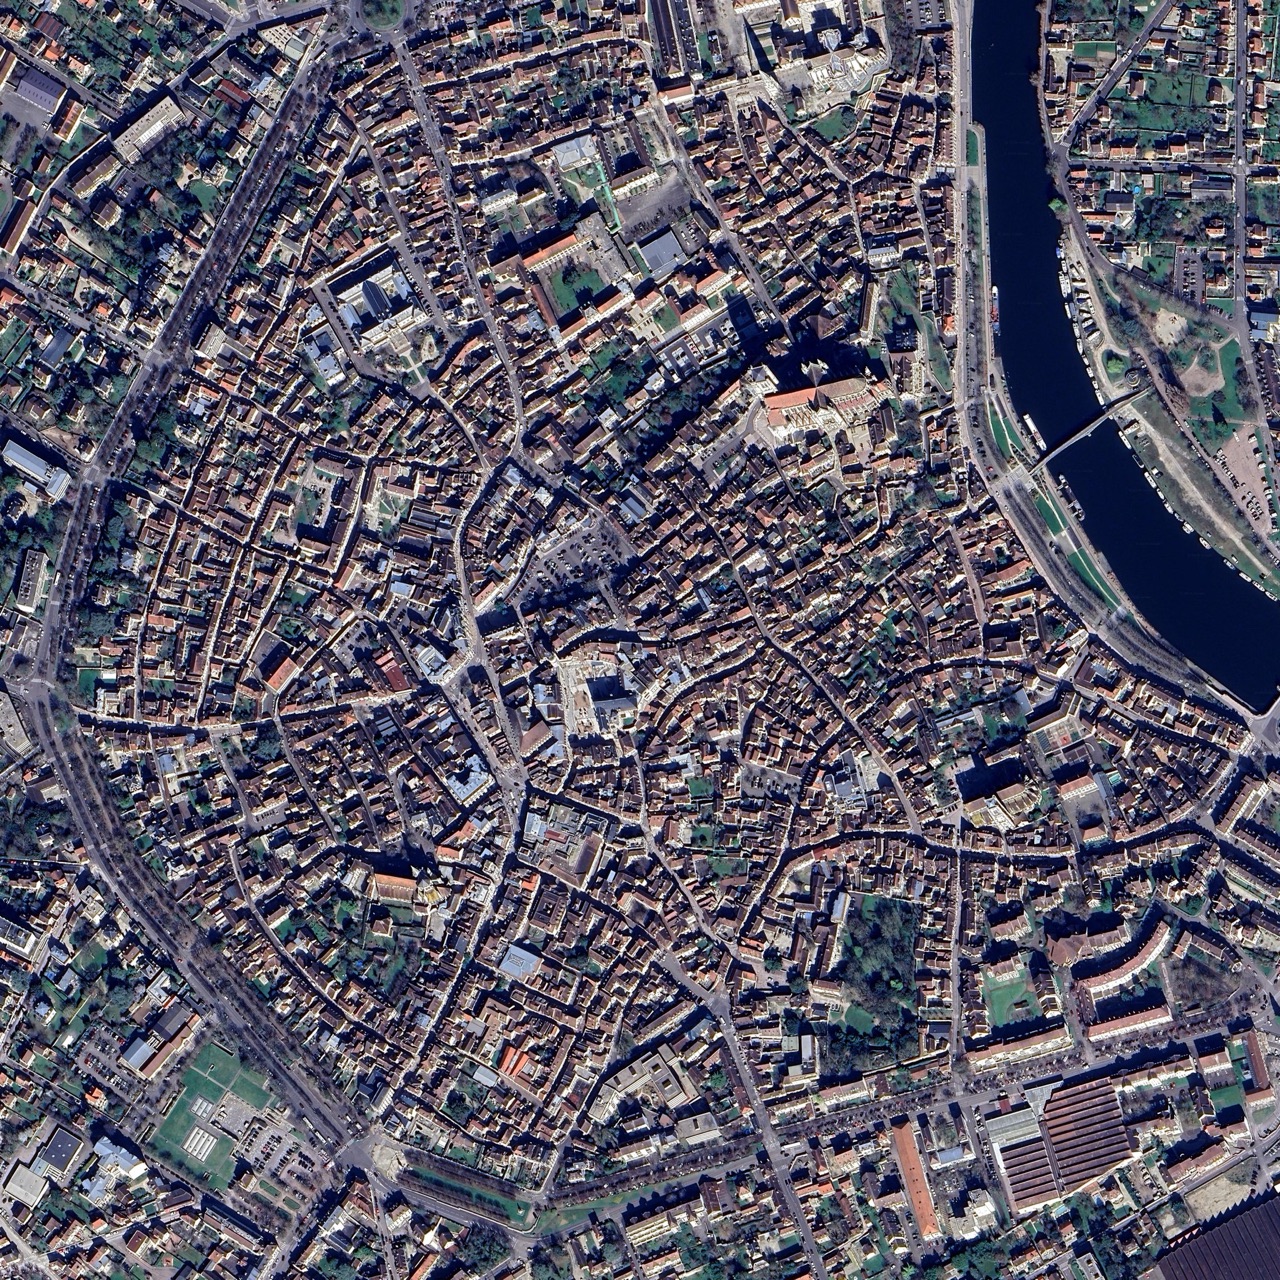
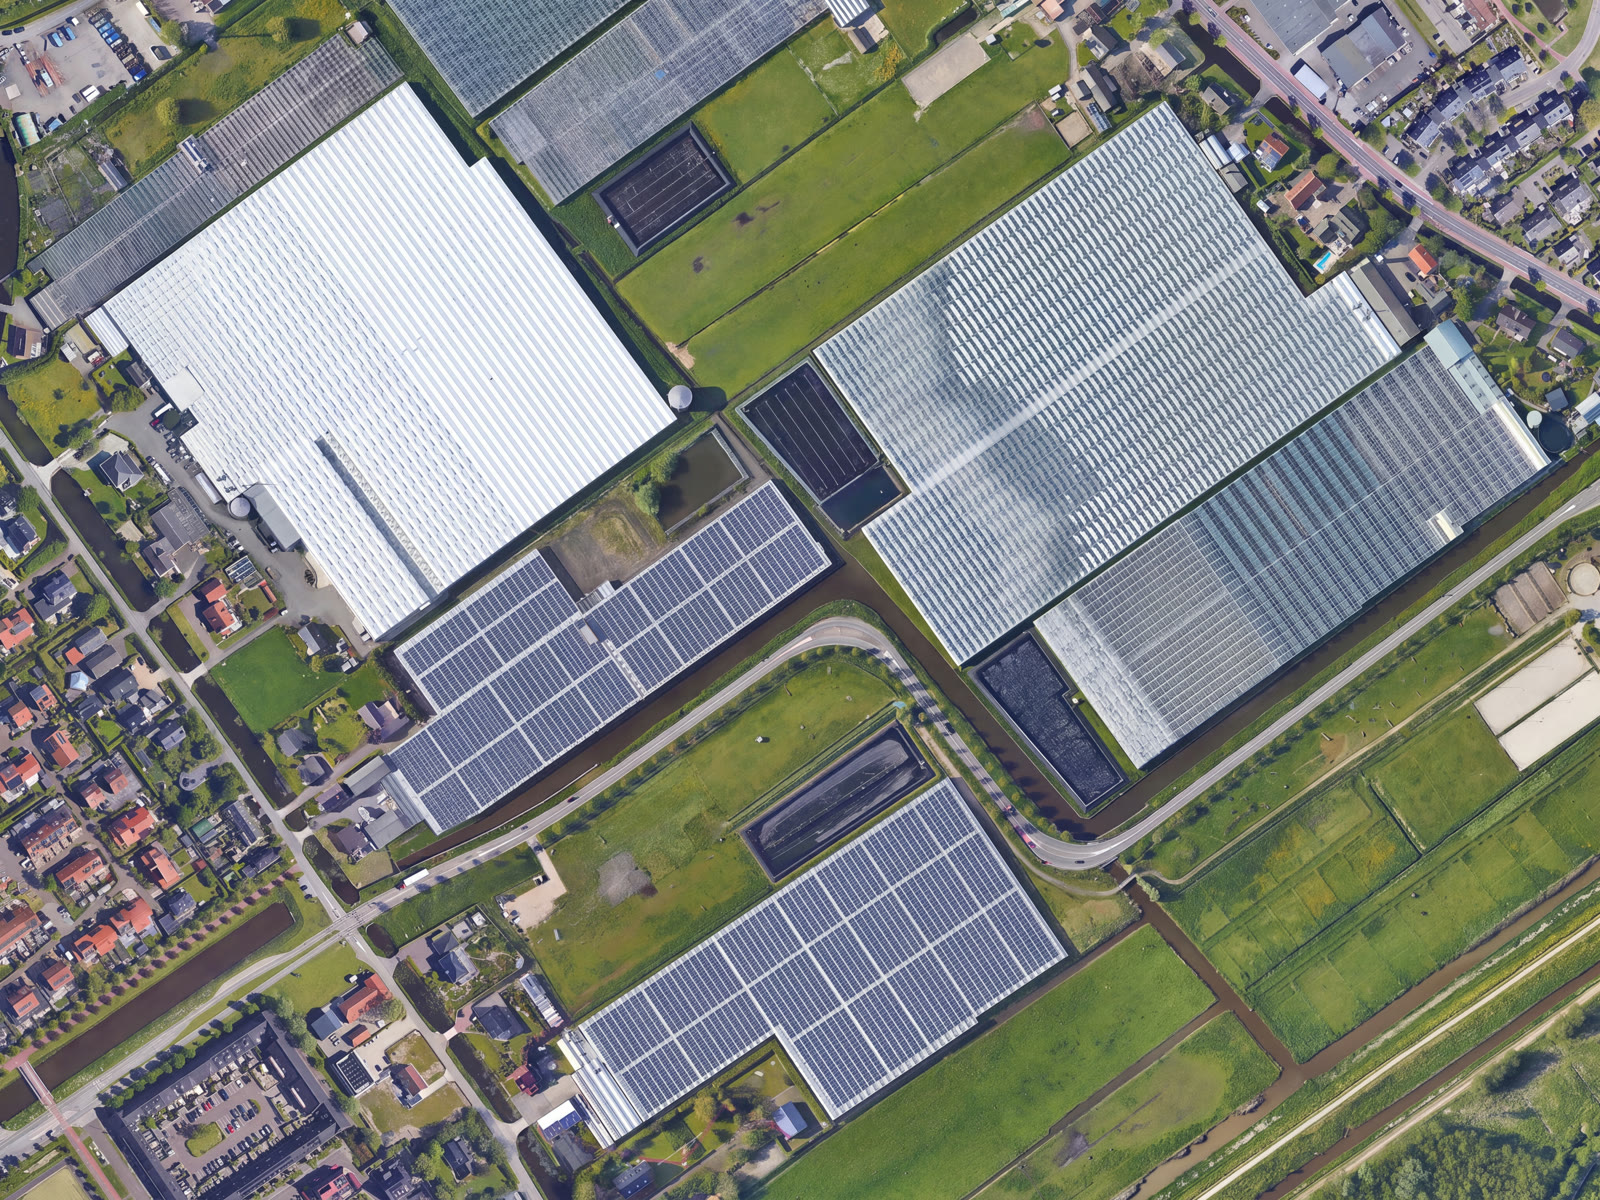
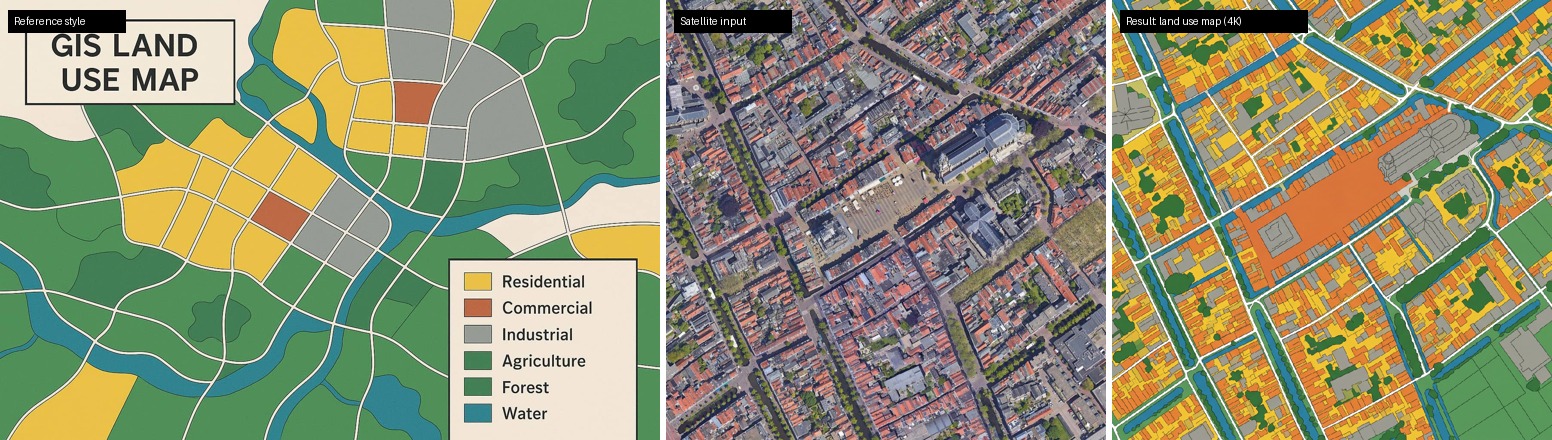
Drag the slider on any example: the original aerial image is on the left, the AI result on the right.
Install in QGIS
Install AI Edit from the QGIS Plugin Repository: open Plugins -> Manage and Install Plugins, search for AI Edit, and click Install. It runs on QGIS 3 and 4, on Windows, macOS, and Linux, and is powered by the Nano Banana 2 model.
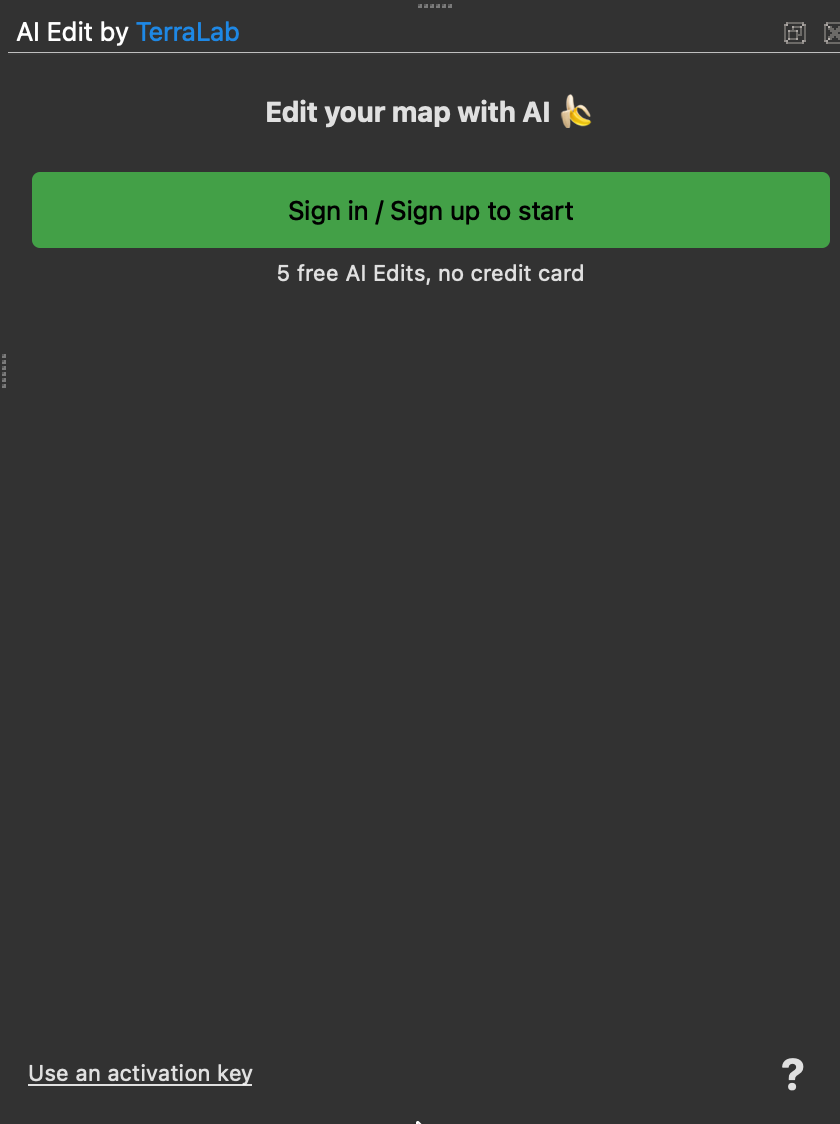
Then open the panel and click Sign in / Sign up. Your browser opens; create an account (email, Google, or Microsoft) and confirm, and the plugin connects itself, no credit card, with free edits to start.
Your first edit
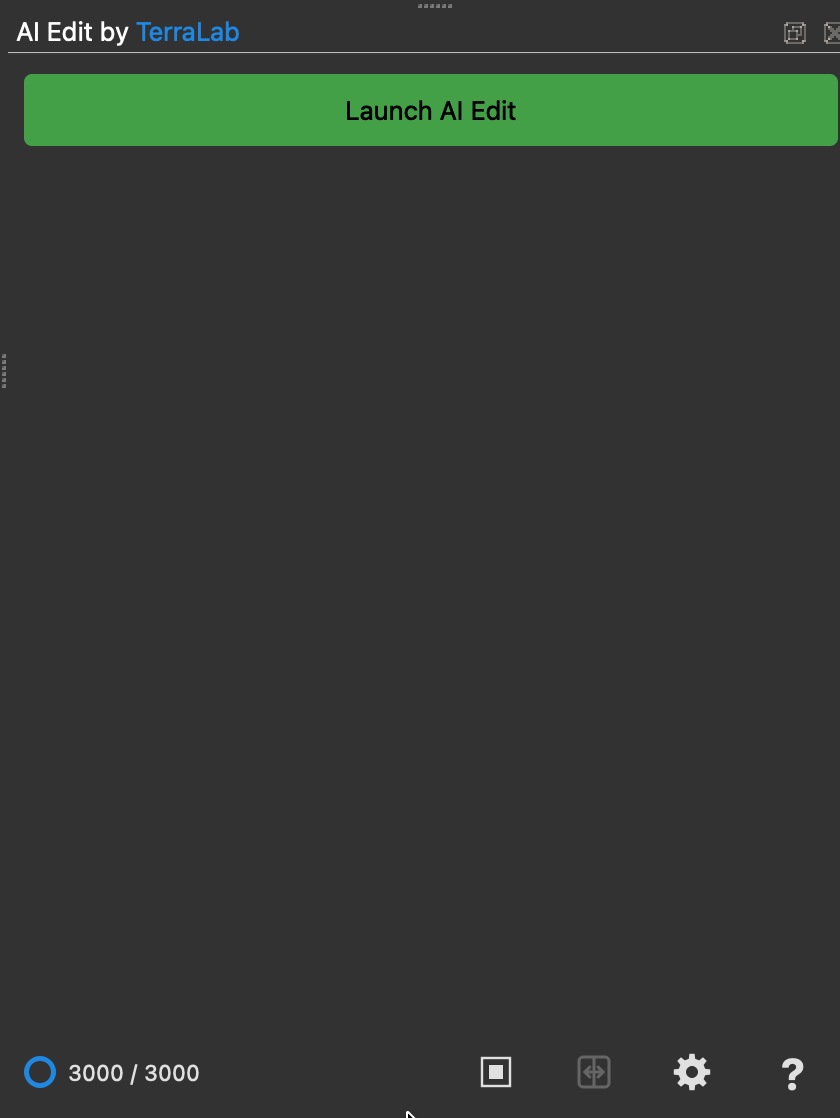
Launch and draw your zone
Click the green Launch AI Edit button, then drag a box on the map over the area you want to change.
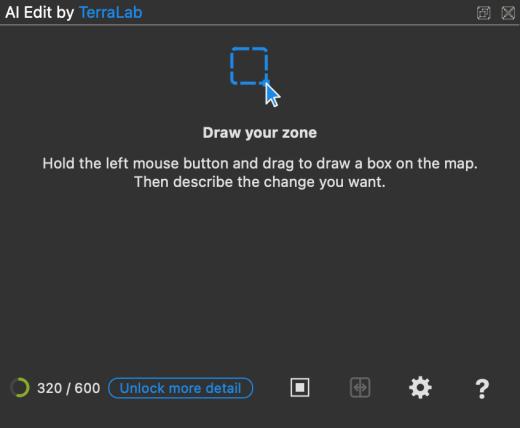
Describe the change
Type a prompt, or open the Library for a ready-made one. Keep the box roughly square and not too large.
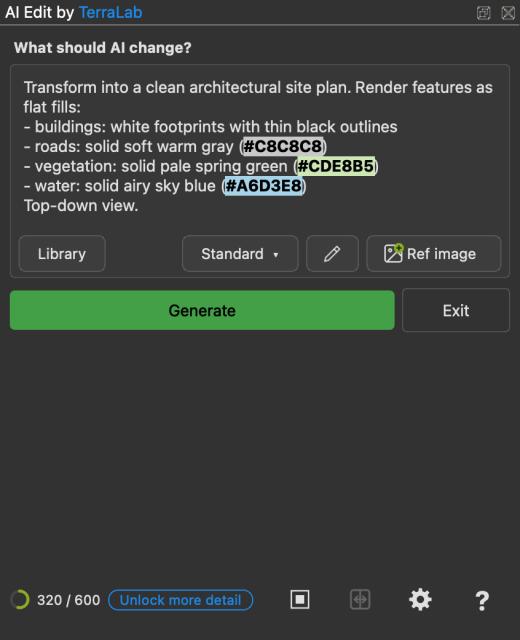
Pick the output detail
| Detail | Resolution | Plan |
|---|---|---|
| Standard | 1K | Free |
| Detailed | 2K | Pro |
| Maximum | 4K | Pro |
Generate
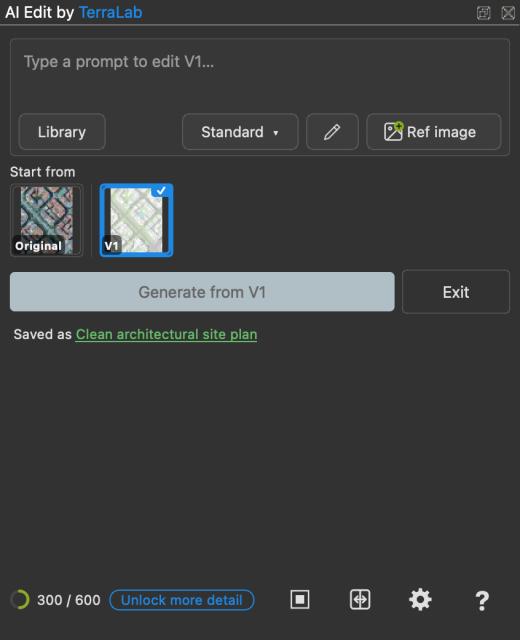
Click Generate. A few seconds later the result is added as a new georeferenced raster, exactly over your zone.
The panel keeps every version (Original, V1, V2, and so on). Pick one as the base, prompt again, and generate to refine. The Before / after button slides between input and output.
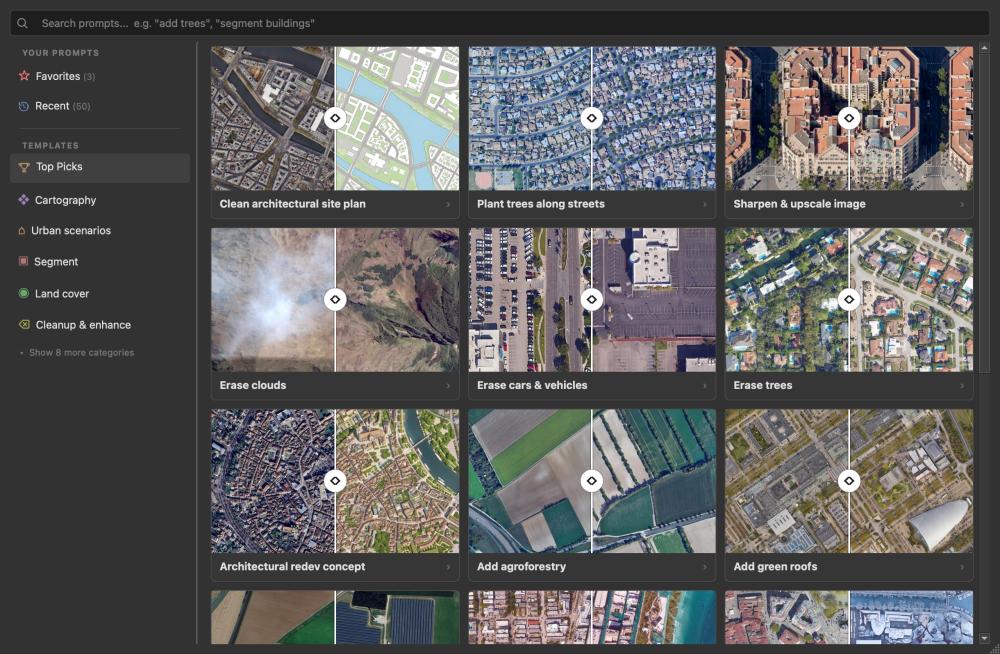
The prompt library
Click Library to browse ready-made templates, each with a before/after preview and an editable prompt. They are grouped by theme: Cartography, Urban, Segment, Land cover, Cleanup, Forestry, Agriculture, Climate, Energy, and more.
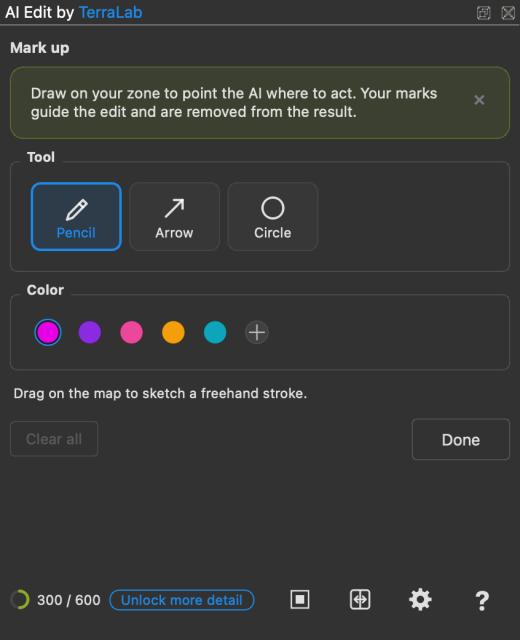
Markup
Markup lets you draw on your zone to tell the AI where to act. Your marks guide the edit and are removed from the result. Use it for a change in one specific place, not across the whole image.
Open Markup and pick a tool
With a zone drawn, click the pencil button, then choose a tool (pencil, arrow, circle) and a color.
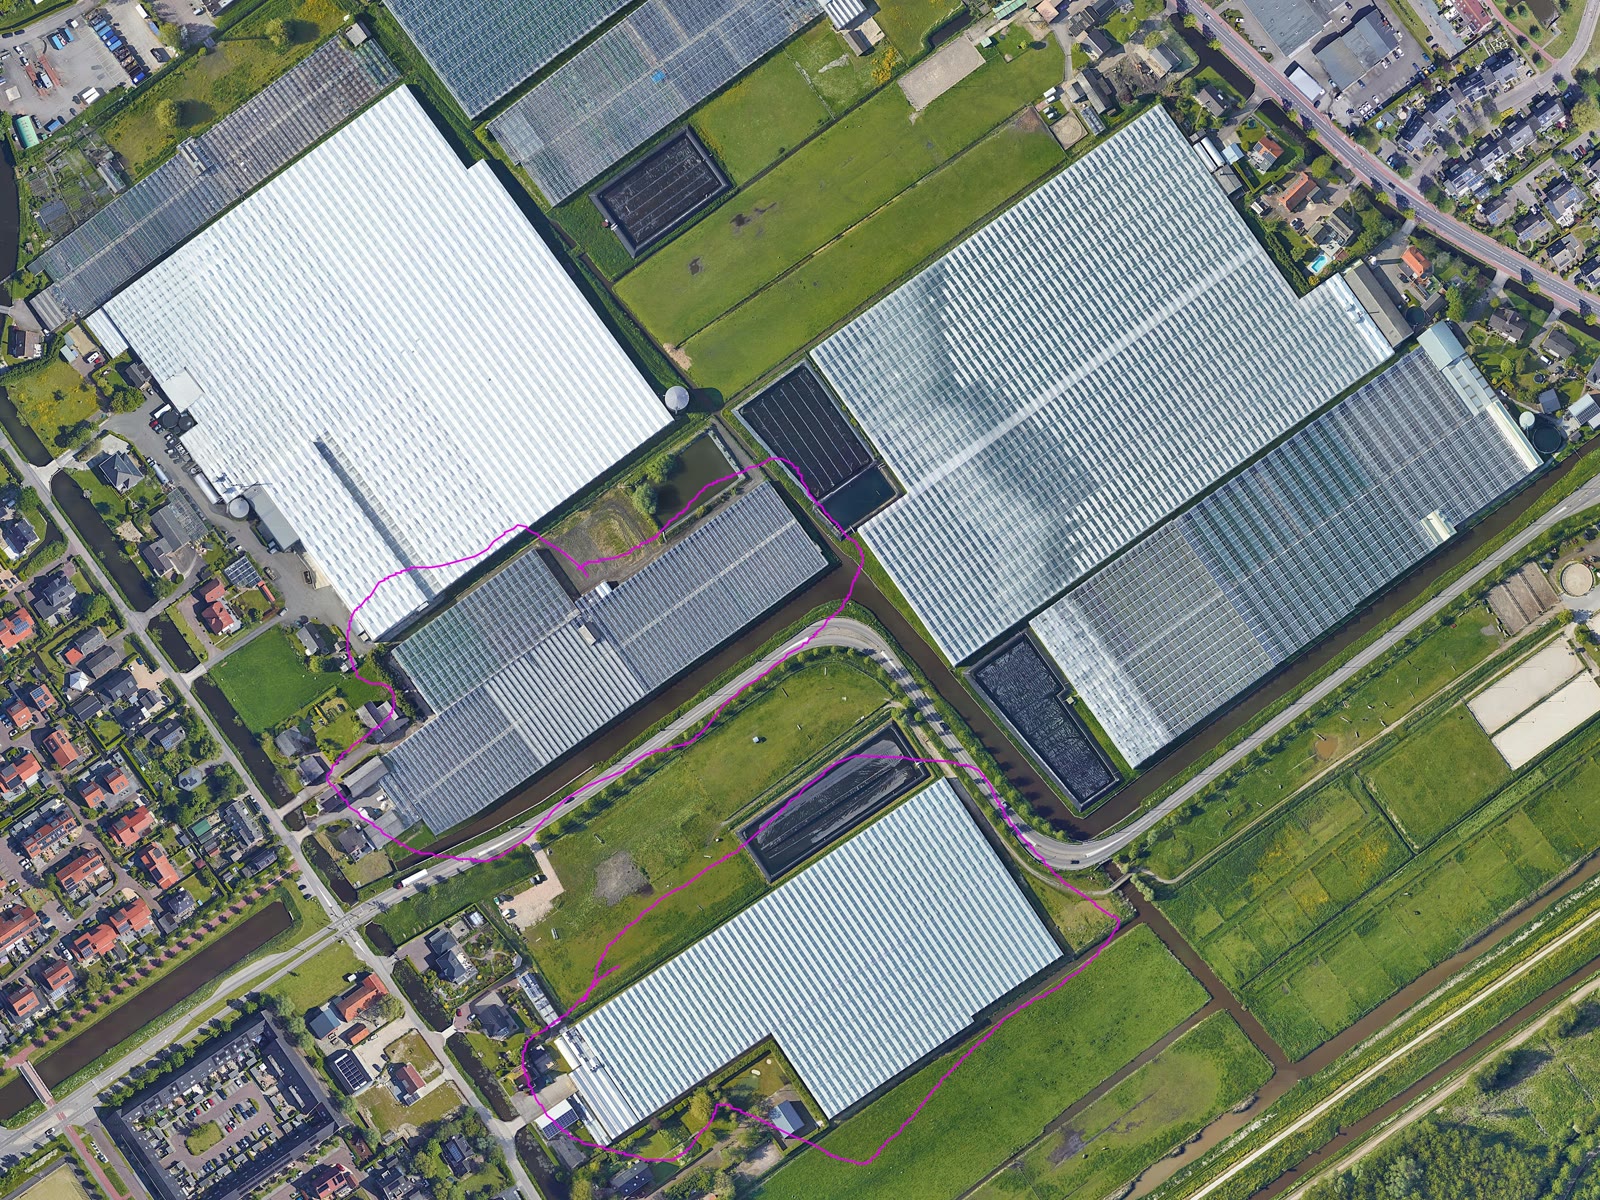
Draw on the map
Here, a purple outline traced around the greenhouse roofs we want to cover.

Prompt and generate
Reference your mark by color, then generate. For example:
Add solar panels on the roofs inside the purple markup. Keep everything outside untouched.
Vectorize
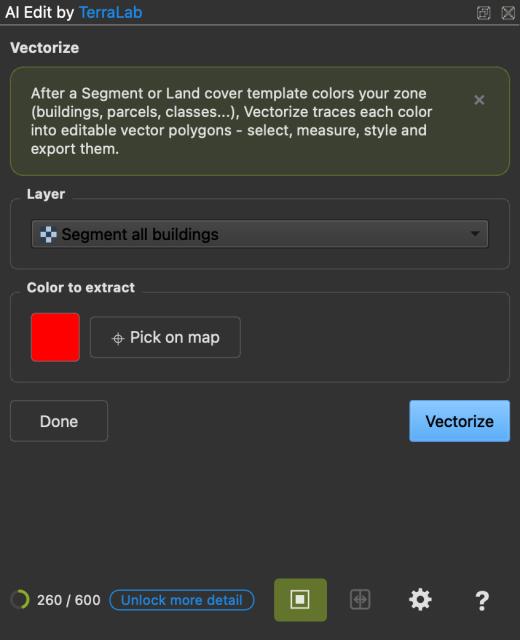
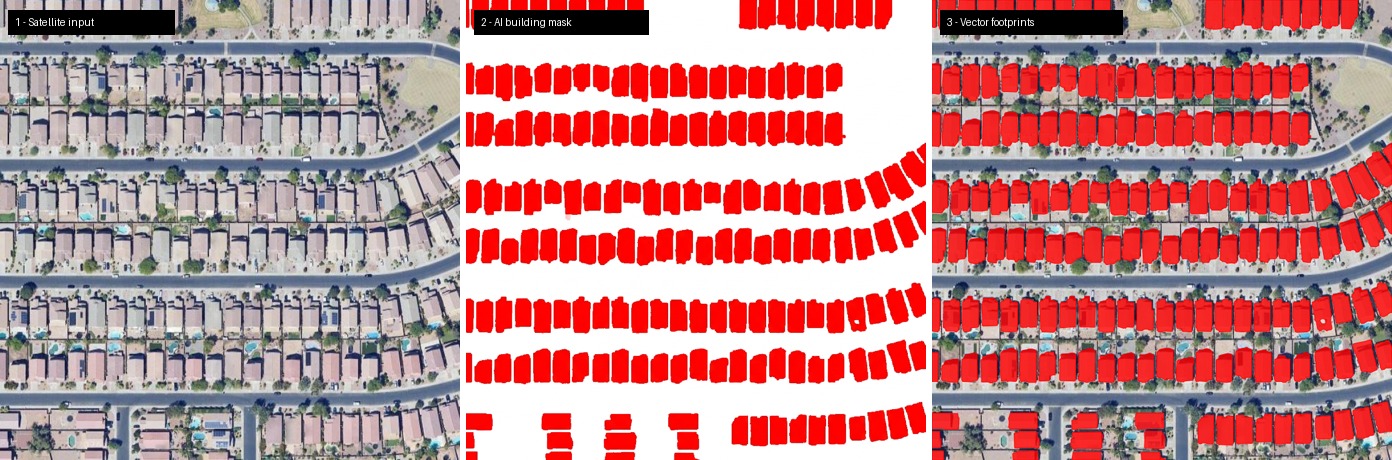
Vectorize traces a flat-colored AI result (buildings, land-cover classes, parcels) into real vector polygons you can select, measure, style, and export. Use it after a Segment or Land-cover template, when you need GIS features, not just a picture.
Run a segmentation, then click Vectorize
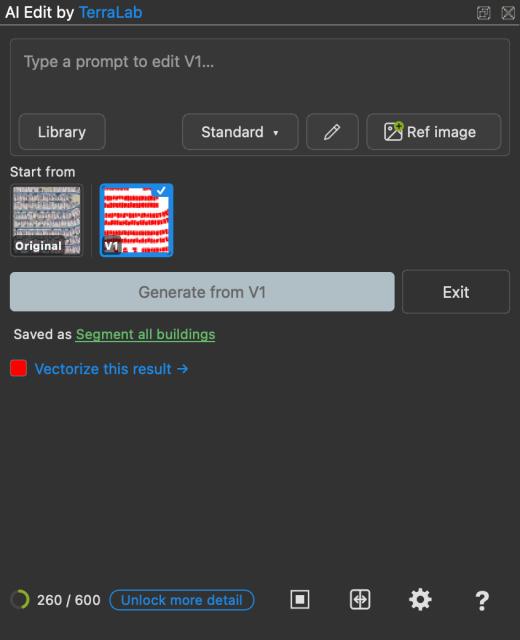
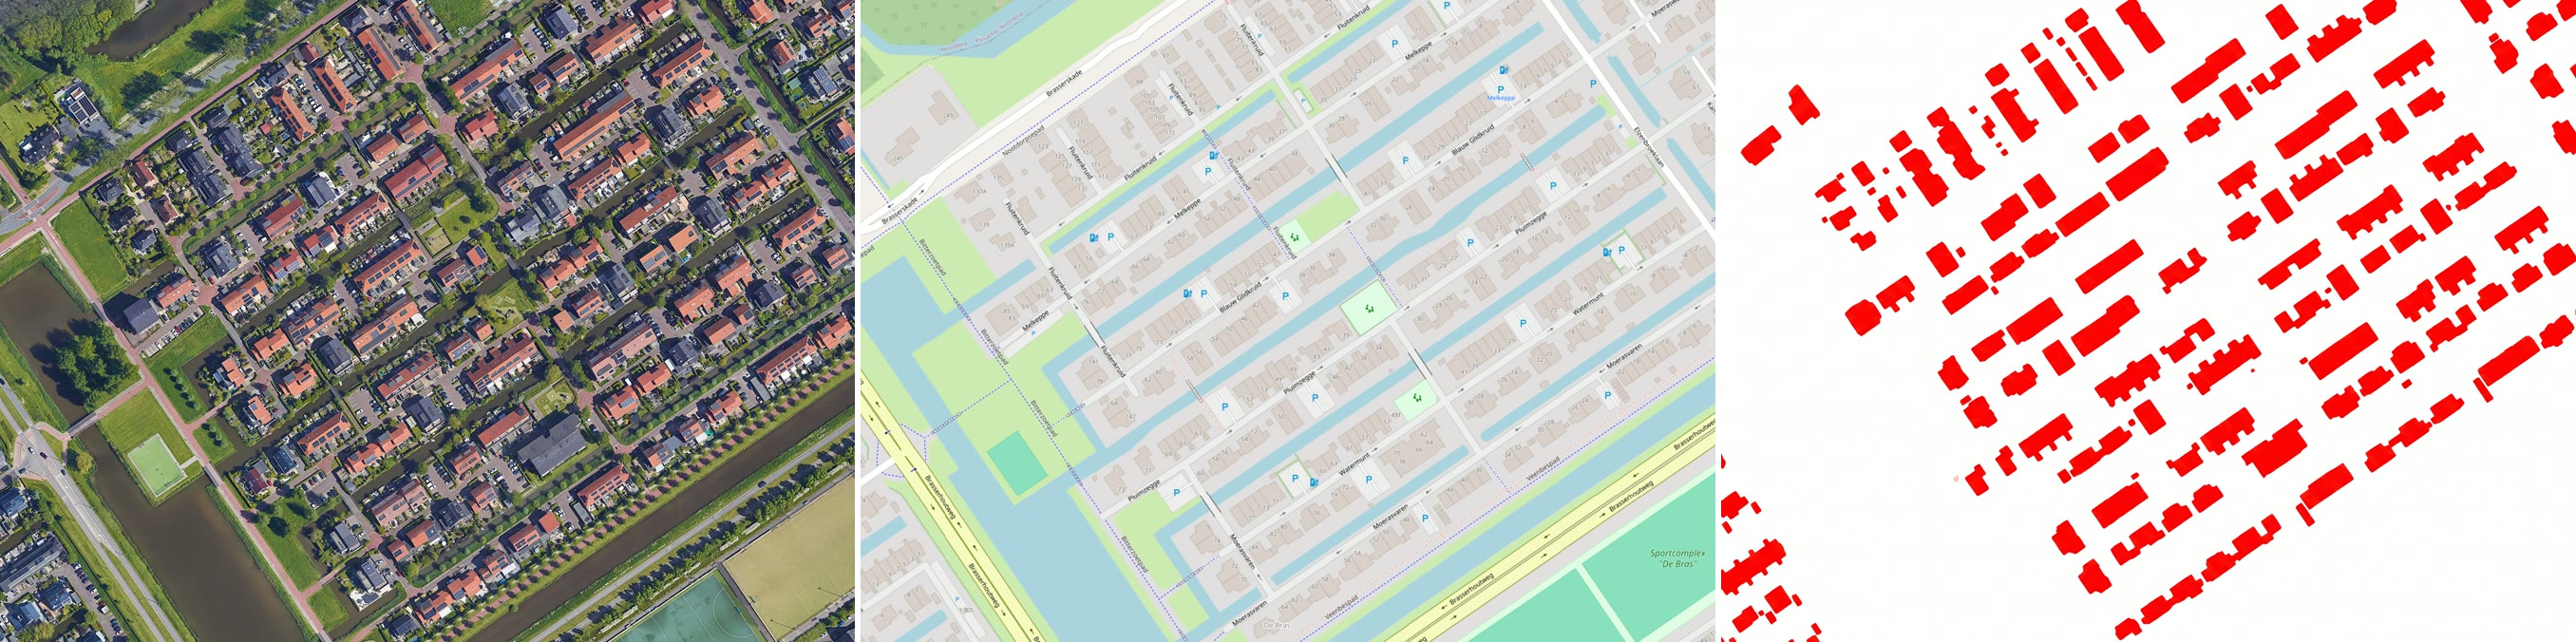
On a result like Segment all buildings (buildings in red), click Vectorize this result.
Confirm the color and run
The panel pre-fills the color to extract. Click Vectorize, or use Pick on map to sample a different color.
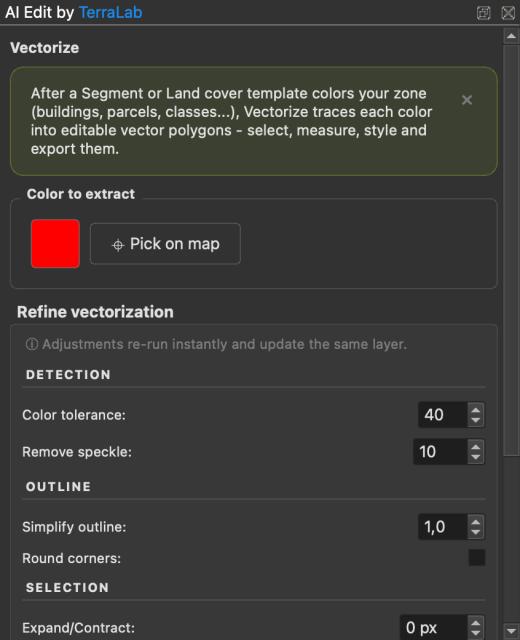
Refine live
Adjust tolerance, despeckle, simplify outlines, and round corners. Changes re-run instantly on the same layer.
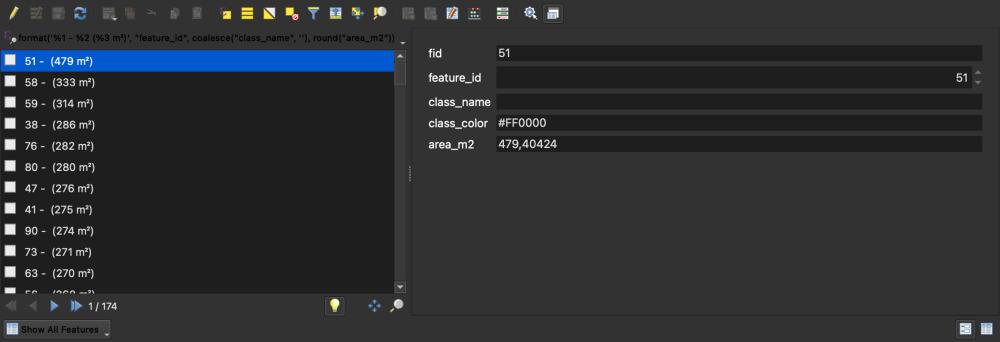
Each feature carries a clean attribute set (feature_id, class_name, class_color, and a geodesic area_m2) and is saved to a GeoPackage in your output folder, ready for analysis.
Reference images and layers
References give the AI extra context that is cropped to your zone but never shown on the canvas. Use them to control style, match a color legend, or feed real data. The free tier allows one reference; Pro allows several.
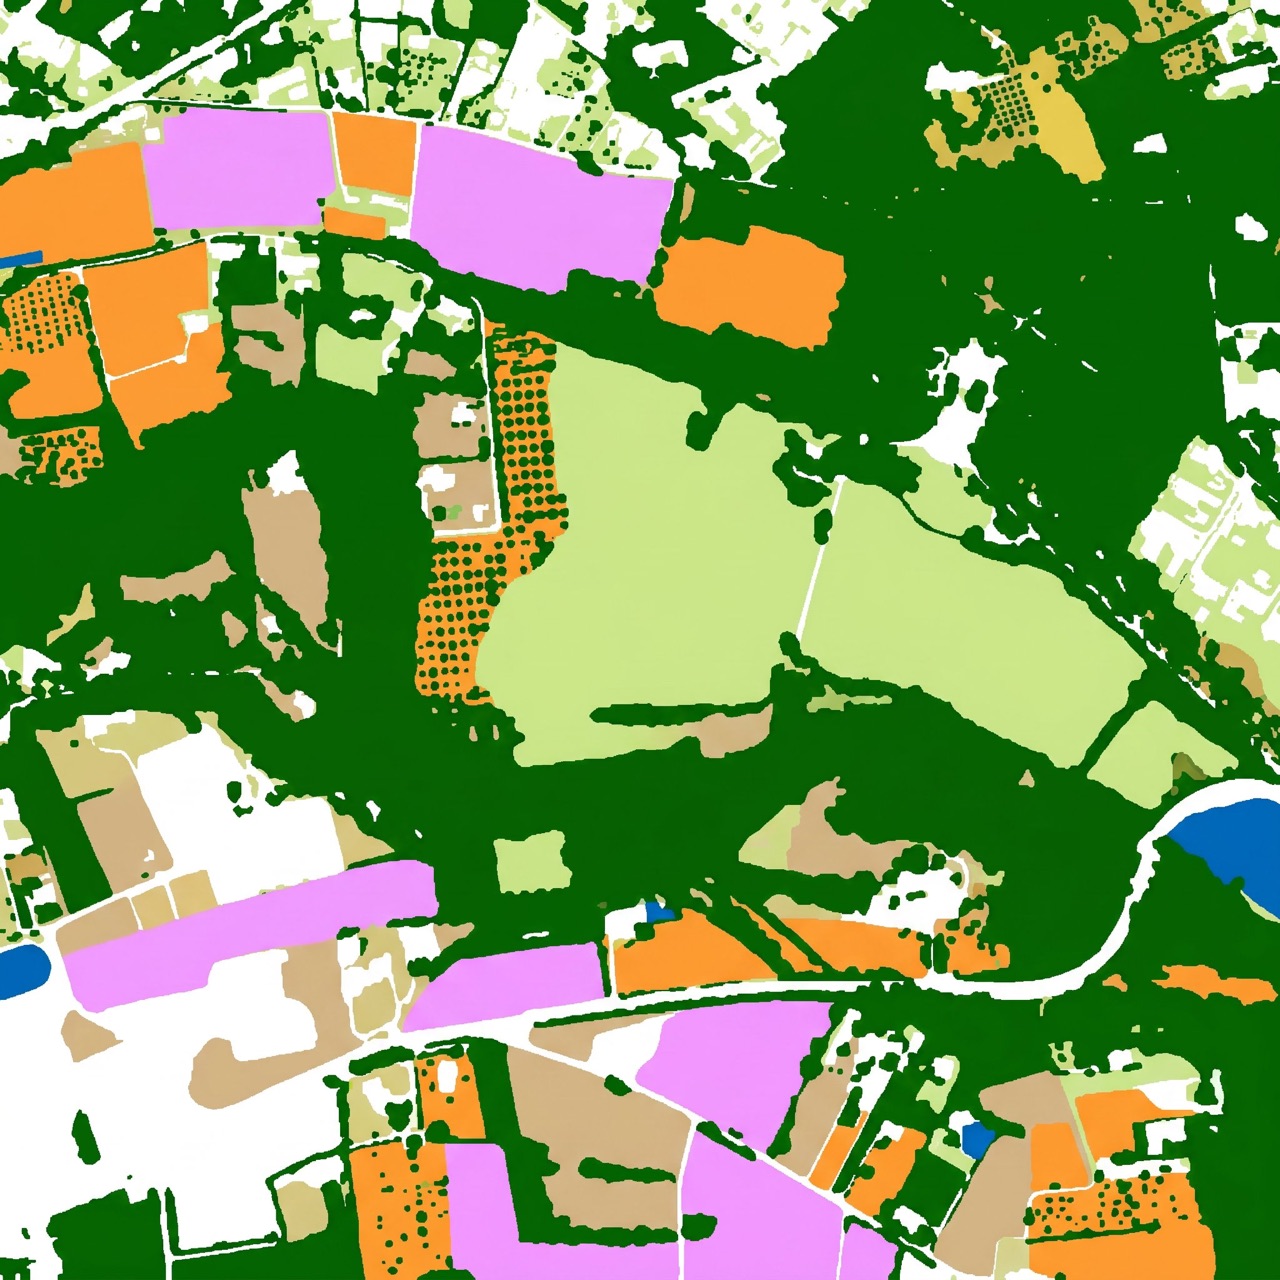
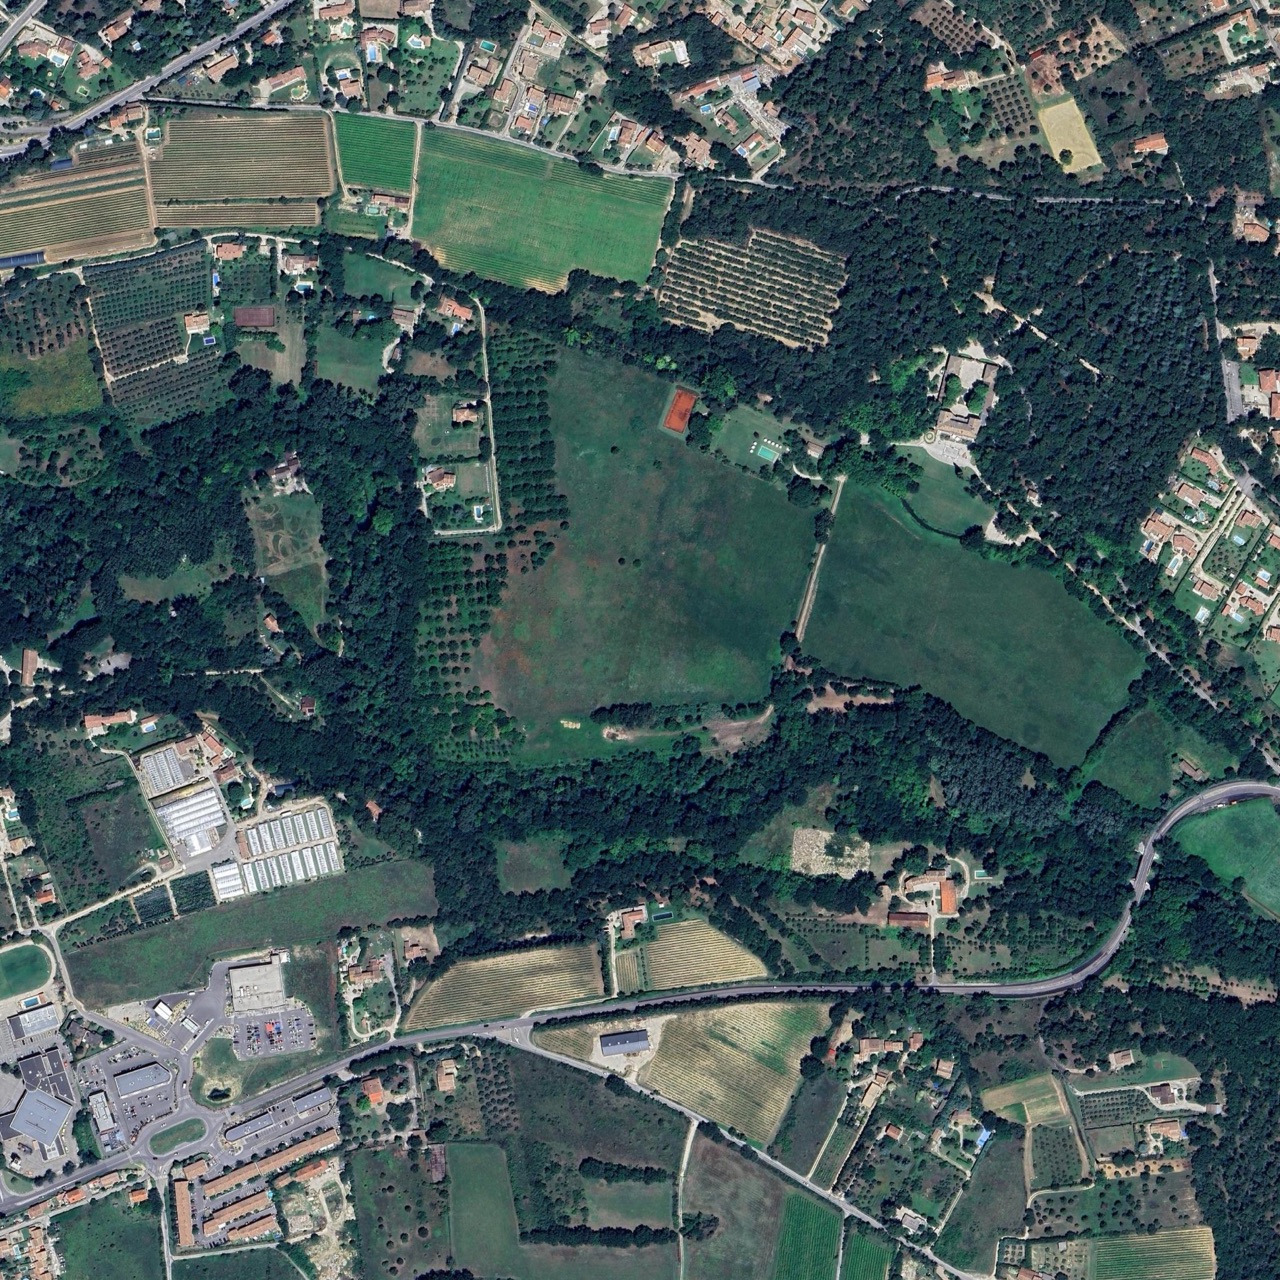
A reference image
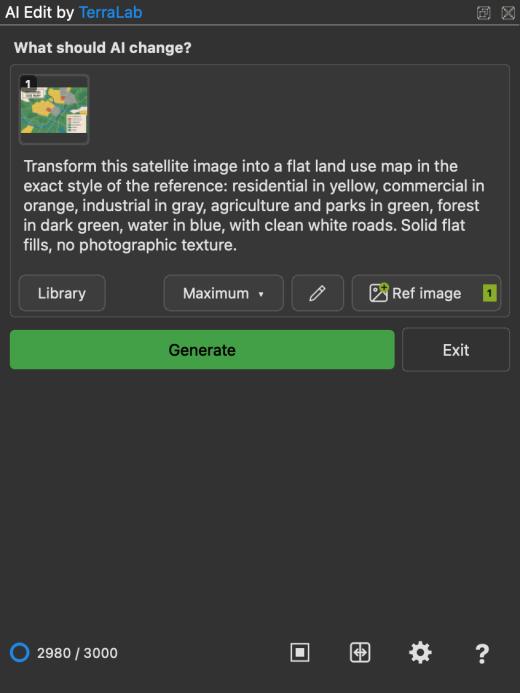
Attach an image from disk: a style sample, a target look, or a color legend. A common use is a land-use map with your exact legend, paired with a prompt like:
Transform into a land use map in the style of the reference.
The output then matches your palette every time.
A QGIS layer as reference
You can also feed a data layer you already have. Here, OpenStreetMap building footprints are attached so the AI knows exactly where buildings are.
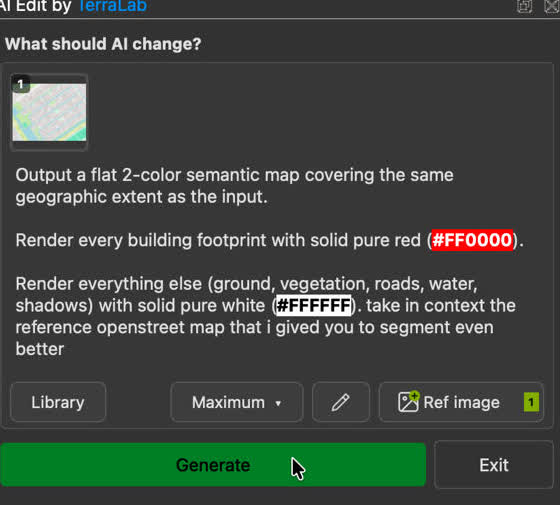
Give the model your land-use, water, contour, or footprint layers and it produces more accurate, better-aligned output.
Free vs Pro
The full prompt library, Markup, Vectorize, and references all work on the free tier. A Pro plan raises the limits: higher-resolution output (2K and 4K), several reference images per edit, and a larger monthly allowance for regular work.

Tips
- Set your basemap and zoom before drawing: the visible pixels are the input.
- Keep zones square-ish and modest in size for the sharpest results.
- For flat-color maps you plan to Vectorize, ask for solid fills and clean edges.
- Keep reference layers hidden.
Need help? Use the ? menu in the panel for the tutorial, the terms, and to report a problem.