Spatial Join in QGIS: By Location, Nearest, or With AI
Published
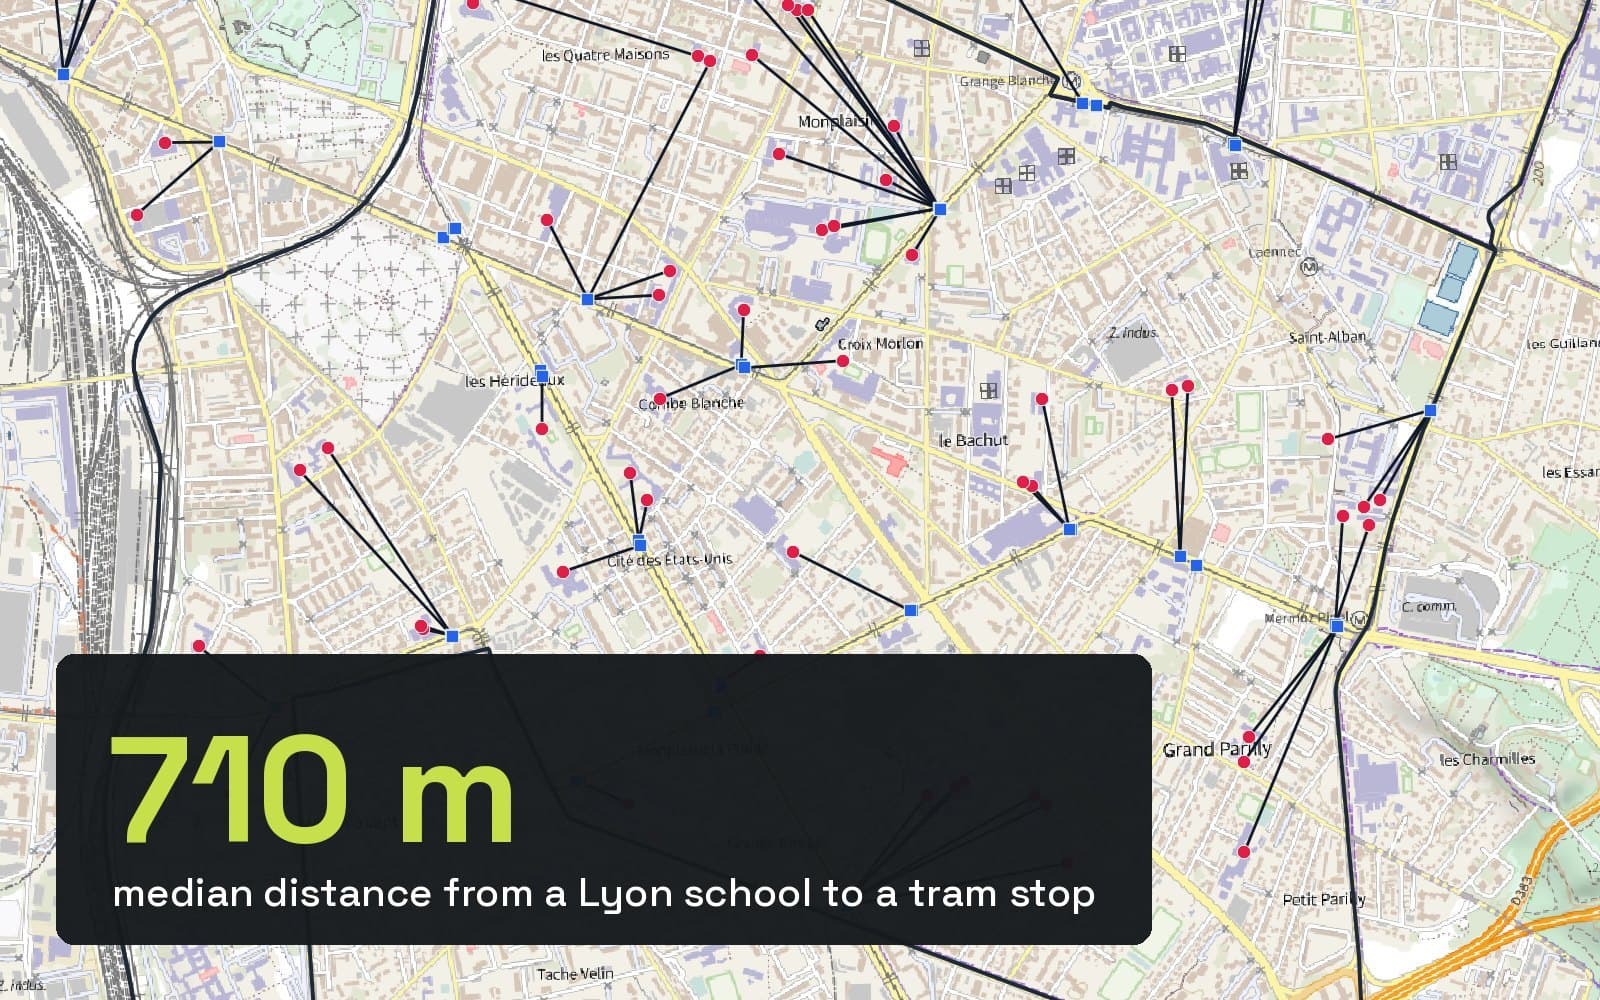
A spatial join copies the fields of one layer onto another based on where the features are, not on a shared ID. In QGIS, open Vector > Data Management Tools > Join Attributes by Location…, pick the layer that should get the new fields, the layer to take them from and a rule such as "intersect", then run it. For "which is closest" questions, use Join Attributes by Nearest instead, or type the whole task in one sentence to AI Agent.
 , open
 | What you want | Tool | Time on our test |
|---|---|---|
| Give each point the name of the area it falls in | Join Attributes by Location | 0.21 s, 382 schools |
| The same, typed as one sentence | AI Agent | 22 s, count and nearest together |
| Count or sum points per area | Join Attributes by Location (Summary) | 0.02 s, 9 areas |
| Find the closest feature and its distance | Join Attributes by Nearest | 0.06 s, 382 schools |
The test data
Every number in this guide comes from one run on real open data for Lyon, France, on 15 October 2026:
- 9 arrondissements (the city's districts) and 382 schools from OpenStreetMap.
- 106 tram stops from OpenStreetMap.
- 103,910 buildings from the IGN BD TOPO, the French national topographic database.
All layers are in Lambert-93 (EPSG:2154), a projected system in metres. The times come from QGIS 3.44 on a MacBook Air M4.
Method 1: Join attributes by location
This is the classic spatial join. Here, each school gets the name of its arrondissement.
Open the tool
Vector > Data Management Tools > Join Attributes by Location…. You can also search "join attributes" in the Processing Toolbox (Ctrl+Alt+T).
Pick the two layers
Join to features in is the layer that gets the new fields, here schools. By comparing to is the layer you take them from, here arrondissements.
Tick a predicate
intersect is the safe default for points in polygons. The section below shows what each box means.
Choose the fields and the join type
In Fields to add, keep only what you need, here name. Set Join type to one-to-one, and add a prefix such as arr_ so the new field is easy to spot.
Run it
Leave Joined layer as a temporary layer to check the result first, then save it as a GeoPackage.
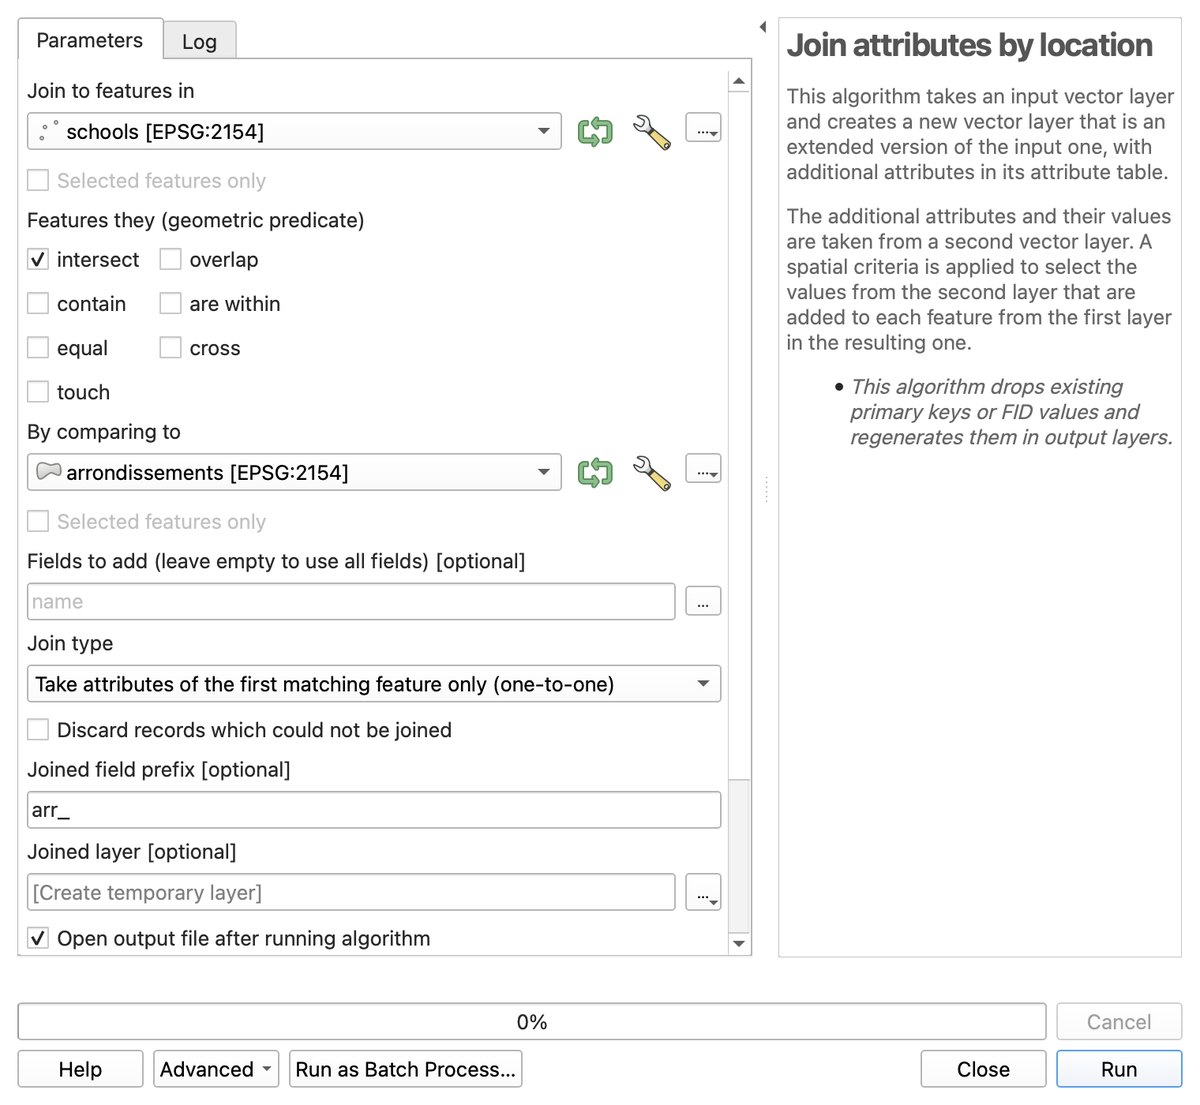
Tick Discard records which could not be joined only if you want to drop the misses. Leave it off at first: the empty rows tell you what went wrong.
Use it when: you want one or a few fields from the feature each object sits in or touches.
Skip it when: the features never touch, like a school and a tram stop. That is Method 4.
Method 2: Ask AI Agent in one sentence
AI Agent is our QGIS plugin that runs tasks from a typed request. It reads your layer names and fields, picks the tools and runs them in your project.
We gave it this, with the same Lyon layers loaded:
Count the schools in each arrondissement, then give every school the name of its nearest tram stop and the distance to it in metres.
It ran two QGIS processing tools, then a short Python step that wrote the two new fields into the schools layer. The panel showed "Worked for 22 s". It asked once for permission, because it was about to edit the GeoPackage on disk. Its counts matched our manual run exactly: 382 schools, from 27 in the 2nd and 4th to 56 in the 5th.
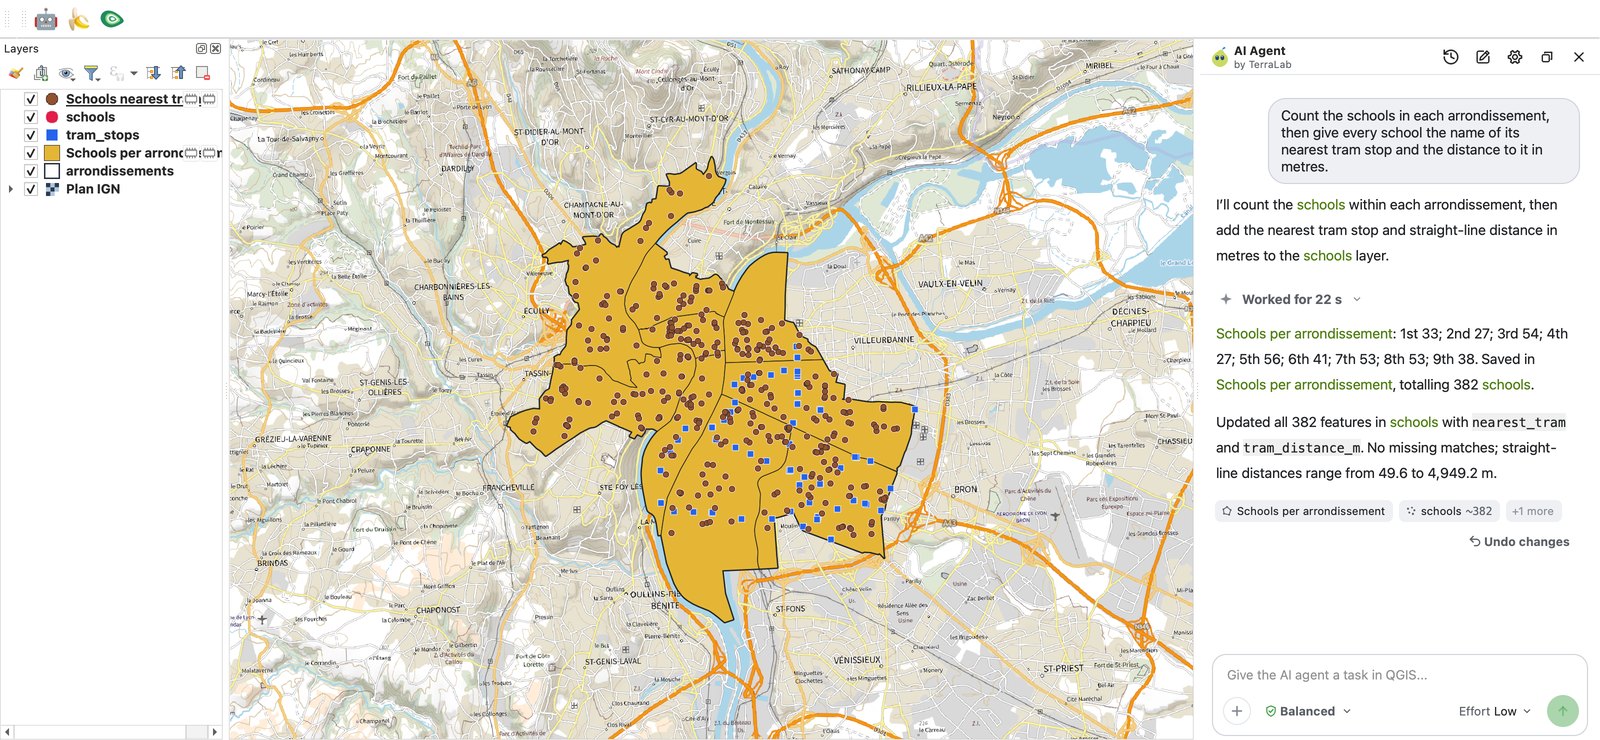
Use it when: you know the question but not which of the four join tools answers it, or you chain several steps.
Skip it when: you run the same join every week. Save it as a model or a Python script once.
Price: free plan, no card. Pro is €49 a month excluding VAT.
Method 3: Count and summarize with a spatial join
Method 1 gives each school its district. The reverse question, how many schools each district holds, needs the summary version.
Search Join attributes by location (summary) in the Processing Toolbox. Put the polygons in Join to features in, the points in By comparing to, and pick statistics in Summaries to calculate: count, sum, mean, median, minimum, maximum and more. QGIS adds one field per statistic, named like osm_id_count.
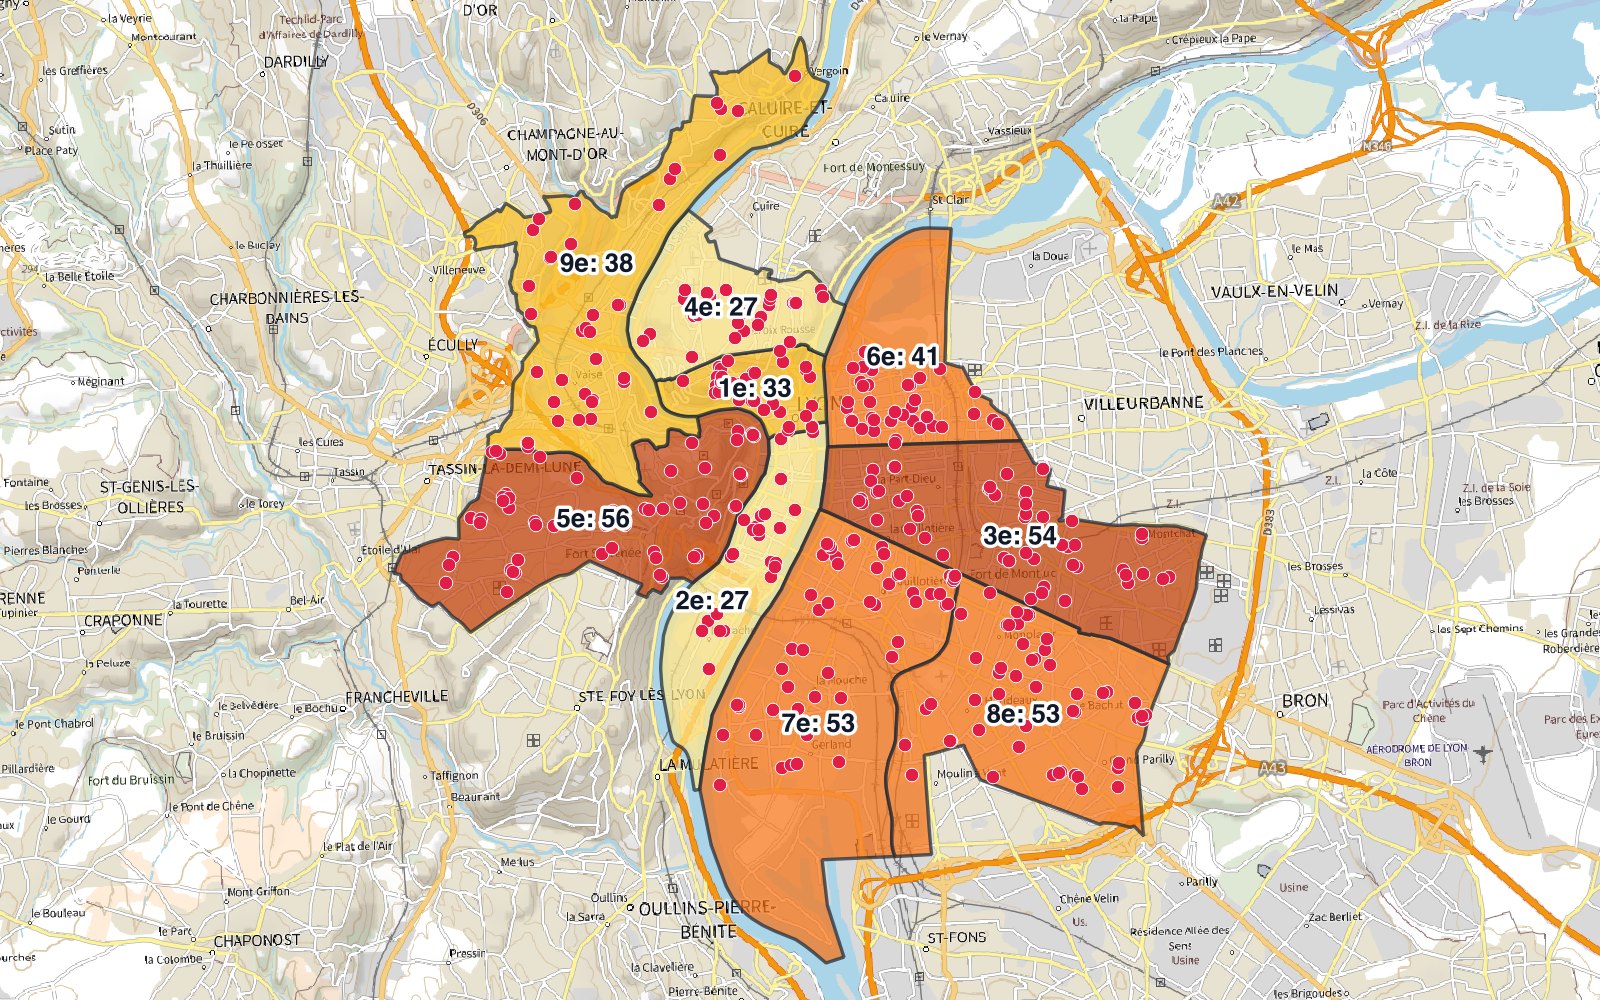
It also sums numbers. On the IGN buildings, one run gave each arrondissement its building count and the dwellings recorded in them: 9,474 buildings and 51,743 dwellings in the 3rd, the largest of both.
For a plain count, Vector > Analysis Tools > Count Points in Polygon… does the same with fewer settings.
Use it when: the answer is a number per area: count, total, average.
Skip it when: you need the list of matches itself. Use Method 1 with one-to-many.
Method 4: Join attributes by nearest
When features never touch, join them by distance. Search Join attributes by nearest in the Processing Toolbox.
Set Input layer to schools, Input layer 2 to tram_stops, and Maximum nearest neighbors to 1. QGIS adds the stop's fields plus a distance field, and the coordinates of both ends.
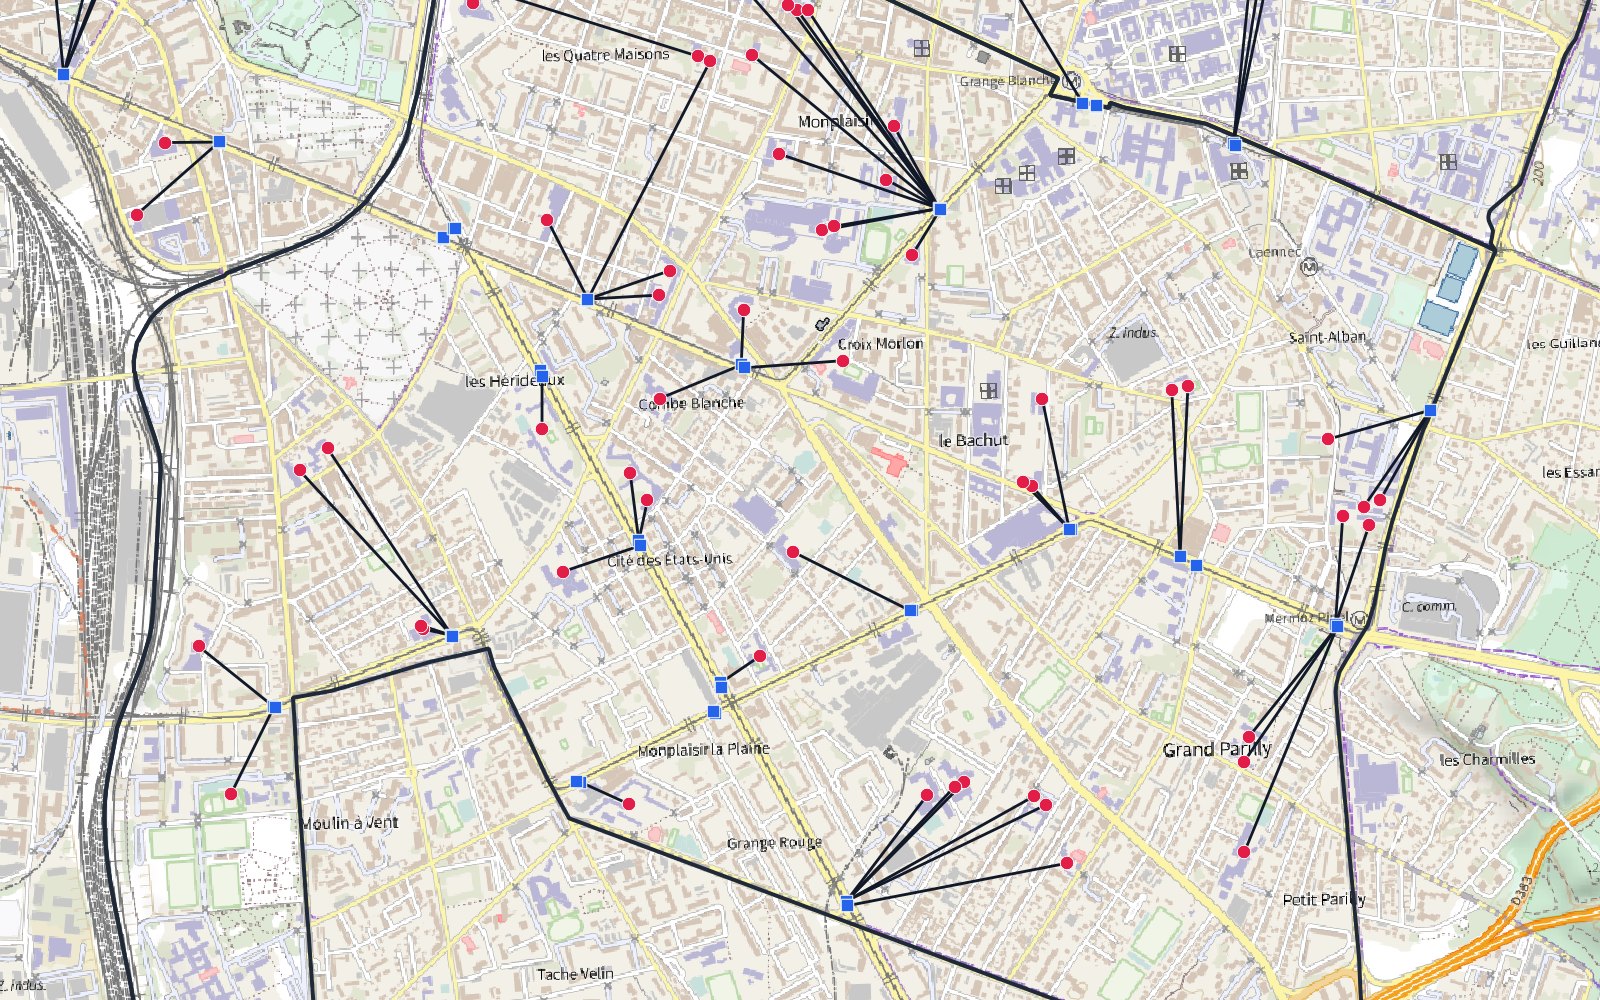
Two settings change the result:
- Maximum distance. With 300 m, only 86 schools got a stop. The other 296 stayed in the output with empty fields, unless you tick Discard records which could not be joined.
- Maximum nearest neighbors. With 3, the 382 schools became 1,146 rows, one per school and stop. An exact tie also adds a row: on the 103,910 IGN buildings we got 103,911 rows.
The distance is straight-line, not walking distance along streets.
Use it when: you ask "which is closest" and "how far".
Skip it when: you need travel distance. Use the Network analysis tools in the Processing Toolbox.
Which predicate to tick
The predicate is the spatial rule that decides a match. QGIS reads it as "layer A [predicate] layer B", where A is the layer that gets the fields.
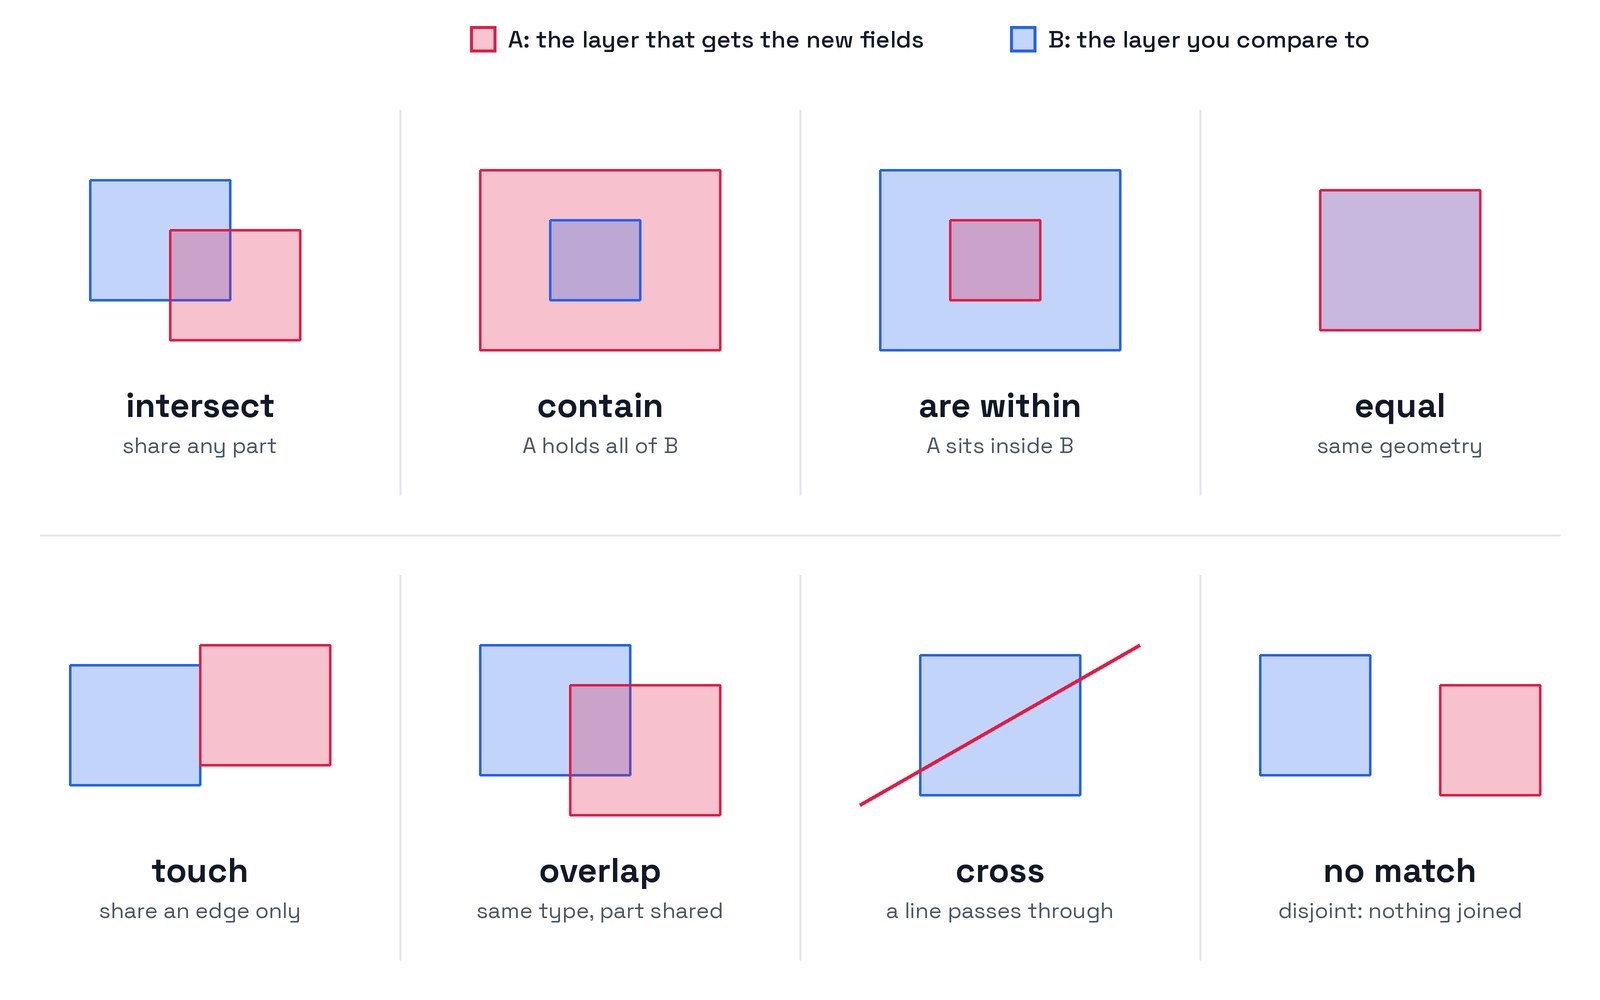
Three rules cover most work:
- intersect for points in polygons, and for anything that only needs to touch. It also catches features on the border.
- are within when the feature must sit wholly inside. On our buildings, 112 that intersect Lyon were not wholly within one arrondissement: 108 cross the city limit and 4 an inner border.
- contain for the reverse direction, polygons that hold points.
You can tick several boxes. A feature then matches if any of them is true.
One-to-one, one-to-many or largest overlap
A building on a border touches two districts. The Join type decides what happens to it. On the 46,250 IGN buildings that intersect Lyon:
| Join type | Rows out | Time |
|---|---|---|
| One-to-many (a feature per match) | 46,254 | 1.13 s |
| First matching feature only (one-to-one) | 46,250 | 0.99 s |
| Largest overlap only (one-to-one) | 46,250 | 9.62 s |
One-to-many duplicated the 4 buildings that straddle an inner border. That is right for a list of matches and wrong for any sum: those buildings would be counted twice.
"First matching" keeps whichever match QGIS meets first, so a border building can land in either district. "Largest overlap" picks the district that holds most of it, which is the fair answer, but it took ten times longer here.
CRS pitfalls
A wrong coordinate reference system rarely stops a join. It silently changes the result.
- Mixed CRS works for location joins. We left the schools in WGS 84 (EPSG:4326) and the districts in Lambert-93. QGIS reprojected on the fly and all 382 matched.
- Distances follow the input layer's units. Run Join by nearest on the WGS 84 files and the median "distance" comes out as 0.0071. Those are degrees, not metres. Reproject both layers to a projected CRS in metres first, with
Vector > Data Management Tools > Reproject Layer…. - Maximum distance uses the same units. A 300 in degrees covers the whole planet.
Our guide on what a CRS is explains degrees versus metres and how to fix a layer in the wrong place.
Speed on large layers
QGIS handles city-scale joins in seconds. On the 103,910 IGN buildings:
- One-to-one join to the 9 districts: 0.97 s from a GeoPackage.
- The same layer as a Shapefile: 1.69 s. After
Vector > Data Management Tools > Create Spatial Index…, 1.04 s. - Nearest tram stop for every building: 3.5 s.
- Largest overlap: 9.62 s, the slowest option.
Four habits keep big joins fast:
- Work from GeoPackage. It carries a spatial index. A Shapefile needs its
.qixfile, which Create Spatial Index writes. - Ask for fewer fields. Fill in Fields to add instead of copying everything.
- Avoid largest overlap unless border features really matter.
- Fix geometries first. An invalid polygon stops the run with "has invalid geometry". The Fix geometries tool in the Processing Toolbox repairs it. You can also change Invalid feature filtering under the wrench icon next to the input layer.
Check where your points sit, too. Only 211 of the 382 school points fell inside an IGN building. The rest mark playgrounds and yards, so "school inside building" would have missed 171 schools.
What to remember
Use Join Attributes by Location with intersect to give points the name of their area.
Use the Summary version to count or sum per area, and Join Attributes by Nearest for the closest feature and its distance.
Pick one-to-one for totals, and one-to-many when you need every match.
Reproject to a CRS in metres before any distance.
If you are not sure which tool fits, describe the result you want to AI Agent and check what it built.
Questions people ask
What is a spatial join in QGIS?
A spatial join adds the fields of one layer to another based on location: inside, touching or nearest. In QGIS the main tools are Join Attributes by Location, its Summary version for counts and statistics, and Join Attributes by Nearest for distances.
How do I join attributes by location in QGIS?
Open Vector > Data Management Tools > Join Attributes by Location…. Set the layer that gets the fields in Join to features in and the source layer in By comparing to, tick intersect, choose the fields and a one-to-one join type, then run it.
What is the difference between join by location and join by nearest?
Join by location needs the features to touch or overlap, under the predicate you tick. Join by nearest needs no contact: it finds the closest feature and adds a distance field, in the units of the input layer's CRS.
Why does my spatial join return empty fields?
Usually the features do not meet the predicate: points just outside the polygons, a predicate that is too strict such as "are within", or invalid geometries. Check both layers on the map, try "intersect", and run Fix Geometries. A missing CRS on one layer also misplaces it.
Can AI do a spatial join in QGIS?
Yes. AI Agent runs the QGIS tools from a typed request. On our Lyon test it did a count per district and a nearest join from one sentence in 22 seconds, with the same results as the manual run.