
Convert coordinates
Paste coordinates or click the map, in any system.
Click the map to read that place in every system
 QGIS plugin
AI Agent for QGIS
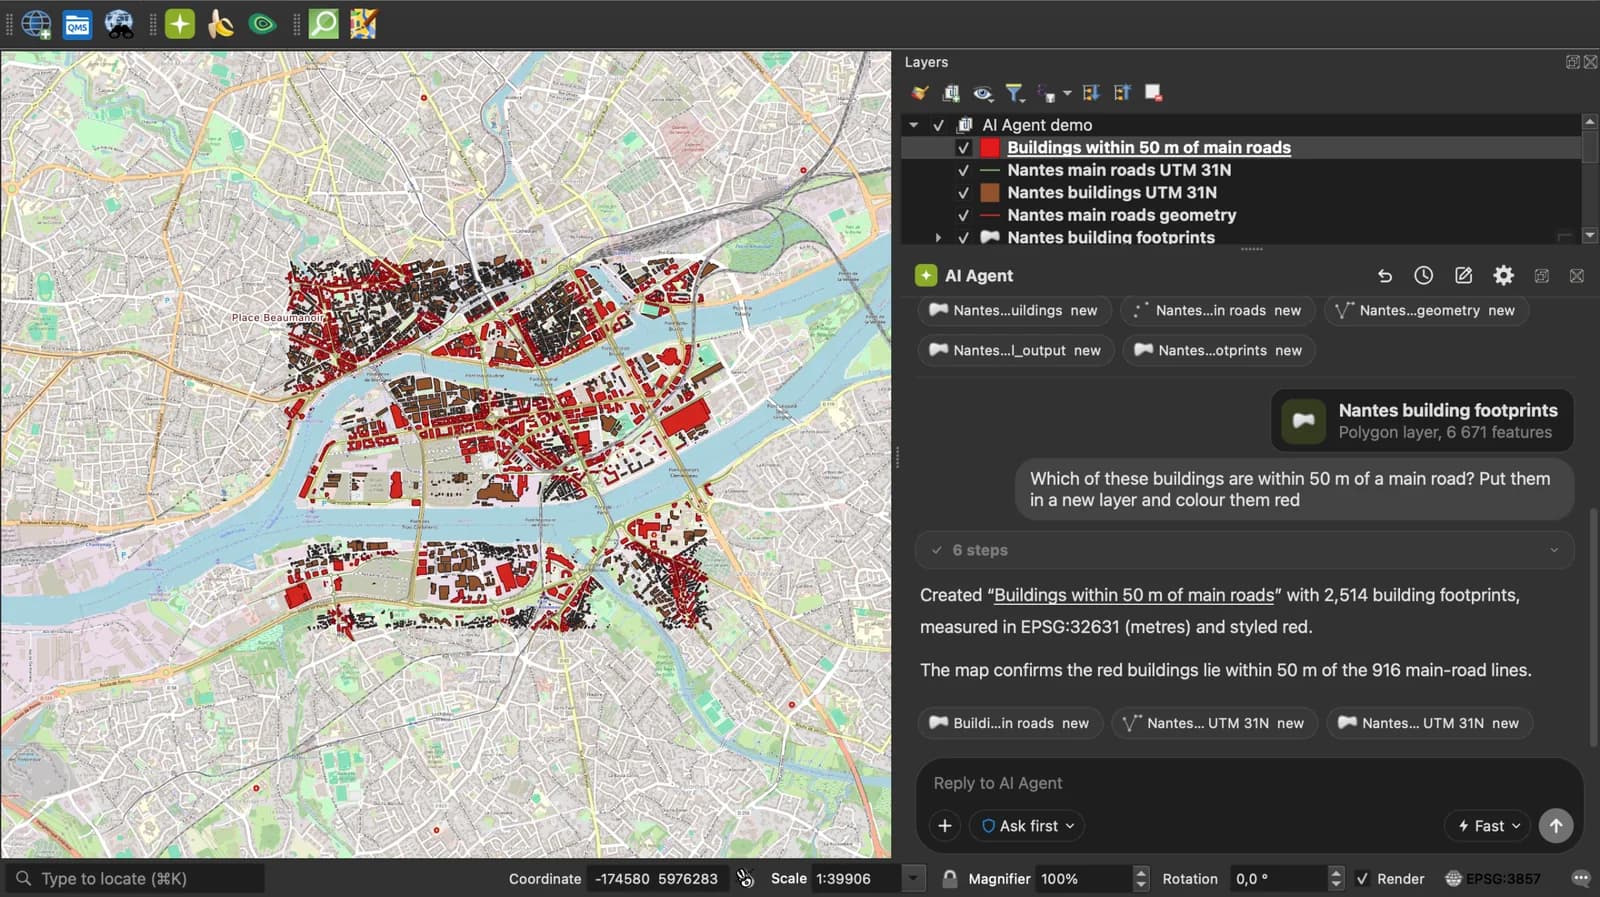
Got a list of coordinates? Ask AI Agent in QGIS to put them on a map, in the right projection.
 AI Segmentation
 AI Edit
Guide
How it works, formats and limits.
About this tool
Lambert 93, UTM, Web Mercator, national grids, GPS degrees or DMS. One point or a whole table, and nothing leaves your browser. Converts as you type. 223 coordinate systems.
How it works
- Pick the system your coordinates are in and the one you want. The list has the national grids of a dozen countries, every UTM zone, Web Mercator and plain latitude and longitude.
- Paste the coordinates, one point per line. Decimal degrees, degrees minutes seconds with N S E W letters, metres with a comma, a space or a tab: the page reads them all, and keeps any text after the numbers as a label.
- Read the table, copy it, or download it as CSV. The CSV drops into Excel, into QGIS, or into the CSV to KML converter on this site.
Systems in the list
Every definition is the EPSG registry's, run through proj4. The main ones, and what they are for.
| System | Where it is used |
|---|---|
| WGS 84 (EPSG:4326) | GPS receivers, phones, Google Maps, KML and GeoJSON. Latitude and longitude in degrees. |
| Web Mercator (EPSG:3857) | The tiles of every web map. Metres, but distorted away from the equator: never measure in it. |
| MGRS | The Military Grid Reference System: NATO forces, search and rescue, emergency services. UTM written with a zone, a 100 km square and up to 5 digits per axis, such as 31U DQ 48251 11932. |
| RGF93 / Lambert-93 (EPSG:2154) | The legal system of metropolitan France since 2000: cadastre, IGN, every French public dataset. |
| RGF93 / CC42 to CC50 | The nine French conic zones, one per degree of latitude, used by surveyors and local authorities where Lambert-93's distortion is too large. |
| NTF / Lambert II étendu (EPSG:27572) | The French system before Lambert-93. Old plans and legacy databases still carry it. |
| UTM zones (EPSG:326xx and 327xx) | The 60 six-degree strips used worldwide, north and south. The page can pick the zone from each point. |
| British National Grid, RD New, LV95, Lambert 72 and 2008, Gauss-Krüger, ETRS89 UTM, CS92, Monte Mario, SIRGAS, GDA2020, JGD2011, TWD97 | The national grids of the United Kingdom, the Netherlands, Switzerland, Belgium, Germany, Spain, Poland, Italy, Brazil, Australia, Japan and Taiwan. |
What it does not do
- Accuracy depends on the datum shift the EPSG registry publishes for each system. Between modern systems (RGF93, ETRS89, WGS 84) it is a few centimetres; from a legacy datum such as NTF, OSGB36 or DHDN it is about a metre, and that is the registry's limit, not the page's.
- No grid-file transformations. The NTF to RGF93 grid, the OSTN15 grid and the like need a desktop GIS. QGIS applies them on the fly.
- No heights. The third number of a line is ignored; altitude systems are a separate question.
- No British grid letters, no Plus Codes.
- A point outside the domain of the target projection is reported and left out, rather than placed somewhere wrong.
Frequently asked questions
Short answers to what people ask most.
Are my coordinates sent anywhere?
No. The conversion is proj4 running in your browser tab. The page makes no request while you use it; open the network panel to check.
How do I convert Lambert 93 to GPS coordinates?
Set From to RGF93 / Lambert-93, To to WGS 84, paste the X and Y in metres (X first, around 700 000; Y around 6 600 000) and convert. The result is latitude and longitude in degrees, with the degrees-minutes-seconds form next to it.
How do I convert MGRS to latitude and longitude?
Set From to MGRS and To to WGS 84, paste the grid reference with or without spaces (31U DQ 48251 11932 or 31UDQ4825111932) and convert. The result is latitude and longitude in degrees, here 48.8582 N, 2.2945 E. The MGRS converter page has this preset.
Which number comes first?
For degrees, the page reads latitude then longitude unless you switch the order or write N S E W letters, which decide on their own. For metres, easting (X) then northing (Y) by default. In Lambert 93 the X is always the smaller number.
Can I convert a whole spreadsheet?
Paste the two coordinate columns, one point per line; a header row is skipped and any third column becomes the label. Then download the CSV. A few thousand lines convert in under a second.
Why is my result 100 to 200 metres off?
The wrong source system, almost always: Lambert II étendu and Lambert 93 look alike but differ by hundreds of kilometres in Y, and choosing WGS 84 UTM for ETRS89 UTM coordinates shifts nothing in Europe but a metre elsewhere. Check the source, then check the axis order.
Which UTM zone should I choose?
Leave To on the automatic UTM entry and the page picks the zone from each point's longitude and hemisphere, showing the EPSG code it used in the last column.
How do I convert degrees, minutes and seconds (DMS) to decimal degrees?
Paste the DMS value as it is, 48°51'30"N 2°17'40"E, with From set to WGS 84: the page reads it and gives 48.858333, 2.294444. By hand, decimal degrees = degrees + minutes / 60 + seconds / 3600, negative for S and W: 48 + 51/60 + 30/3600 = 48.858333.
How do I convert decimal degrees to DMS?
Convert to WGS 84 and read the degrees-minutes-seconds form next to the decimal result. By hand: the whole number is the degrees, the rest times 60 gives the minutes, and what remains times 60 again gives the seconds. 48.8606 becomes 48° 51' 38.2".
How do I convert easting and northing to latitude and longitude?
Easting and northing are metres in a projected system, most often a UTM zone or a national grid. Set From to that system, To to WGS 84, paste easting then northing on each line and convert. For UTM, choose the zone printed with the coordinates: 33T means zone 33 north, since latitude bands N to X are north of the equator and C to M south.
Is WGS 84 the same as EPSG:4326?
Yes for everyday use: EPSG:4326 is the registry code for WGS 84 as a geographic system, latitude and longitude in degrees. GPS, KML and GeoJSON use it. It is not projected; its projected cousin for web maps is Web Mercator, EPSG:3857, in metres.
Is WGS 84 the same as NAD83?
Close, not equal. NAD83 (EPSG:4269) is fixed to the North American plate while WGS 84 follows the whole Earth, and the drift of the plate has opened a gap of about 1 to 2 metres in the United States. A phone GPS or a web map does not show it; survey work should use the realization the data names.