
Convert CSV to GeoJSON
One point feature per row, every column a property.
Nothing is uploaded
 QGIS plugin
AI Agent for QGIS
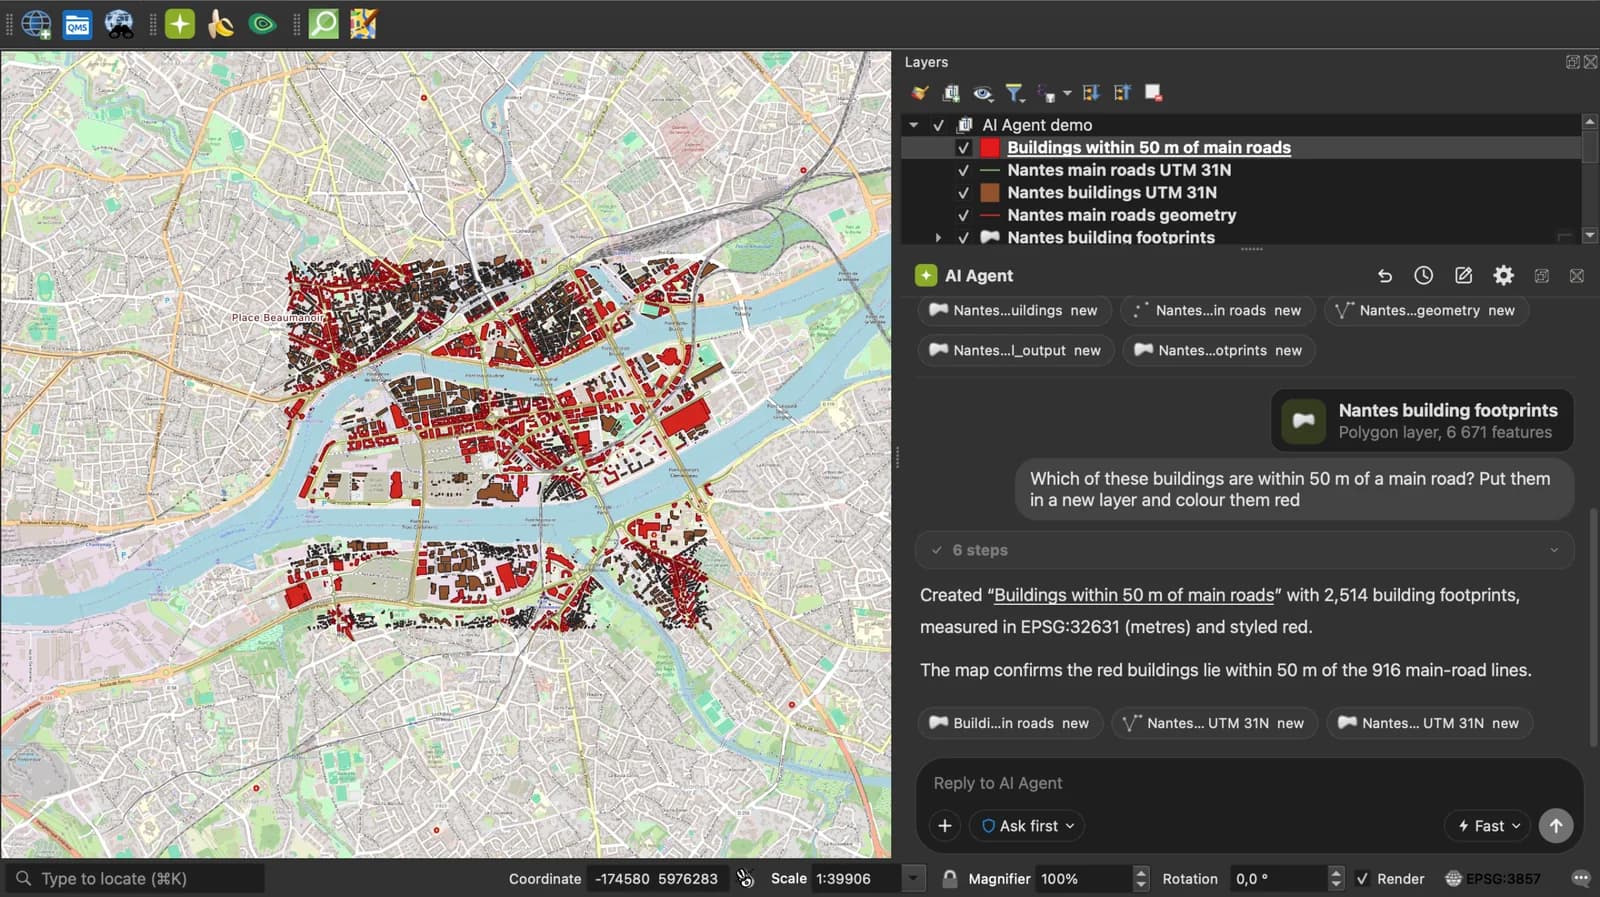
Skip the converter next time: ask AI Agent in QGIS to convert, reproject and load your files.
 AI Segmentation
 AI Edit
Guide
How it works, formats and limits.
About this tool
One point feature per row, every column a property. Free, and the file never leaves your browser.
How the conversion works
- Choose a .csv file, drop it here, or paste the table. Comma, semicolon and tab are recognised.
- The latitude and longitude columns are found by name. Each row becomes a Point feature and every other column a property, kept as text. A wkt column gives lines and polygons instead of points.
- Download the .geojson and drop it into geojson.io, Leaflet, Mapbox GL, QGIS or a PostGIS import.
How each column is used
Column names are matched after lowercasing and stripping spaces and underscores, so Latitude, LAT and lat_dd all work.
| Column | In the GeoJSON |
|---|---|
| latitude, lat, y, northing | The second coordinate of the Point. Decimal degrees; a decimal comma is accepted. |
| longitude, lon, lng, long, x, easting | The first coordinate of the Point. |
| wkt, geometry, geom, the_geom | Well-known text, used when a row has no coordinate pair. All seven WKT types are read. |
| name, description | Kept as properties.name and properties.description, the names Leaflet popups and Mapbox styles usually read. |
| Every other column | A property named after the column, as a string. |
What it does not do
- Coordinates must be degrees. GeoJSON is WGS 84 by definition; a CSV in UTM or Lambert metres has to be converted first, the coordinate converter on this site does that.
- Values stay strings. A column of numbers is not turned into numbers, because a CSV does not say which columns are numeric. Cast them in your code or in QGIS.
- Rows without a readable coordinate pair are kept with a null geometry and counted in the notice, so no attribute is lost.
- When most latitudes are beyond 90, the two columns are swapped and a notice says so.
Frequently asked questions
Short answers to what people ask most.
Does my CSV get uploaded?
No. The conversion runs in your browser tab; nothing is sent anywhere.
Will Leaflet show it?
Yes. Pass the parsed file to L.geoJSON. Coordinates are longitude first, as GeoJSON requires, which is the reverse of how Leaflet's own LatLng reads.
Why are my numbers in quotes?
Because CSV has no types. Every property is a string. Convert with Number() in JavaScript, or set the field type when loading in QGIS.
My longitudes and latitudes were swapped in the output.
The columns were probably named x and y the other way round from what the page expects, and fewer than half the values exceeded 90, so the swap guard did not fire. Rename the columns latitude and longitude.
Can it make polygons?
From a wkt column, yes. A CSV listing one vertex per row is not joined into a shape; build the WKT first or use Points to Path in QGIS.