AI Map Generator for Real Places: Image Models vs a GIS Agent
Published
Most tools that rank for "AI map generator" draw a picture that looks like a map. For a real place, you need an AI that reads GIS data instead of guessing pixels. In my test on Recife, Brazil, two image models put zero real parks or schools inside the 1 km zones they drew, while a GIS agent inside QGIS matched OpenStreetMap on all 50 parks and 18 schools.
 matched OpenStreetMap on all 50 parks and 18 schools.
I ran that test on 7 November 2026 with one prompt, written down with its pass criteria before any run:
A map of the parks and schools within 1 km of the metro stations of central Recife, Brazil, with a legend and a scale bar
Here is what each kind of tool actually produces, how to build the same map for free in QGIS by hand, and what happened when I gave the sentence to an agent inside QGIS.
6 of 9
Top Google results for 'ai map generator' that are fantasy or D&D tools
0 / 10
Named parks and schools on each image model's map that were real and within 1 km
50 & 18
Real OSM parks and schools found by both the manual QGIS method and the GIS agent
What is an AI map generator?
An AI map generator is any tool that turns a text prompt into a map. In practice, that label covers three very different things, and Google mixes all three on the same page. When I pulled the top organic results for "ai map generator" in the US on 7 November 2026, 6 of the 9 results were fantasy, Dungeons & Dragons or tabletop battle-map generators (Recraft, a Reddit r/DnD thread, Adobe Firefly, TT-RPG, ZSky AI and OpenArt). Only 3 dealt with real places at all, and none showed a map of a real area built from open data with a legend and a scale bar.
The three kinds are:
- Fantasy and game map generators (Recraft, Adobe Firefly's fantasy maker, TT-RPG, ZSky, OpenArt, Perchance). Text-to-image models tuned to draw fictional continents, parchment worlds or dungeon grids. Great for a campaign, not built for real geography.
- General image models (such as Google's Gemini image models, or the image tools inside ChatGPT and Midjourney) and pin-map tools (such as Proxi's MapsGPT or PamPam). Image models paint a flat JPEG that imitates a street map. Pin-map tools drop markers on a web map from an LLM's memory; MapsGPT's own page calls its output "Places come from public data and an AI's best guess" and adds "It's a good starting point, not a guarantee."
- A GIS agent running inside desktop GIS software such as QGIS. Instead of drawing pixels, it downloads vector layers from sources like OpenStreetMap, runs spatial tools (a metric buffer, an intersection), styles the layers and builds a print layout you can edit or export to PDF.
If you need an island for a novel, the first group is what you want. If someone is going to walk, build or make a decision from the map, only the third group works on real coordinates.
The test: one prompt in Recife, four ways
I picked Recife because it has a clear coast on the east, two rivers (the Capibaribe and Beberibe) meeting near the centre, a metro line (Metrorec) and good OpenStreetMap coverage. Before running anything, I pulled the ground truth from OpenStreetMap (railway=station with station=subway, leisure=park and amenity=school) and wrote the pass rules:
- Stations must be real Metrorec stations in the right order, at least Recife and Joana Bezerra.
- Every park or school label on an image is checked against OSM: does a feature of that name and type exist in Recife, and does it lie within 1 km of a real station?
- The scale bar must agree with the real 1,192 m straight-line distance between Recife and Joana Bezerra stations within 25%.
- For the GIS agent: a true 1,000 m buffer in a metric CRS, park and school counts matching my own OSM geometry check, a layout with legend and scale bar, and data attribution.
| Method | Time | Real park & school names (and within 1 km) | Real station names | Data source & licence stated | Editable GIS layers | Export |
|---|---|---|---|---|---|---|
Gemini 3 Pro Image (gemini-3-pro-image) | 18.2 s | 7 of 10 exist in Recife (0 of 10 within 1 km) | 3 of 6 | None | No (flat 1408 x 768 JPEG) | JPEG |
Gemini 3.1 Flash Image (gemini-3.1-flash-image) | 10.9 s | 5 of 10 exist in Recife (0 of 10 within 1 km) | 3 of 6 | None | No (flat 1408 x 768 JPEG) | JPEG |
| AI Agent in QGIS (Medium effort, one message) | 88.7 s | 50 parks, 18 schools (100% match to OSM ids, not labelled by name) | 2 of 2 (central only) | Yes: OSM (ODbL 1.0), Overture Maps | Yes, 6 styled layers in EPSG:31985 | QGIS layout, PDF, PNG, GeoPackage |
| Manual QGIS (6 steps, OSM data) | Not timed (run by script) | 50 parks, 18 schools (same OSM ids) | 2 of 2 | Yes: OSM (ODbL 1.0) | Yes | QGIS layout, PDF, PNG, GeoPackage |
What image models get wrong on a real city
I sent the prompt once to gemini-3-pro-image and once to gemini-3.1-flash-image through the Gemini API with default settings and no system prompt. One image per model is a single sample, not a statistical benchmark, so treat the counts below as what happened on my run rather than a fixed rate.
At a glance, both images look convincing. Even though the prompt was in English, both wrote their labels in Portuguese, put the Atlantic Ocean on the right-hand side where Recife's coast is, drew red metro icons with 1 km circles around them, and added a legend and a scale bar.
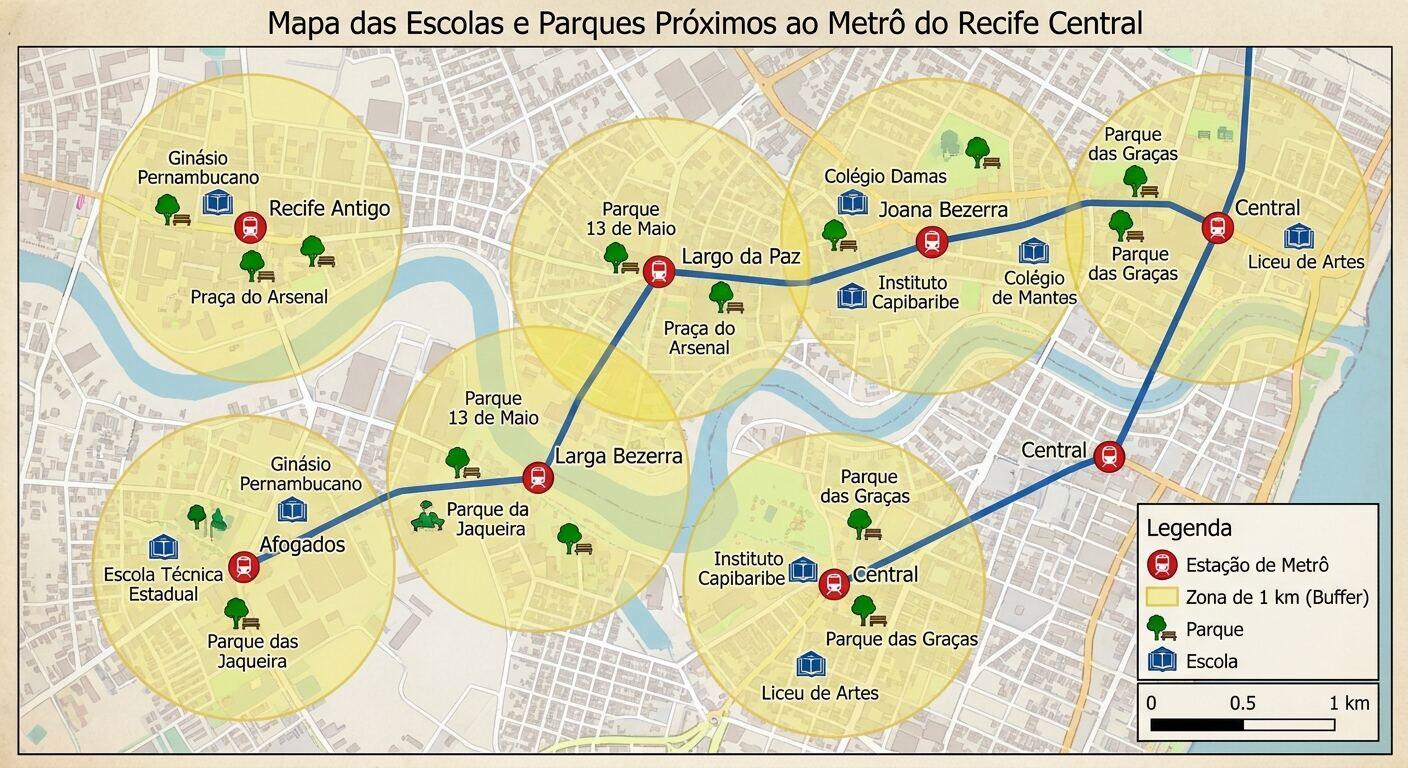
When you check the names against OpenStreetMap, the map falls apart. On the Pro image, 7 of the 10 distinct park and school names are real places in Recife (such as Parque 13 de Maio, Parque da Jaqueira, Ginásio Pernambucano and Colégio Damas). One is a street rather than a park (Praça do Arsenal), and two do not exist in OSM (Parque das Jaqueira and Colégio de Mantes).
The bigger problem is where they are. Every label on the image sits inside a drawn 1 km circle, because that is what the prompt asked for. In reality, not one of the 10 named parks and schools lies within 1,000 m of a real metro station. The closest is Liceu de Artes e Ofícios at 1,101 m from the Recife station; Parque 13 de Maio is 1,248 m away; Parque da Jaqueira is 4,144 m away. The model remembered real names from Recife and painted them inside its circles.
The stations have the same problem. Only 3 of the 6 distinct station names on the Pro image are real Metrorec stations (Largo da Paz, Joana Bezerra and Afogados). "Recife Antigo" is a neighbourhood, "Larga Bezerra" blends Largo da Paz with Joana Bezerra, and the label "Central" appears on three separate red icons in three parts of the map. In OSM, Afogados and Largo da Paz are 489 m apart; measured against the image's own 1 km scale bar, the Pro image draws them 2.8 km apart.
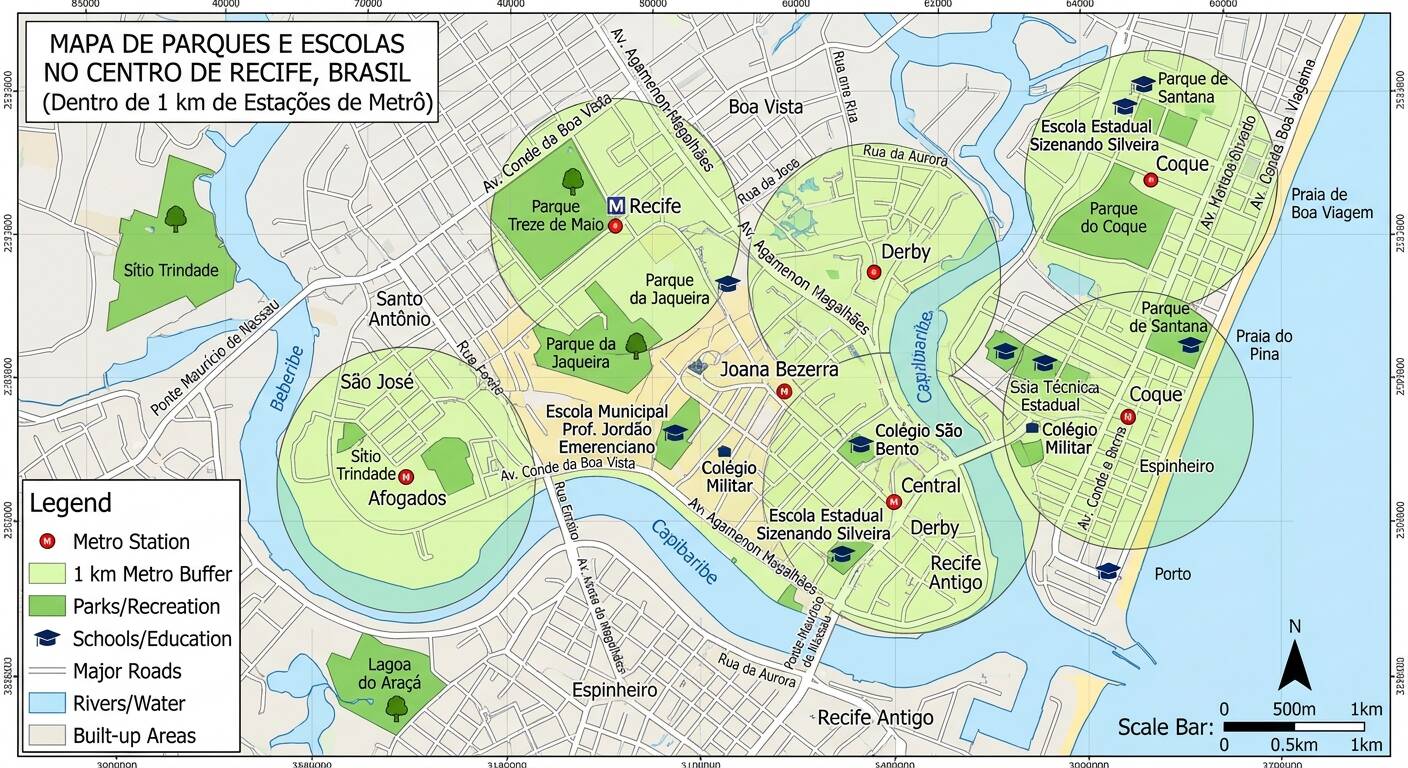
The Flash image (gemini-3.1-flash-image, 10.9 s) is worse on the labels: 5 of its 10 distinct park and school names are real parks or schools in Recife, 2 are the wrong type (Lagoa do Araçá is a pond, and Escola Estadual Sizenando Silveira only appears in OSM as a bike-share station named after it), and 3 do not exist in OSM. Again, none of the real parks or schools is within 1 km of a central metro station.
It also invents cartographic detail. Along the top and left border it prints coordinate ticks (85000, 40000, 70000) that belong to no coordinate system, and the bottom tick row dissolves into unreadable shapes. On the coast, it draws Praia de Boa Viagem north of Praia do Pina; in Recife, Boa Viagem is about 3.7 km south of Pina.
None of that is surprising once you remember how an image model works. It has no GIS layer, no coordinate system and no way to measure 1,000 m. It predicts pixels that look like a map of Recife.
How to make the real map for free in QGIS
Before looking at an AI agent, here is the standard, free way to build this map in QGIS using OpenStreetMap data. If you have never made a layout before, our guide on how to make a map in QGIS covers the basics in more detail, and our OpenStreetMap download guide for QGIS walks through QuickOSM.
Download parks, schools and subway stations from OpenStreetMap
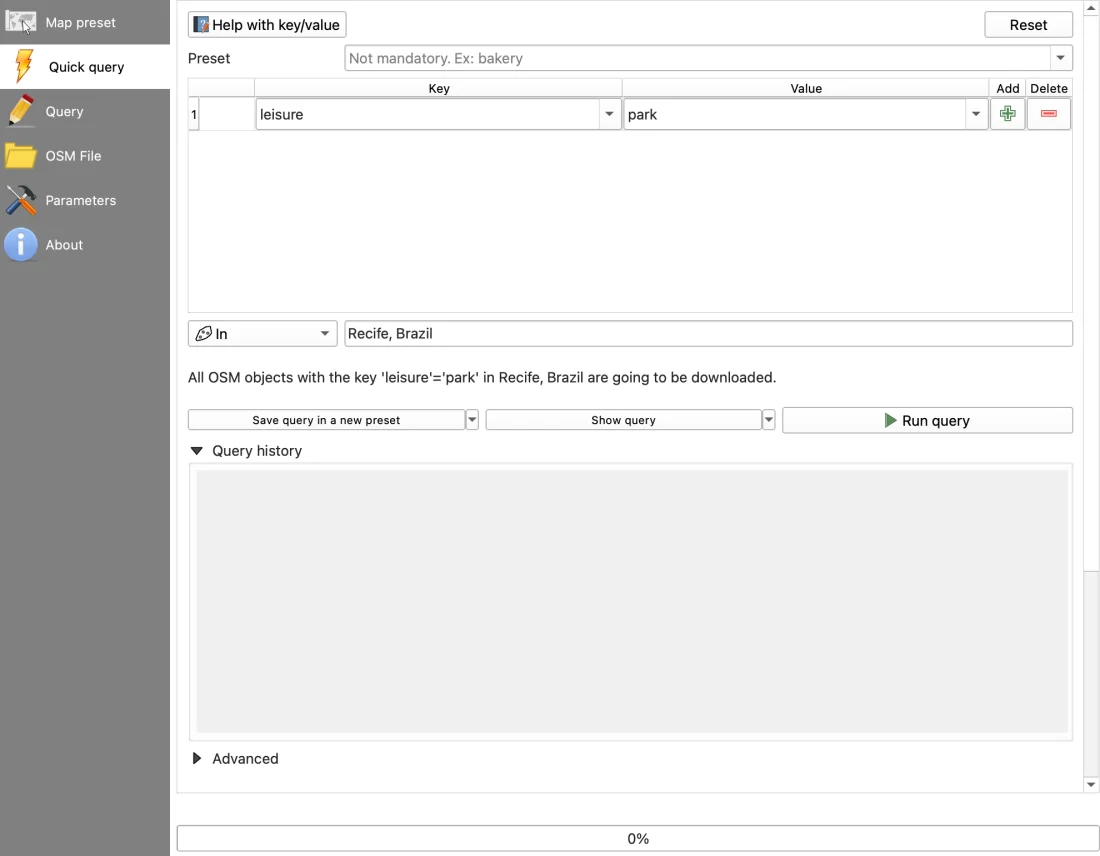
Install the free QuickOSM plugin if you don't have it, then open Vector > QuickOSM > QuickOSM…. In the Quick query tab, run three queries with In set to Recife, Brazil:
leisure=parkamenity=schoolrailway=station(and add a second row withstation=subway)
Keep the central metro stations
If you loaded a raw .osm file as I did, the tags sit inside other_tags on the points layer. Open Processing Toolbox > Vector selection > Extract by expression and run:
"other_tags" LIKE '%"railway"=>"station"%' AND "other_tags" LIKE '%"station"=>"subway"%' AND "name" IN ('Recife','Joana Bezerra')
That leaves the 2 central station points.
Reproject to a metric CRS
OpenStreetMap data arrives in degrees (EPSG:4326). A buffer in degrees is meaningless, so reproject your station, park and school layers first with Vector > Data Management Tools > Reproject Layer… to EPSG:31985 (SIRGAS 2000 / UTM zone 25S, which measures in metres).
Build the 1,000 m buffer
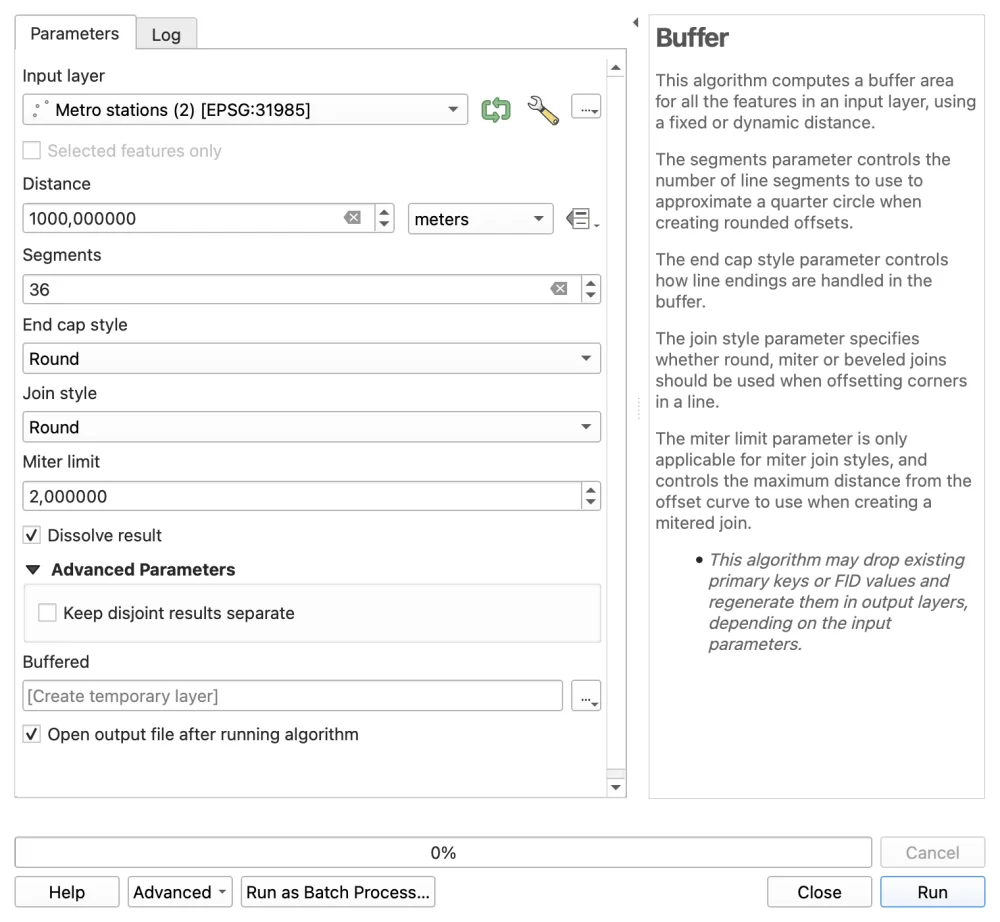
Open Vector > Geoprocessing Tools > Buffer…. Set the input to your reprojected stations, Distance to 1000 metres, Segments to 36, tick Dissolve result, and run it. You get one merged polygon of 5,374,942 m².
Extract the parks and schools inside the buffer
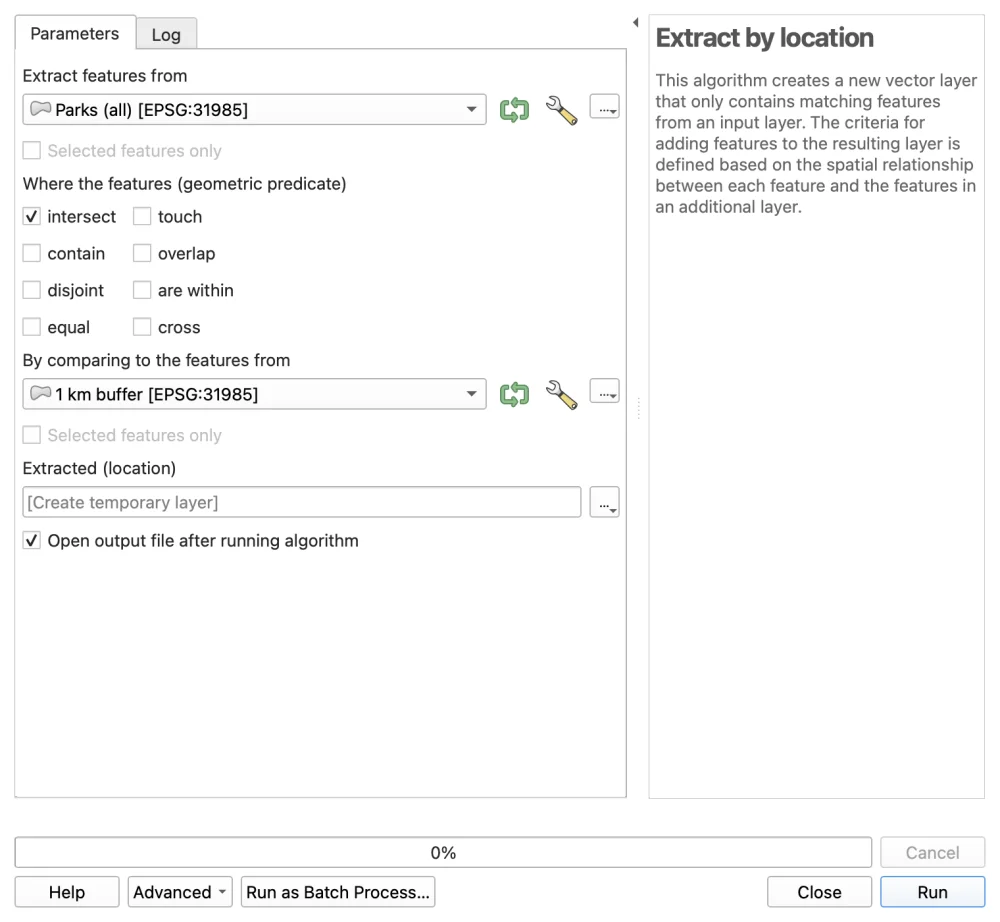
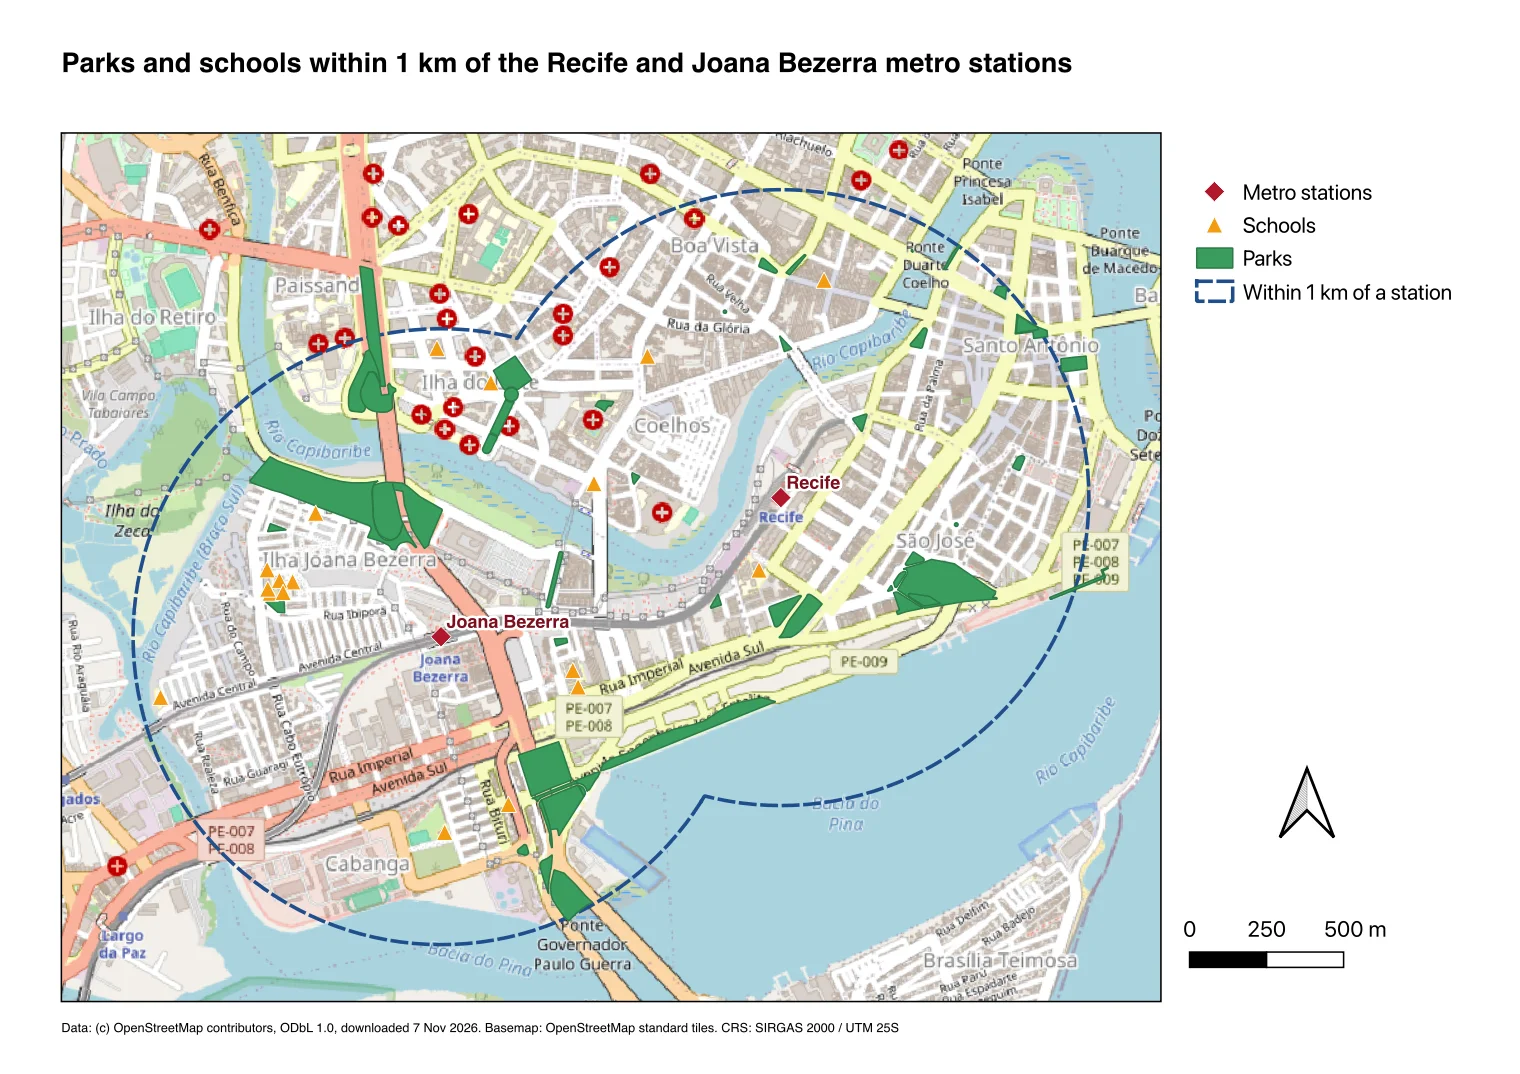
Open Processing Toolbox > Vector selection > Extract by location. Select features from your reprojected parks layer where the features intersect the 1,000 m buffer. Repeat for schools (in OSM, 17 of the schools in this zone are mapped as polygons and 1 as a point; run Vector > Geometry Tools > Centroids… on the polygons and Merge vector layers if you want all 18 drawn as dots). That leaves 50 parks and 18 schools.
Add a basemap and build the print layout
Add OpenStreetMap from the Browser panel under XYZ Tiles, style your layers, and open Project > New Print Layout…. Add the map frame, a legend, a scale bar, a north arrow and an © OpenStreetMap contributors (ODbL) credit line, then export with Layout > Export as PDF….
Here is the QuickOSM dialog from step 1, set up for leisure=park in Recife:
And the two Processing dialogs that do the real spatial work in steps 4 and 5, buffering in metres and extracting by location:
Once the buffer exists, Extract by location filters the 135 parks in the downloaded area down to the 50 that touch the 1 km zone:
Putting those layers on an OpenStreetMap basemap in a QGIS print layout gives a verifiable reference map with the exact 50 parks and 18 schools:
A GIS agent on the same prompt
We build AI Agent, so this section tests our own plugin on the exact same sentence. It is a chat panel docked inside QGIS (covered in detail in our complete guide to AI Agent for QGIS). Instead of generating an image, it reads your project, fetches vector datasets, runs QGIS Processing tools and builds a print layout.
I started from an empty QGIS 3.44.15 project on macOS, set the effort to Medium and permissions to Balanced, pasted the exact test prompt, and clicked Send once. No follow-up message, no question card and no manual tweak.
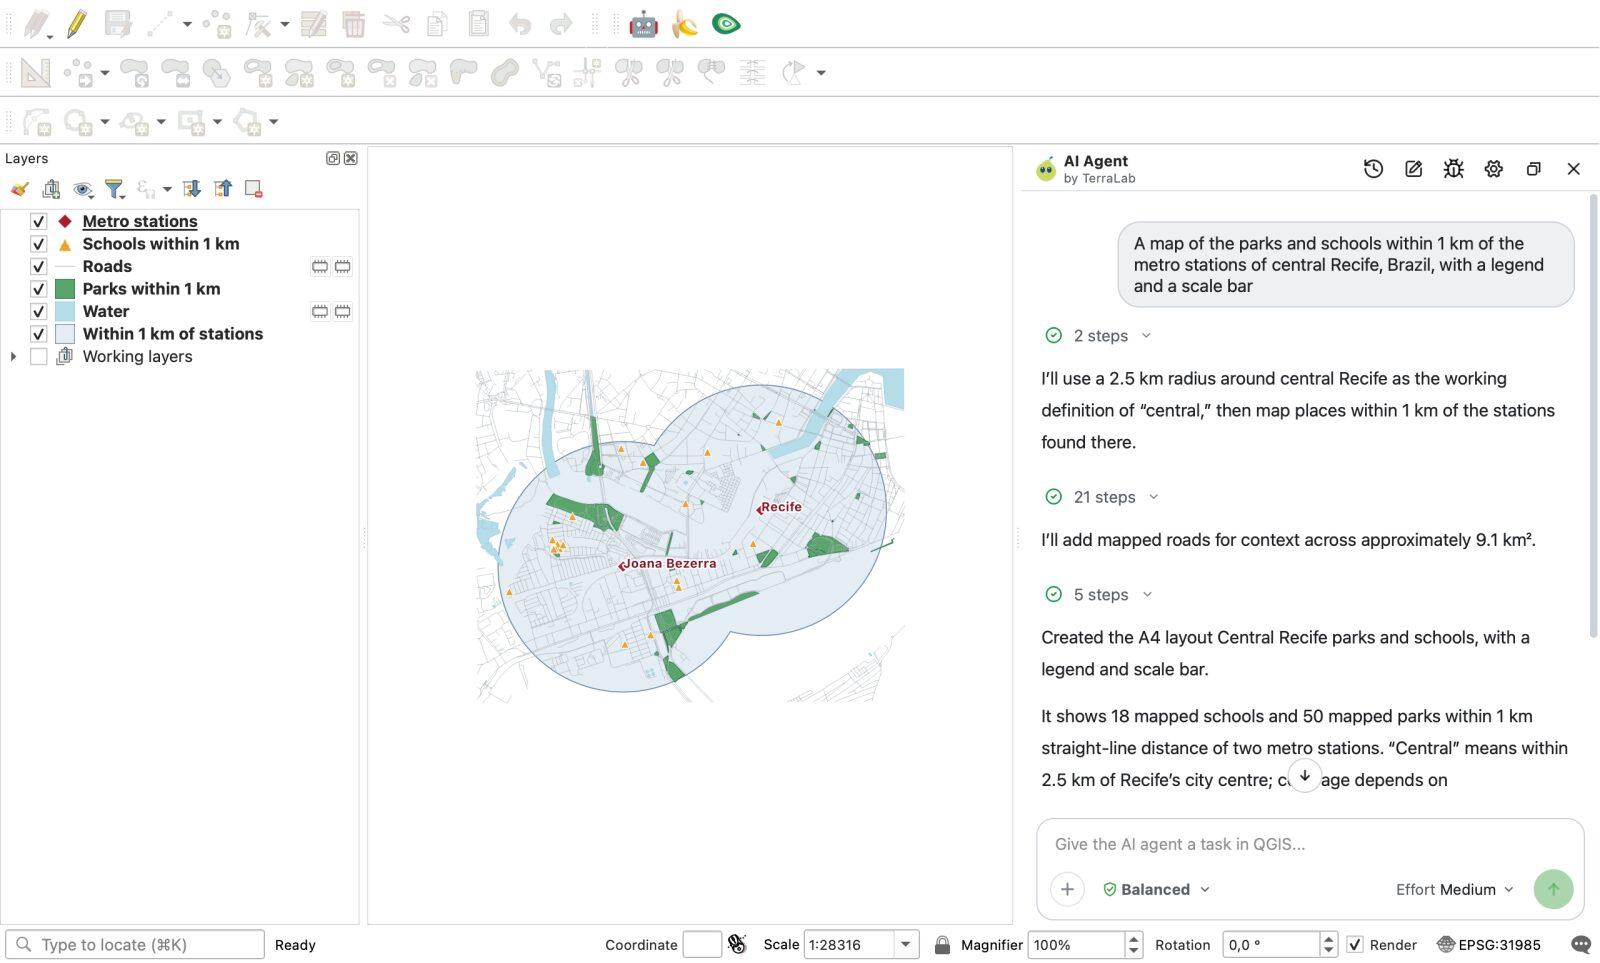
It finished in 88.7 seconds (34 internal tool calls, 0 errors). It reads OpenStreetMap from an extract we host (dated 19 October 2026), so the public servers that refused me that day did not stop it. It switched the project to EPSG:31985 (SIRGAS 2000 / UTM zone 25S), pulled the metro stations, buffered them by 1,000 m, clipped the parks and schools, styled six layers, and built an A4 landscape layout.
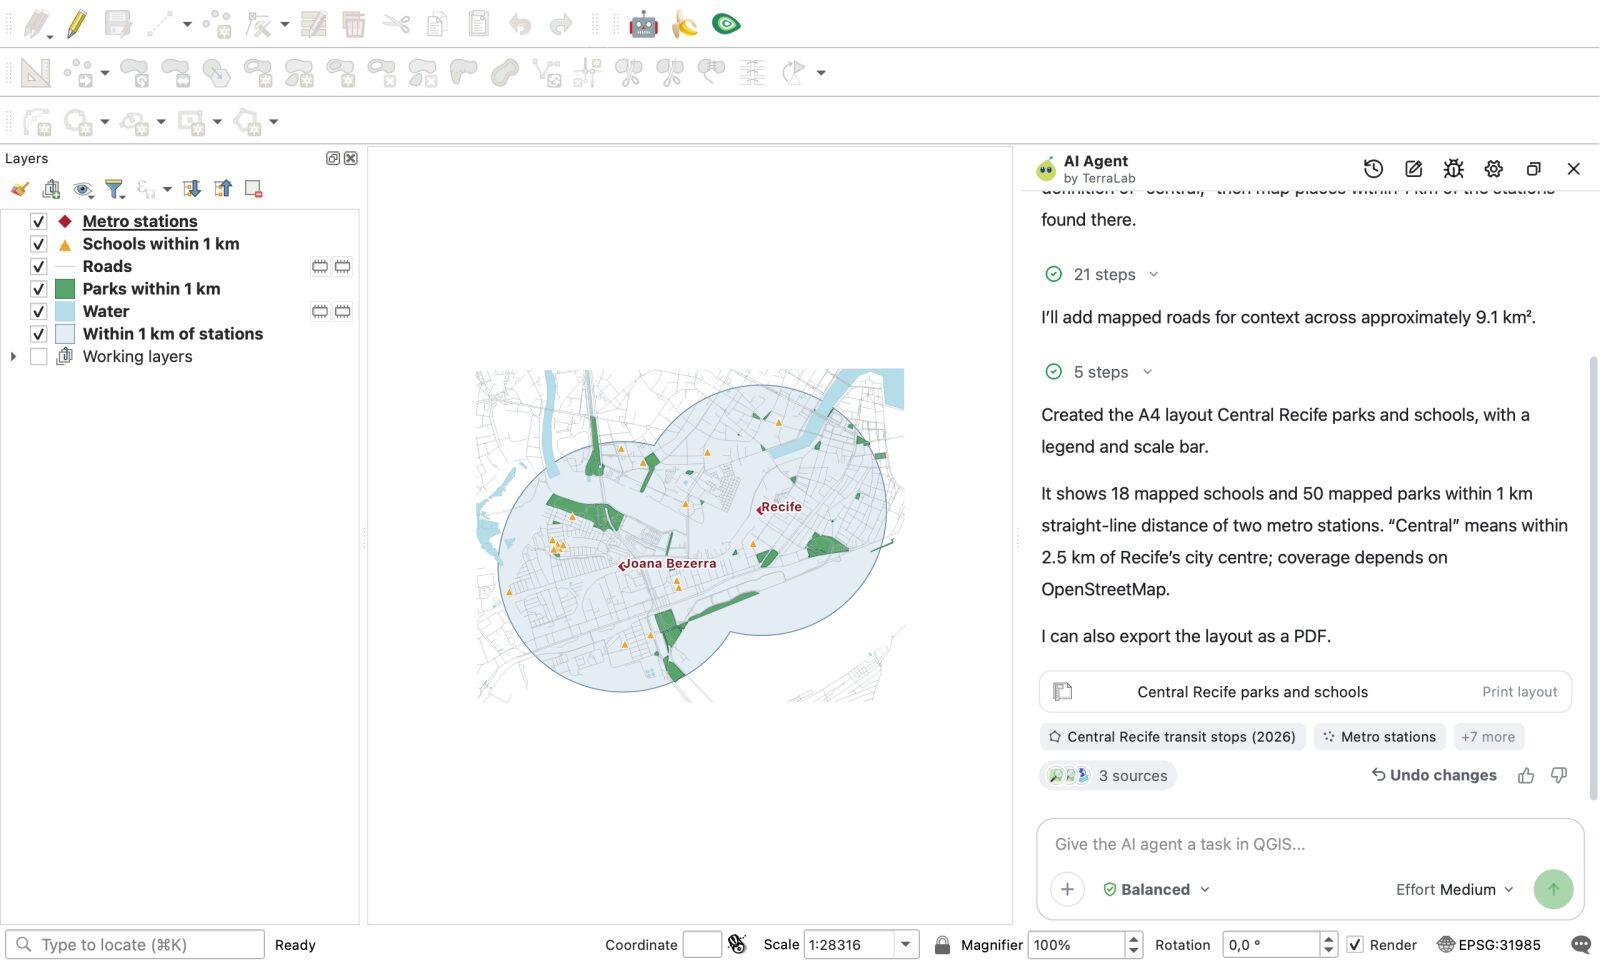
Its answer in the panel was:
Created the A4 layout Central Recife parks and schools, with a legend and scale bar. It shows 18 mapped schools and 50 mapped parks within 1 km straight-line distance of two metro stations. "Central" means within 2.5 km of Recife's city centre; coverage depends on OpenStreetMap. I can also export the layout as a PDF.
I checked its layers against my own OpenStreetMap geometry check:
- Stations: It picked Recife (
-8.06917, -34.88537) and Joana Bezerra (-8.07321, -34.89539). - Buffer: Its buffer layer in
EPSG:31985covers 5,375,557 m², within 0.02% of the analytical area of two 1,000 m circles 1,192 m apart (5,376,700 m²). - Parks and schools: 50 parks and 18 schools, matching 50 of 50 park OSM IDs and 18 of 18 school OSM IDs from the manual workflow. The farthest park vertex stands 998 m from a station and the farthest school 944 m.
- Attribution: The layout footer states
© OpenStreetMap contributors; © Overture Maps Foundation, TomTom; modified by TerraLab | ODbL 1.0 | October 2026 | SIRGAS 2000 / UTM 25S.
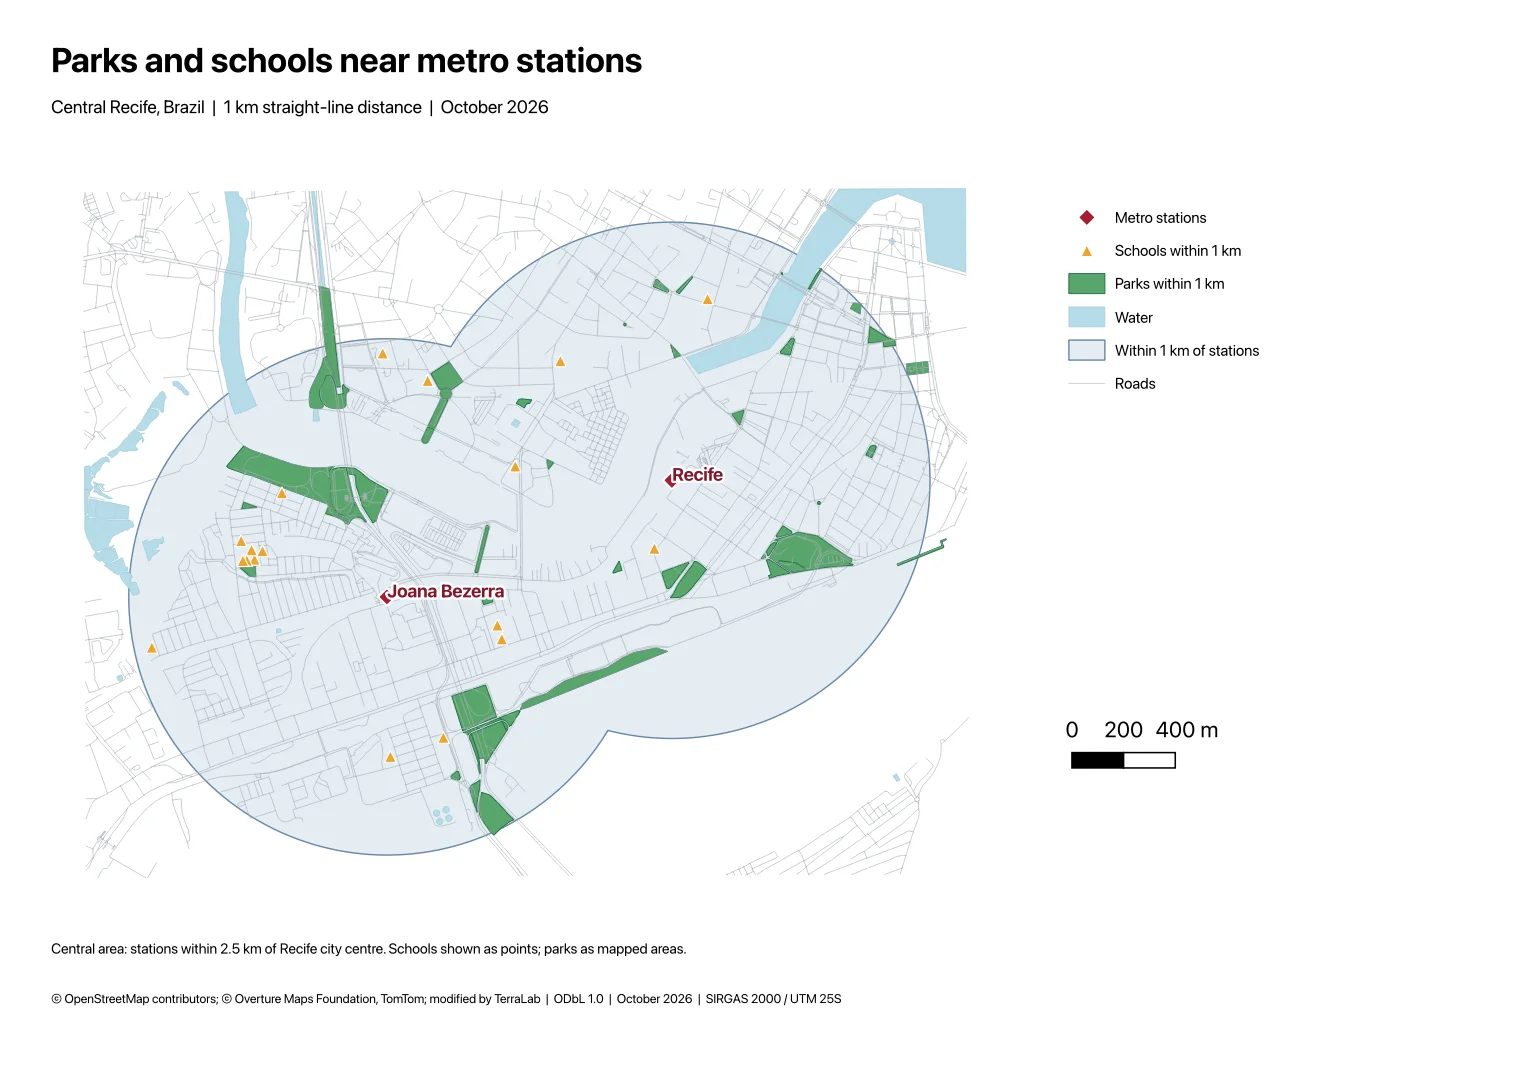
It also had real limits on this single message, and you can see them on the layout above:
- Only two stations. By defining "central" as within 2.5 km of Recife's historic centre, it left out Afogados (which is 2,475 m from the Recife station), Largo da Paz and Ipiranga. With Afogados included, the counts rise to 63 parks and 26 schools. At least it stated the 2.5 km rule in its answer and on the page, so you can ask for Afogados in a follow-up.
- No park or school name labels on the map. Only the two stations are labelled; to see a school's name you click the feature in QGIS or ask the agent to label them.
- No north arrow, and rough page balance. My prompt did not ask for a north arrow, so the agent did not add one. The "Joana Bezerra" label sits on top of its red dot, there is no raster basemap under the Overture roads and OSM water, and the right third of the A4 page is mostly white space.
- It stopped one click short of the PDF file. It built the QGIS print layout and offered to export it to PDF, so I clicked
Layout > Export as PDF…myself.
The difference from an image generator is that every piece of this map is a real QGIS layer in a metric coordinate system. Moving the legend, adding a north arrow, turning on school labels or adding Afogados station takes seconds on the same map, instead of rolling the dice on a new JPEG.
Try AI Agent free in QGIS, no card needed
When to use which tool
- Use a fantasy map generator (Recraft, Firefly, TT-RPG, OpenArt) when the place is fictional. That is what most of the "AI map generator" search results are built for, and they do it well.
- Never use an image model for a place someone will visit, cite in a report or build on. The dangerous thing about
gemini-3-pro-imageandgemini-3.1-flash-imageis not that they look bad; it is that they look finished while putting real Recife school names 3 to 4 km from where they stand. If you only have a browser chatbot, ask it to write PyQGIS code instead of drawing an image; our test of ChatGPT for QGIS shows what works and where blind scripts fail. - Use manual QGIS when you want full control over every query, symbol and layout item for zero cost, or when you are learning how spatial joins and metric projections work.
- Use a GIS agent inside QGIS when you want real OpenStreetMap or Overture layers, a true metric buffer and an editable layout in a minute and a half, and you are happy to tidy a label or add a north arrow at the end. You can see all of our QGIS tools on the QGIS AI hub.
How we measured this. Tested on 7 November 2026. The two image runs called the Gemini API (generateContent with responseModalities: ["TEXT","IMAGE"], default settings, no system prompt, n = 1 image per model) on gemini-3-pro-image and gemini-3.1-flash-image. Ground truth came from the OpenStreetMap API (/api/0.6/map, eight tiles covering lon -34.9245 to -34.8745, lat -8.0885 to -8.0585) and Nominatim lookups on the same day. The AI Agent run used QGIS 3.44.15 on macOS with AI Agent 1.9.4 at Medium effort and Balanced permissions in an empty project; the OpenStreetMap extract the agent queried was dated 19 October 2026 and the Overture Maps road extract 21 October 2026. One prompt and one city is a small sample; another city, a Portuguese prompt or repeat image runs would change the exact label counts.
Questions people ask
Can ChatGPT or Gemini make an accurate map of a real city?
Not as a generated image. When an image model draws a map, it predicts pixels rather than reading GIS coordinates. In our test on central Recife, both Gemini image models drew convincing maps in Portuguese with legends and scale bars, but 0 of the 10 named parks and schools on each image were real places located inside the 1 km metro zones they drew. For an accurate map, use a GIS such as QGIS or an agent that works on real OpenStreetMap layers.
Is there a free AI map generator for real places?
Yes, with limits. Web pin tools such as MapsGPT let you generate a few interactive pin maps an hour for free, though their own page notes the points are "an AI's best guess". For a real GIS map with polygons, a scale bar and a print layout, QGIS is completely free and open source, and AI Agent for QGIS includes a free plan of 5 tasks a month at Low effort with no bank card or API key required (Pro adds 300 tasks a month and Medium or High effort).
Can AI generate a map from my own GIS data or spreadsheet?
Image generators cannot read a Shapefile, GeoPackage or CSV of coordinates. A GIS agent inside QGIS can: you open your existing project or drop a CSV, GeoPackage, Shapefile or GeoJSON into the AI Agent chat panel, and ask it to buffer, join, style or build a print layout from your layers alongside OpenStreetMap or Overture Maps data.
Why are most 'AI map generator' search results for fantasy or D&D maps?
Because text-to-image models are very good at inventing coastlines, parchment textures and dungeon rooms where no ground truth exists. When we checked the top 9 Google results for "ai map generator" in November 2026, 6 were fantasy or tabletop battle-map tools. If you need a map of a real place, look for a GIS tool or a QGIS plugin rather than an image generator.
Do it in QGIS by asking for it
AI Agent carries out the task you describe, in your own QGIS project. Free, no card.