What Is GIS? Geographic Information Systems Explained Simply
Published
A geographic information system (GIS) is a computer system that captures, stores, analyzes and displays data tied to locations on Earth, stacking datasets as layers that share coordinates. Every GIS combines two data models (vector features and raster grids) across five core components: hardware, software, data, people and methods.
The U.S. Geological Survey (USGS) defines it in two sentences: "A Geographic Information System (GIS) is a computer system that analyzes and displays geographically referenced information. It uses data that is attached to a unique location." In daily work, the abbreviation GIS stands for the software and data system itself, while universities also use it for geographic information science, the academic discipline behind spatial analysis.
How a GIS stacks layers of the real world
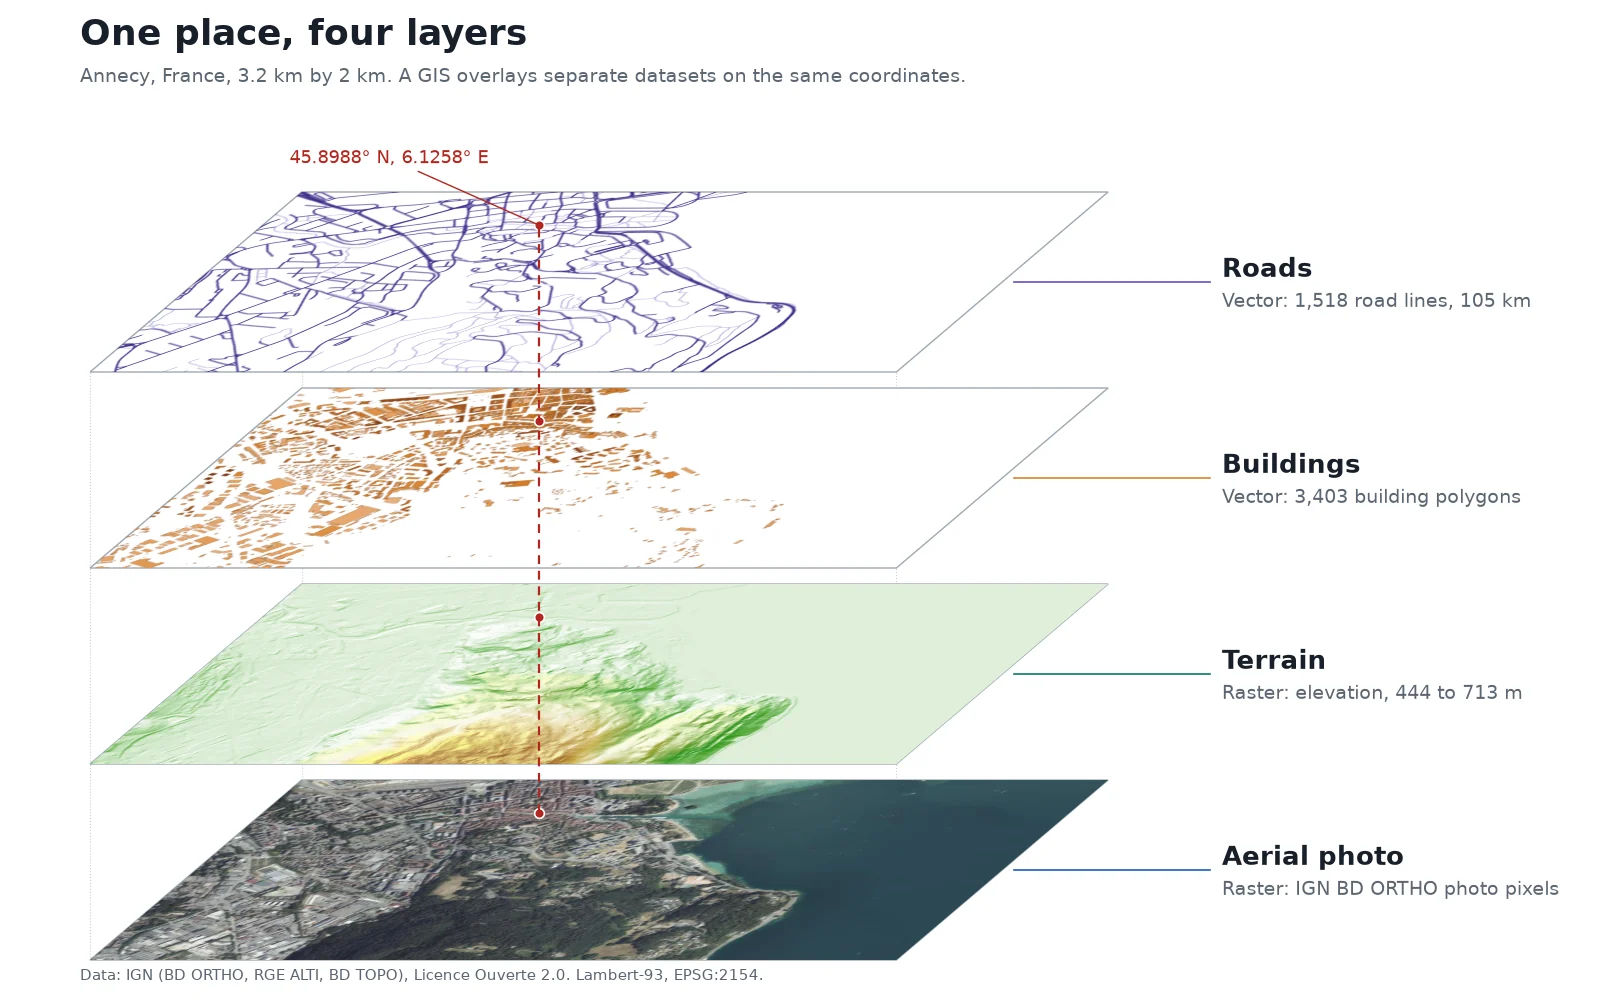
A paper map flattens everything onto one sheet. A GIS separates the world into thematic layers and aligns them by their coordinates.
To show how layers connect, we pulled four public datasets from the French national mapping agency (IGN) over a 3.2 km by 2 km box in Annecy, France, projected in Lambert-93 (EPSG:2154):
- Aerial imagery (raster): An IGN BD ORTHO photograph with 20 cm (8 in) pixels showing roofs, trees and water.
- Terrain elevation (raster): An IGN RGE ALTI model built mostly from airborne LiDAR. Heights in this box run from 444 m (1,457 ft) along the shore of Lake Annecy up to 713 m (2,339 ft) on the wooded Crêt du Maure hill.
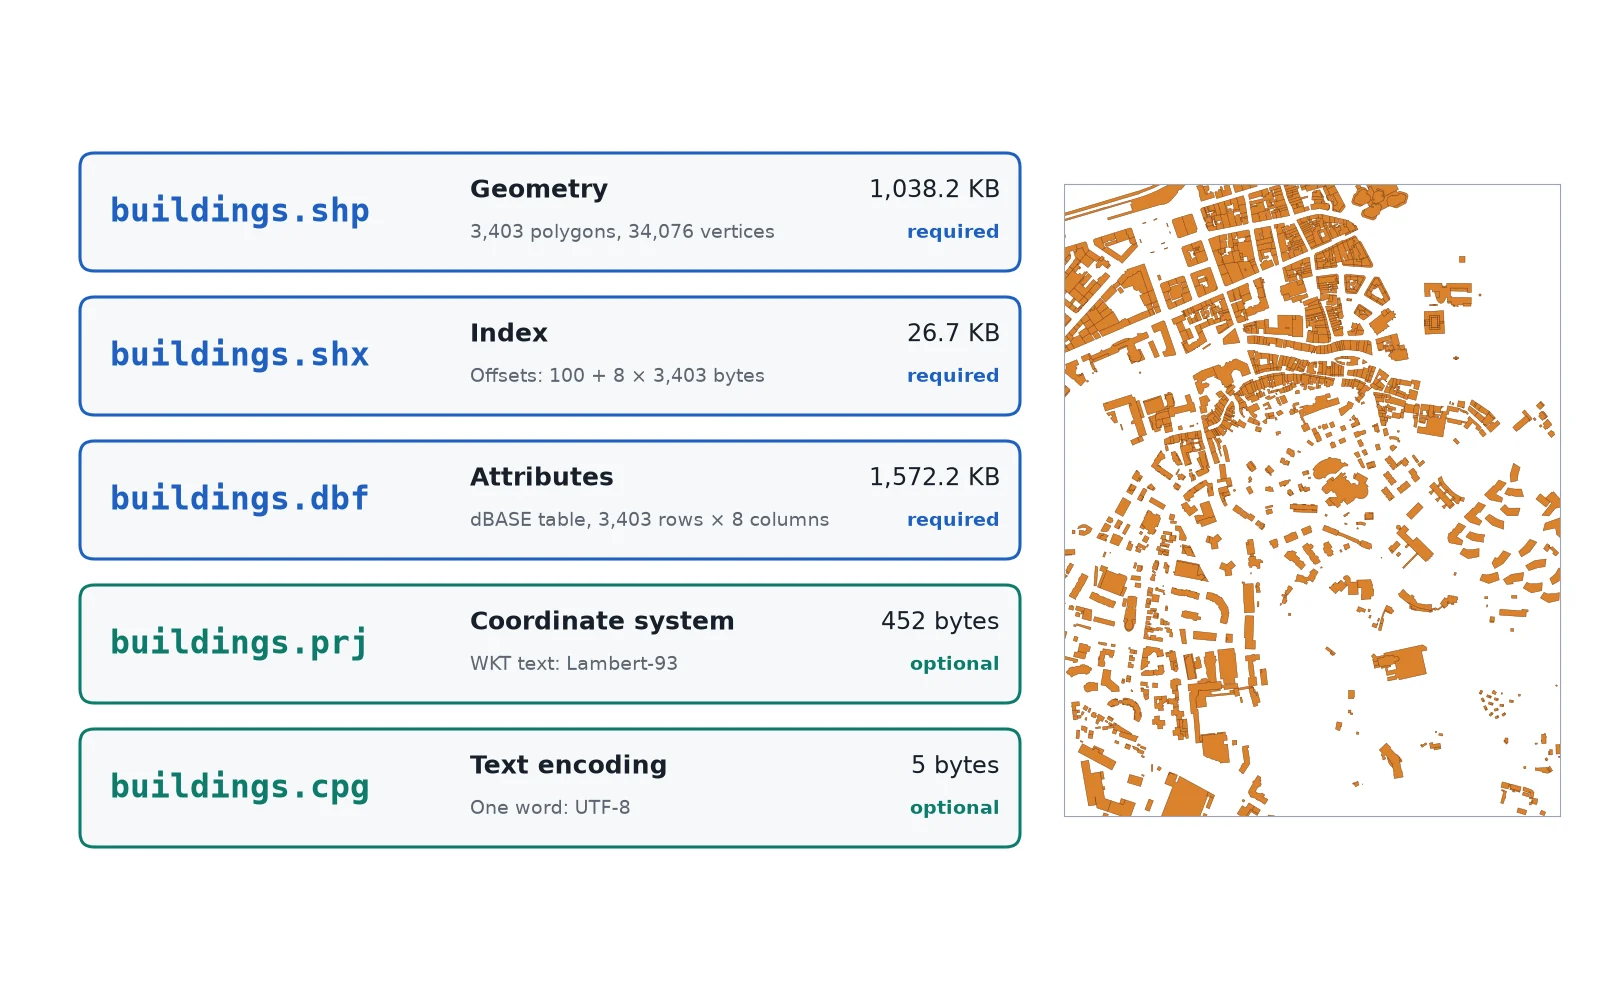
- Buildings (vector): 3,403 building polygons from IGN BD TOPO, each storing attributes such as height and use.
- Roads (vector): 1,518 road segments from IGN BD TOPO, measuring 105 km (65 mi) in total.
In the figure above, a red dashed line drops through a single coordinate: 45.8988° N, 6.1258° E. That pin hits the same ground spot in every layer. Because the layers share a coordinate reference system (CRS), the software can ask questions that cross from one dataset to another: which of the 3,403 buildings sit on slopes above 600 m (1,969 ft), or which road segments run within 50 m (164 ft) of the lake shore.
Vector vs raster: the two GIS data models
Every layer in a GIS uses one of two data models to represent the ground: vector or raster.
| Feature | Vector data | Raster data |
|---|---|---|
| Structure | Points, lines and polygons defined by x, y coordinates | A uniform grid of cells (pixels), each holding one number |
| Best for | Discrete objects with sharp boundaries | Continuous surfaces and photographs |
| Real examples | Fire hydrants (points), roads (lines), buildings (polygons) | Aerial photos, elevation models, surface temperature |
| Typical cell or scale size | Exact coordinates; scale depends on survey accuracy | 20 cm (8 in) aerial photos to 10 m, 20 m, 30 m or 60 m satellite bands |
| Common file formats | Shapefile, GeoJSON, GeoPackage, KML | GeoTIFF |
Each vector feature links its geometry to a row in an attribute table. In the Annecy buildings layer, clicking one polygon reads its row: an identifier, a usage label and a height in metres. That connection lets you filter a map two ways at once, by attribute ("buildings taller than 20 m") and by location ("buildings within 200 m of the canal").
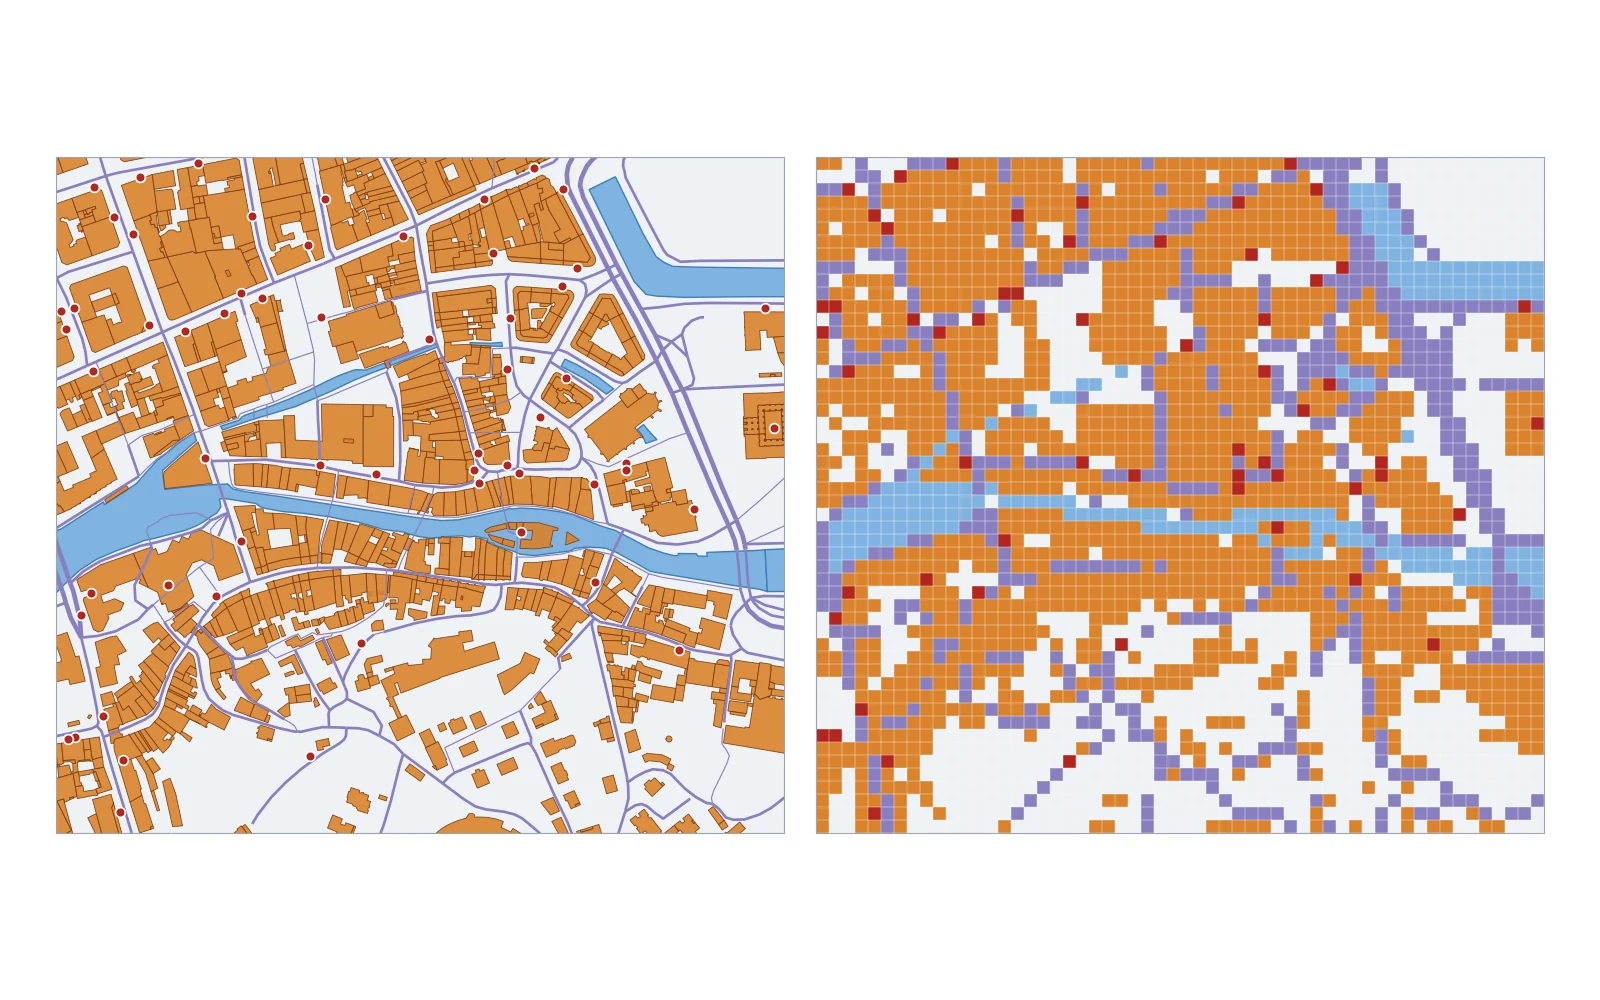
Rasters have no attribute table of objects. Instead, cell resolution sets what you can measure: an IGN aerial photo captures details down to 20 cm, European Space Agency Sentinel-2 satellite bands record light in 10 m, 20 m and 60 m cells, and NASA Landsat 8 collects 30 m multispectral cells alongside a 15 m panchromatic band. For a full breakdown of when to pick each model, see our guide on vector vs raster data, and check the GIS file formats guide to see how formats like GeoPackage and GeoTIFF store them on disk. If you just want to inspect a file right now, you can drop a GeoJSON, Shapefile or KML into our free GIS tools in the browser without installing software.
The five components of a GIS
A GIS is more than the mapping program on a screen. Esri breaks an operational system down into five components:
- Data: The geographic layers and attribute tables. Esri calls data "possibly the most important component" of a GIS, because an analysis is only as accurate as the surveys, satellite images and tables feeding it.
- Software: The tools that read spatial files, reproject coordinates, run spatial queries and draw maps, such as QGIS, ArcGIS Pro or a spatial database like PostGIS.
- Hardware: The computer, workstation or cloud server running the calculations, along with field GPS receivers, drones and scanners used to capture positions.
- People: The analysts, planners, engineers and field crews who design the database, choose the right projection and interpret the output.
- Methods: The repeatable workflows, data standards and quality rules an organization follows so two analysts get the same answer from the same layers.
 , ArcGIS Pro or a spatial database like PostGIS.
How a GIS works in four steps
Whether a project tracks city water pipes or rare mountain plants, a GIS workflow moves through four stages:
Capture
Bring real-world locations into digital form. Data arrives from GPS field surveys, aerial and satellite sensors, LiDAR scans, digitized paper maps or open government portals.
Store
Save the layers in standard files (such as a GeoPackage or GeoTIFF) or inside a spatial database like PostGIS, with a defined CRS so every dataset aligns on the globe.
Analyze
Run spatial operations across layers. Common tools measure distances, draw buffer zones around rivers or roads, overlay polygons to find intersections, and extract slope or elevation statistics from terrain grids.
Display
Turn the results into styled paper or PDF maps, interactive web maps, 3D views or summary tables that answer the original question.
The USGS illustrates the analysis step with two field cases. First, suppose biologists spot a rare plant in three isolated sites. By stacking layers in a GIS, they find all three sites sit on north-facing slopes above 1,000 feet (about 300 m) that receive more than 10 inches (250 mm) of rain a year. The GIS then highlights every other slope in the region matching all three criteria, telling field crews exactly where to search next. In a second USGS case, combining farm boundaries, stream networks, elevation and rainfall reveals which creeks are most likely to carry fertilizer runoff downstream after a storm.
What is GIS used for?
As a USGS publication pointed out as early as the 1990s, people interact with GIS daily through property taxes, package delivery, political redistricting and utility management. Across industries, six uses come up constantly:
- City planning and zoning: Planners overlay parcel boundaries, zoning rules, transit lines and population tables to check building permits and plan school districts.
- Flood and hazard mapping: Engineers combine LiDAR elevation models with river gauge history to map which homes sit inside a floodplain.
- Utilities and infrastructure: Water, power and telecom companies track thousands of kilometres of underground pipes and cables, logging maintenance dates and valve locations on a shared map.
- Agriculture and forestry: Agronomists read multispectral satellite rasters to spot water stress across crop fields, while foresters track timber volume and wildlife habitats.
- Emergency response and logistics: Dispatchers and delivery networks calculate the fastest route along a road vector network, accounting for speed limits, one-way streets and bridge weight limits.
- Public health: Epidemiologists map disease cases against water sources, air quality and clinics to find the source of an outbreak.
Who invented GIS? A short history
Spatial analysis on paper predates the computer by more than a century. In 1854, physician John Snow plotted cholera deaths on a street map of Soho, London, and showed that the cases clustered around a single public water pump on Broad Street.
Computerized GIS began in Canada in the early 1960s. The federal government's Canada Land Inventory planned to produce about 1,500 maps at scales of 1:50,000 and 1:250,000 to classify productive land and wildlife habitat across the country. In 1962, geographer Roger Tomlinson, then working for Spartan Air Services in Ottawa, proposed using computers to store and measure those maps instead of drafting and measuring them by hand.
Tomlinson delivered his technical feasibility report in August 1963, and his team built the Canada Geographic Information System (CGIS) between 1963 and 1968, an achievement recognized as an IEEE Milestone in 2023. Tomlinson's 1968 paper, A Geographic Information System for Regional Planning, is the first known published use of the term "geographic information system", and he is often called the "father of GIS".
Common GIS software compared
No single program fits every spatial task. Desktop GIS suites handle map layout and heavy analysis, spatial databases store millions of rows for teams, and lightweight viewers open files for quick checks.
| Software | License | Operating systems | Primary role |
|---|---|---|---|
| QGIS | Free and open source (GNU GPL v2 or later) | Windows, macOS, Linux | Full desktop GIS for viewing, editing, analysis and map design |
| ArcGIS Pro | Commercial (paid license) | Windows | Esri's desktop GIS for editing, analysis and publishing to ArcGIS Online |
| GRASS GIS | Free and open source (GNU GPL) | Windows, macOS, Linux | Raster, terrain and hydrological modeling engine |
| PostGIS | Free and open source | Windows, macOS, Linux | Spatial extension that turns PostgreSQL into a geographic database |
| Google Earth Pro | Free | Windows, macOS, Linux | 3D globe viewer for KML files and historical aerial imagery |
QGIS began in May 2002 and is maintained under the Open Source Geospatial Foundation (OSGeo). GRASS GIS is older still: development started in 1982 at the U.S. Army Corps of Engineers' Construction Engineering Research Laboratory (CERL) before its release under the GNU GPL in 1999. If you want to try a desktop GIS without paying for a license, start with our overview of what QGIS is.
How AI is changing GIS software
Traditionally, answering a spatial question meant knowing which menu hid the buffer tool, which EPSG code fit your country and how to write a filter expression. Today, AI in GIS has split into two practical tools: computer vision models that trace buildings, trees or roads directly from aerial rasters, and conversational assistants that run desktop GIS workflows from plain-language prompts.
We build AI Agent, a plugin for QGIS that works this way. Instead of clicking through processing dialogs, you describe the map or analysis you want in a sentence, and the agent loads the open data, runs the QGIS processing tools and styles the layers in your project.
GIS vs GPS vs a static map
People new to mapping often mix up GIS with GPS or with standard graphic maps. Each does a different job:
- GIS vs GPS: The Global Positioning System (GPS) is a network of satellites and receivers that calculates the latitude, longitude and elevation of a device on the ground. GPS is one way to capture location data; a GIS is the computer system where you import those GPS tracks alongside roads, parcels and aerial photos to analyze them.
- GIS vs a static map: A paper map or a PDF map is a fixed picture. A GIS holds the underlying database behind the picture. In a GIS, you can turn layers on and off, change the coordinate projection, filter buildings by height, or recalculate flood risk when new rainfall numbers arrive.
Questions people ask
GIS stands for geographic information system, a computer system that captures, stores, analyzes and maps data linked to locations on Earth. In universities and research, the same letters also stand for geographic information science, the academic study of spatial data and methods.
A GIS works in four steps. It captures location data from GPS, imagery or surveys, and stores it as vector features or raster grids in a shared coordinate reference system. It then analyzes how the layers relate in space and displays the results as maps or tables. Because every layer shares coordinates, the software can overlay roads, buildings and terrain to answer questions across all of them at once.
Organizations use GIS whenever a decision depends on where things are located. Common uses include city zoning, flood risk mapping, managing water and power lines, monitoring crop health from satellite imagery, routing emergency vehicles and tracking disease outbreaks in public health.
Five widely used GIS tools that cover the main spatial jobs are QGIS (a free, open-source desktop GIS for Windows, macOS and Linux), Esri ArcGIS Pro (a commercial desktop GIS for Windows), GRASS GIS (an open-source analysis engine started in 1982), PostGIS (a spatial database extension for PostgreSQL) and Google Earth Pro (a free 3D viewer for KML files). Each covers a different job, so many teams use more than one.
Daily GIS work does not require advanced math by hand because the software calculates map projections, areas, buffers and distances automatically. You do need a clear grasp of coordinate units, map scale, percentages and basic summary statistics such as averages and medians. Advanced math only comes in if you specialize in geostatistics, remote sensing physics or geodesy.
GPS (Global Positioning System) is a satellite navigation system that tells a receiver its coordinate position on Earth. A GIS (geographic information system) is the software and database system used to store, combine and analyze location data from many sources, including points and tracks recorded by a GPS receiver.
Yes, QGIS is free and open-source software released under the GNU General Public License (GPL v2 or later). It runs on Windows, macOS and Linux with no license fee, and has been developed as a community project since May 2002 under the Open Source Geospatial Foundation (OSGeo).
Do it in QGIS by asking for it
AI Agent carries out the task you describe, in your own QGIS project. Free, no card.