Vector vs Raster Data in GIS: Differences, Formats, When to Use
Published
Vector data stores geographic features as points, lines and polygons built from exact coordinate pairs, while raster data stores the world as a grid of equally sized cells where each cell holds one value. A vector road or building keeps sharp edges at any zoom, whereas a raster's detail stops at its cell size, from 20 cm (8 in) in aerial photos to 10 m (33 ft) or 30 m (98 ft) in free satellite imagery.
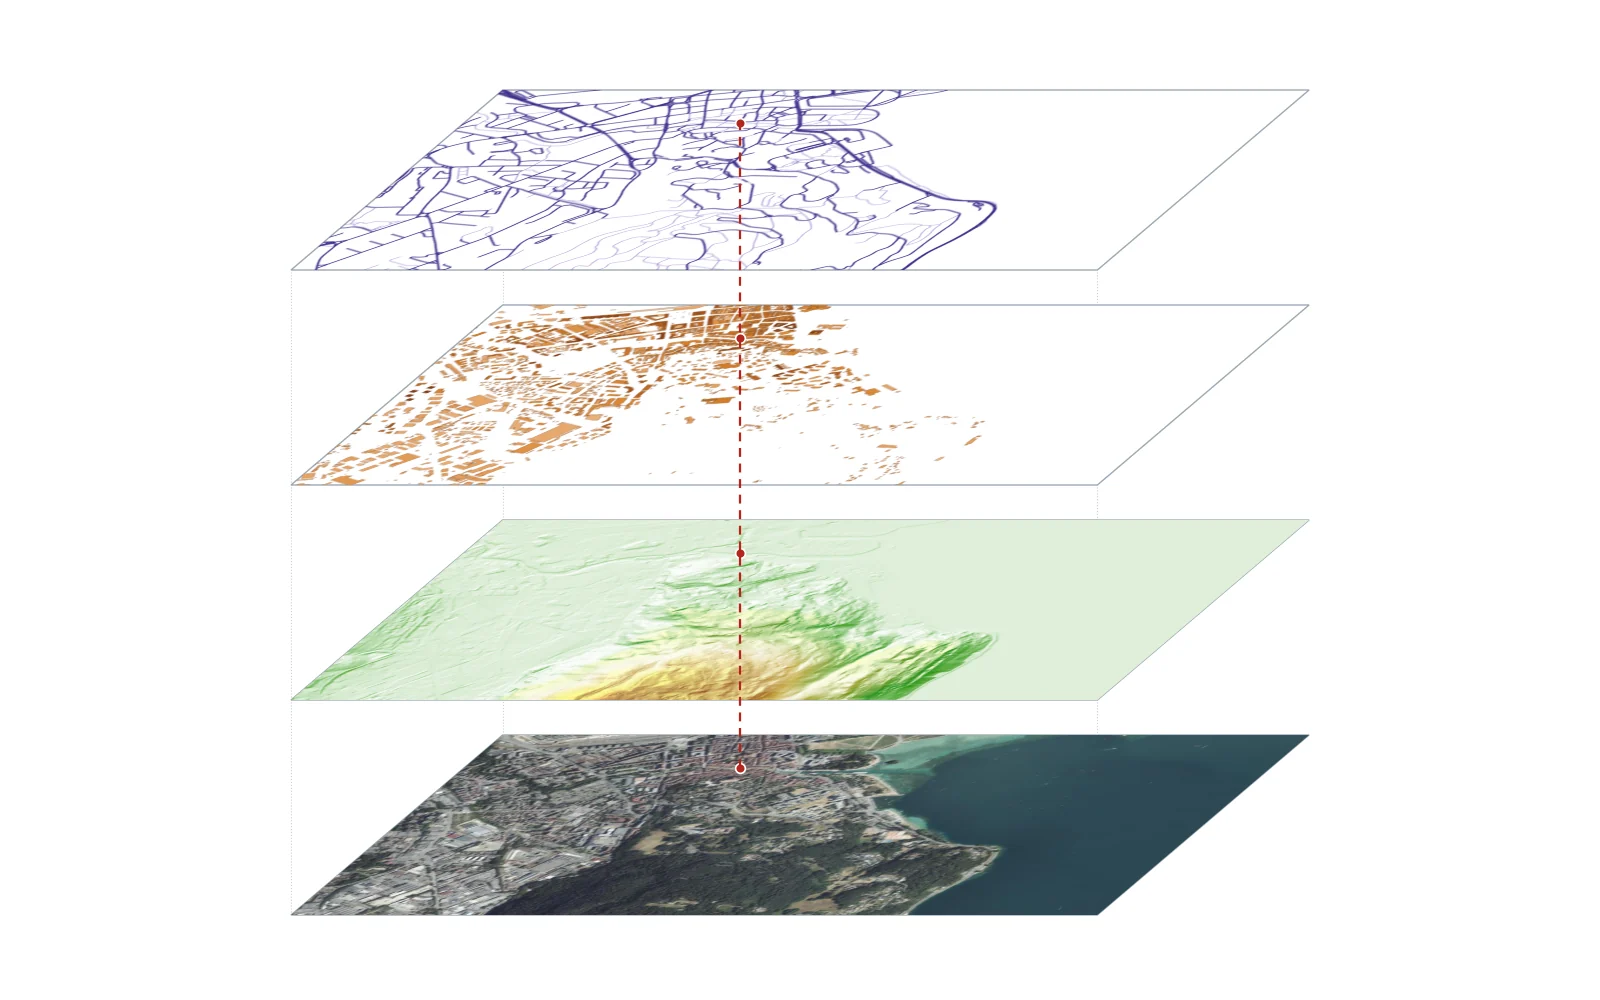
Think of vector data as a surveyor's notebook of coordinates connected by straight segments, and raster data as a tiled mosaic laid over the ground. Both are core to what GIS is, and many projects in QGIS combine them: a raster aerial photo or elevation model sits at the bottom, and vector parcels, roads and buildings sit on top.
 combine them: a raster aerial photo or elevation model sits at the bottom, and vector parcels, roads and buildings sit on top.
3geometries
in vector data
points, lines and polygons
20 cm to 60 mcell size
typical open raster resolution
IGN aerial photos to Sentinel-2 bands
4×more cells
each time you halve the cell size
file size grows with the square of resolution
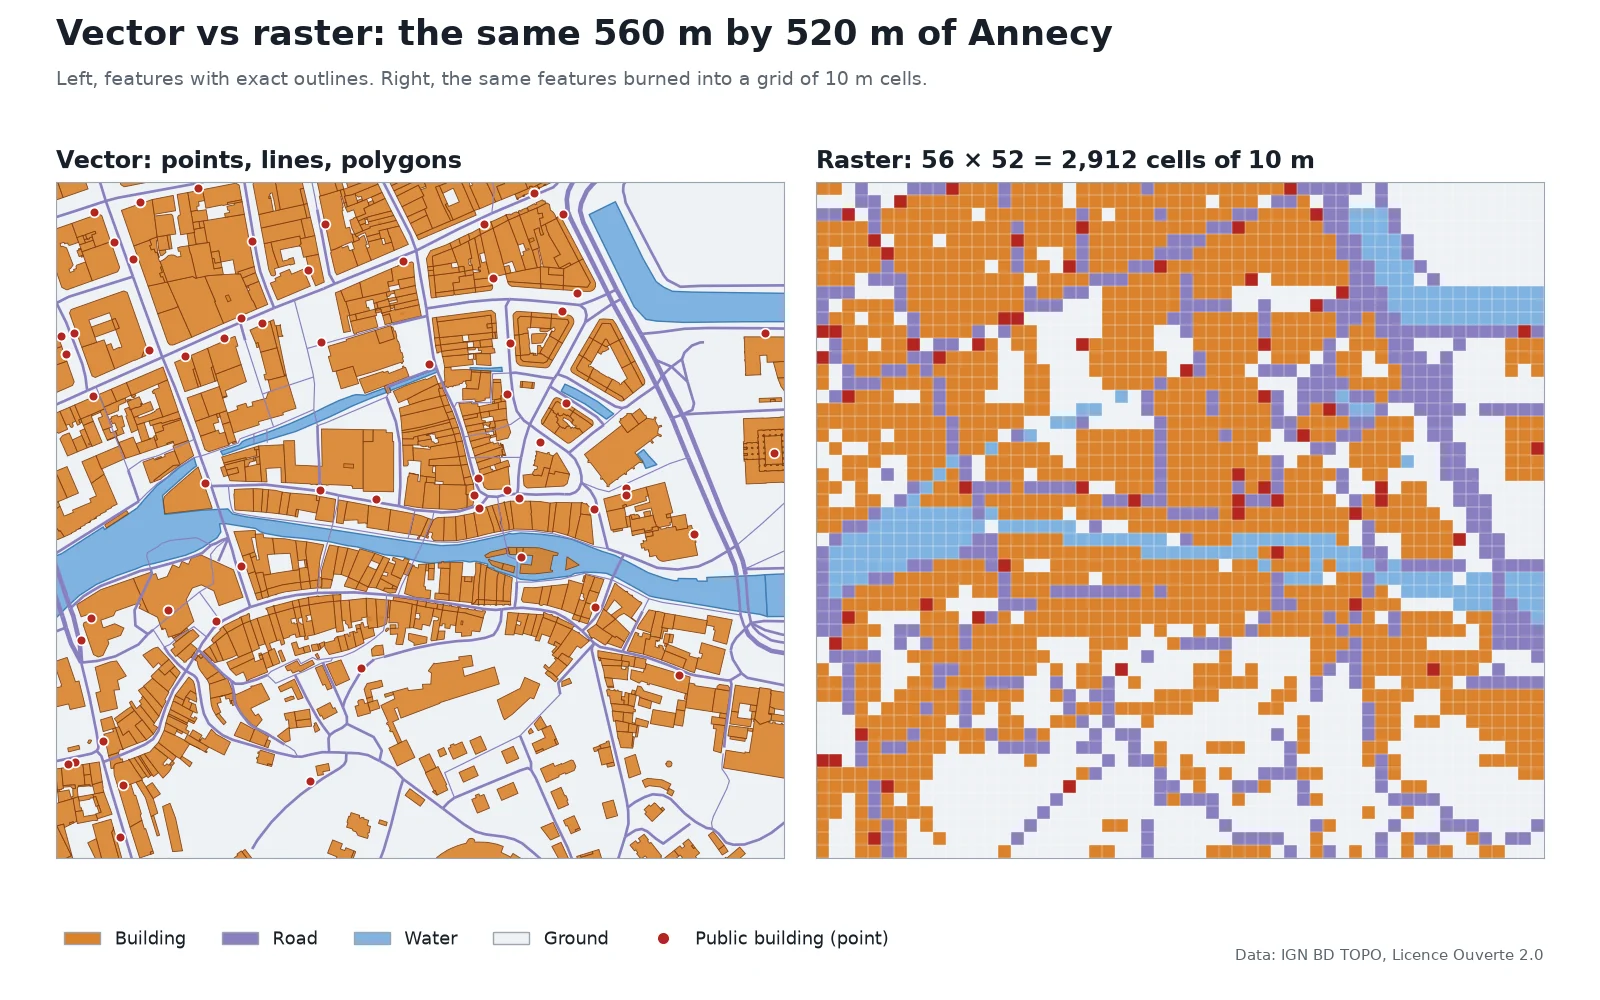
To make the figure above, I took a 560 m by 520 m (1,837 ft by 1,706 ft) window of Annecy's old town from IGN's BD TOPO on 16 November 2026. The vector side draws 853 building polygons, 254 road lines and 72 public-building points with their true outlines. The raster side burns those same features into a grid of 56 by 52 cells (2,912 cells in total) at 10 m resolution. I built a 1 m class grid of water, road and building, assigned each 10 m cell the class that covers most of it, and filled one cell for each point. In the resulting grid, 43.8% of cells are building, 16.9% road, 6.4% water, 2.0% public-building points and 30.9% bare ground. Notice how the narrow streets and the Thiou canal break into stair-step blocks or vanish where roads and bridges cover more of the cell, and how a single point turns into a 10 m square because the raster cannot record where inside the cell the point stood.
Vector vs raster at a glance
| Property | Vector data | Raster data |
|---|---|---|
| Basic unit | Points, lines and polygons made of coordinate pairs (vertices) | A matrix of equal cells (pixels) in rows and columns |
| Attributes | A table row per feature, holding dozens of text or number fields | One numeric value per cell per band |
| Precision at zoom | Edges stay sharp at any scale | Detail stops at the cell size; zooming in shows square pixels |
| Best for | Discrete objects with clear boundaries: buildings, roads, parcels, borders | Continuous surfaces and imagery: elevation, temperature, rainfall, satellite photos |
| File size depends on | Number of features and vertices | Rows × columns × bytes per cell (independent of how busy the map is) |
| Common formats | Shapefile (.shp), GeoPackage (.gpkg), GeoJSON (.geojson), KML, PostGIS | GeoTIFF (.tif), Cloud Optimized GeoTIFF, JPEG 2000 (.jp2), NetCDF (.nc), ASCII grid (.asc) |
| Typical analysis | Network routing, spatial joins, buffers, parcel area and perimeter | Map algebra, slope and viewshed, NDVI, land-cover classification |
What is vector data in GIS?
Vector data represents geographic features using three geometry types built from (x, y) coordinate pairs (and sometimes z for height):
- Points. A single coordinate pair marking a location too small to draw as an area at your scale, such as a water well, a tree, a bus stop or an address point.
- Lines (polylines). An ordered list of vertices connected by segments. Lines represent linear networks and waterways: roads, railways, rivers, pipelines and contour lines.
- Polygons. A closed ring of vertices where the first and last coordinates match, enclosing an area. Buildings, land parcels, lakes and administrative boundaries are polygons.
Every vector feature is linked to one row in an attribute table. A single building polygon can carry its street address, construction year, roof material, floor count and tax identifier in that row. If you want to test real vector polygons in your own software, pull an area from our free building footprints downloader, which exports open building outlines as vector files.
Vector files stay compact when features are sparse: a file of a few hundred points stores only those points, while a raster of the same area must store a value for every cell, including all the empty ones.
What is raster data in GIS?
Raster data divides an area into a regular grid of equally sized rectangular (almost always square) cells arranged in rows and columns. As Esri's ArcGIS documentation puts it, a raster is a matrix of cells organized into rows and columns where each cell contains a value representing information. That value can be a terrain height in metres, a surface temperature, a land-cover class code, or a light reflectance number from a camera sensor.
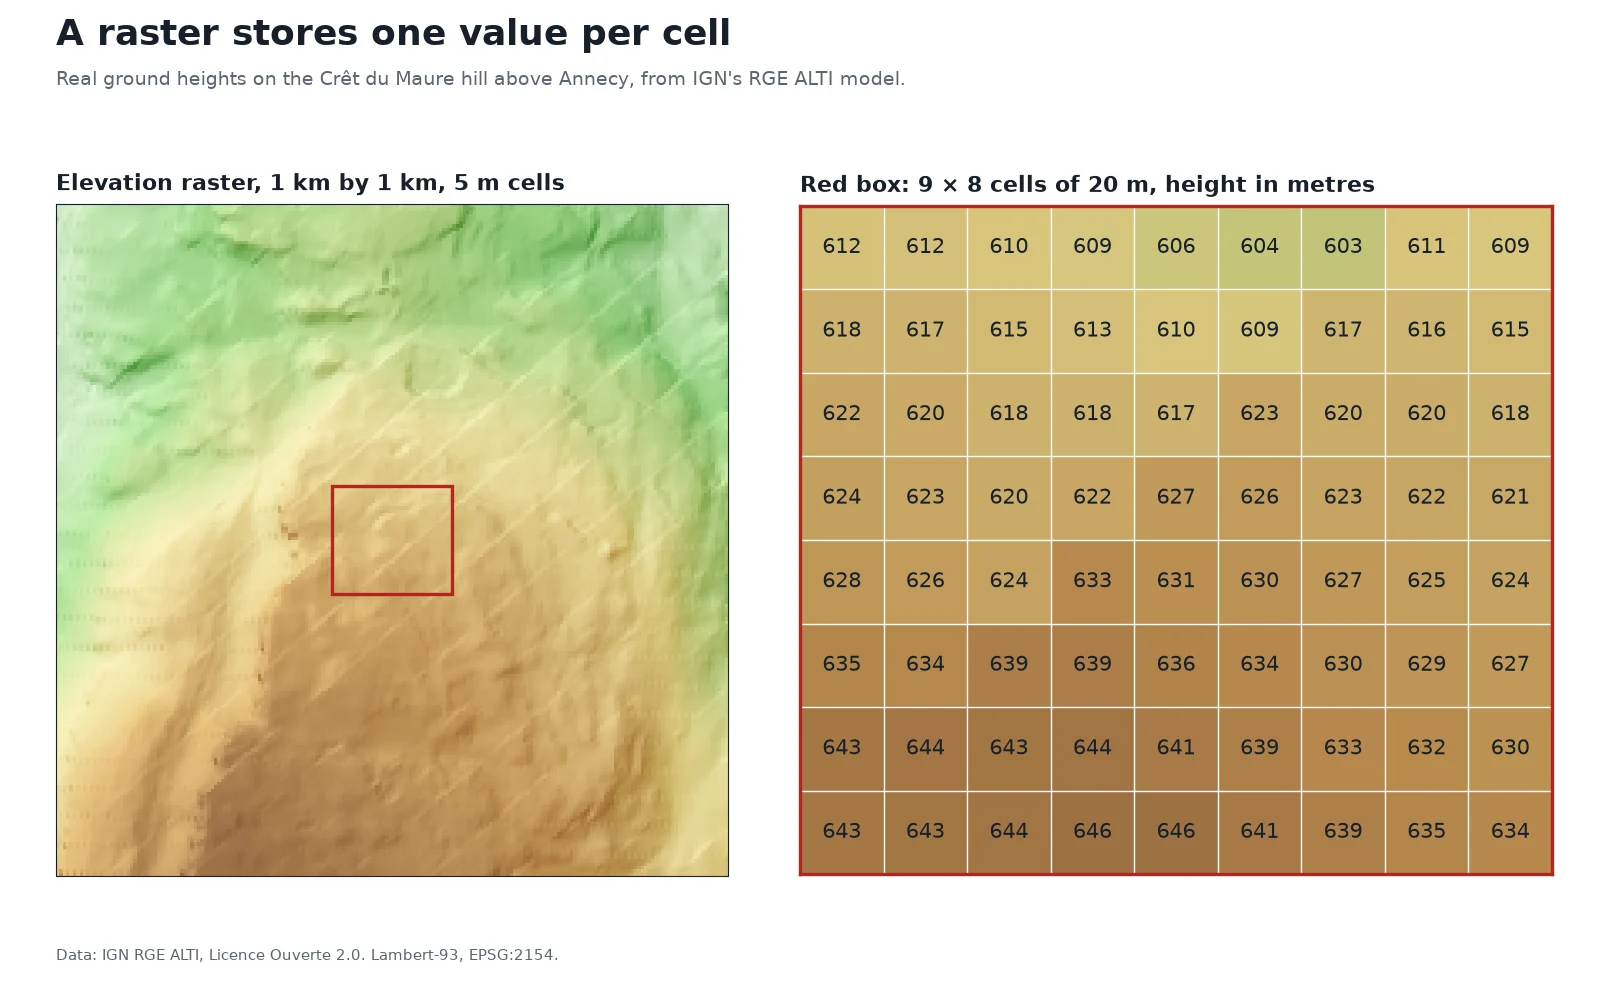
A raster does not store "hills" or "valleys" as objects. As the close-up from IGN's RGE ALTI model shows, each 20 m cell holds one number between 603 m and 646 m. GIS tools compute slope, aspect and hillshading on the fly by comparing each cell's number to its eight neighbours.
Single-band rasters hold one layer of numbers, such as elevation or rainfall. Multi-band rasters stack several grids over the same cells: a color aerial photo has three bands (red, green and blue), and some add a near-infrared band. The European Space Agency's Sentinel-2 satellites record 13 spectral bands per scene.
Cell size, resolution and file size
The ground length of one cell side is the raster's spatial resolution. A cell is the smallest thing a raster can distinguish: anything smaller than a cell gets averaged into the cell's single number or missed altogether.
| Source | Cell size (resolution) | What one cell covers on the ground |
|---|---|---|
| IGN BD ORTHO aerial photos (France) | 20 cm (8 in) | 0.04 m² |
| Sentinel-2 visible and near-infrared (4 bands) | 10 m (33 ft) | 100 m² |
| Sentinel-2 red-edge and SWIR (6 bands) | 20 m (66 ft) | 400 m² |
| Landsat 8 panchromatic band | 15 m (49 ft) | 225 m² |
| Landsat 8 multispectral bands | 30 m (98 ft) | 900 m² |
| Sentinel-2 atmospheric bands (3 bands) | 60 m (197 ft) | 3,600 m² |
Because a grid is two-dimensional, halving the cell size multiplies the number of cells by four. Moving from 10 m cells to 1 m cells multiplies the cell count by 100.
Uncompressed raster size is a direct multiplication: rows × columns × bytes per cell × bands. I tested this on 16 November 2026 with a 640 by 400 elevation raster stored as 32-bit floating-point numbers (4 bytes per cell):
- Raw cell values:
640 × 400 × 4= 1,024,000 bytes. - Written by GDAL as an uncompressed GeoTIFF (with header and CRS tags): 1,025,166 bytes.
- Written with lossless
DEFLATEcompression and floating-point predictor (PREDICTOR=3): 428,433 bytes, or 42% of the uncompressed size.
When to use vector vs raster
Choose between the two models by asking whether your phenomenon has hard boundaries or changes continuously across space.
Use vector data when:
- You are mapping discrete objects with legal or physical edges: property parcels, buildings, utility pipes, road centrelines, protected areas.
- You need to attach a rich attribute table (names, dates, owners, capacities) to each feature.
- You need network topology, such as finding the shortest driving route along roads or tracing upstream flow in a pipe network.
- You print or display maps at many scales and need crisp lines and labels at every zoom level.
Use raster data when:
- The value exists everywhere and changes smoothly: ground elevation, air temperature, soil moisture, noise levels or satellite reflectance.
- Your data comes straight from a camera or scanner: satellite scenes, drone orthomosaics, aerial photography or scanned paper maps.
- You want to run fast cell-by-cell math (map algebra) across several layers, such as subtracting two elevation grids to measure quarry volume or combining red and near-infrared bands for vegetation health.
- You are running terrain or surface models: slope, aspect, watershed delineation, flood fill or viewshed analysis.
Both models can cross over when needed. Rasters often store discrete classes, such as a national land-cover grid where 1 means forest, 2 means water and 3 means urban. And vectors can represent continuous surfaces through contour lines or Triangulated Irregular Networks (TINs).
Common vector and raster file formats
If you are not sure whether a file on your disk is vector or raster, check its extension. Our full GIS file formats guide covers the technical limits of each, and here is how they split:
| Format | Extension | Type | Notes |
|---|---|---|---|
| GeoPackage | .gpkg | Both | Modern OGC standard based on SQLite; one file can hold vector tables and raster tiles |
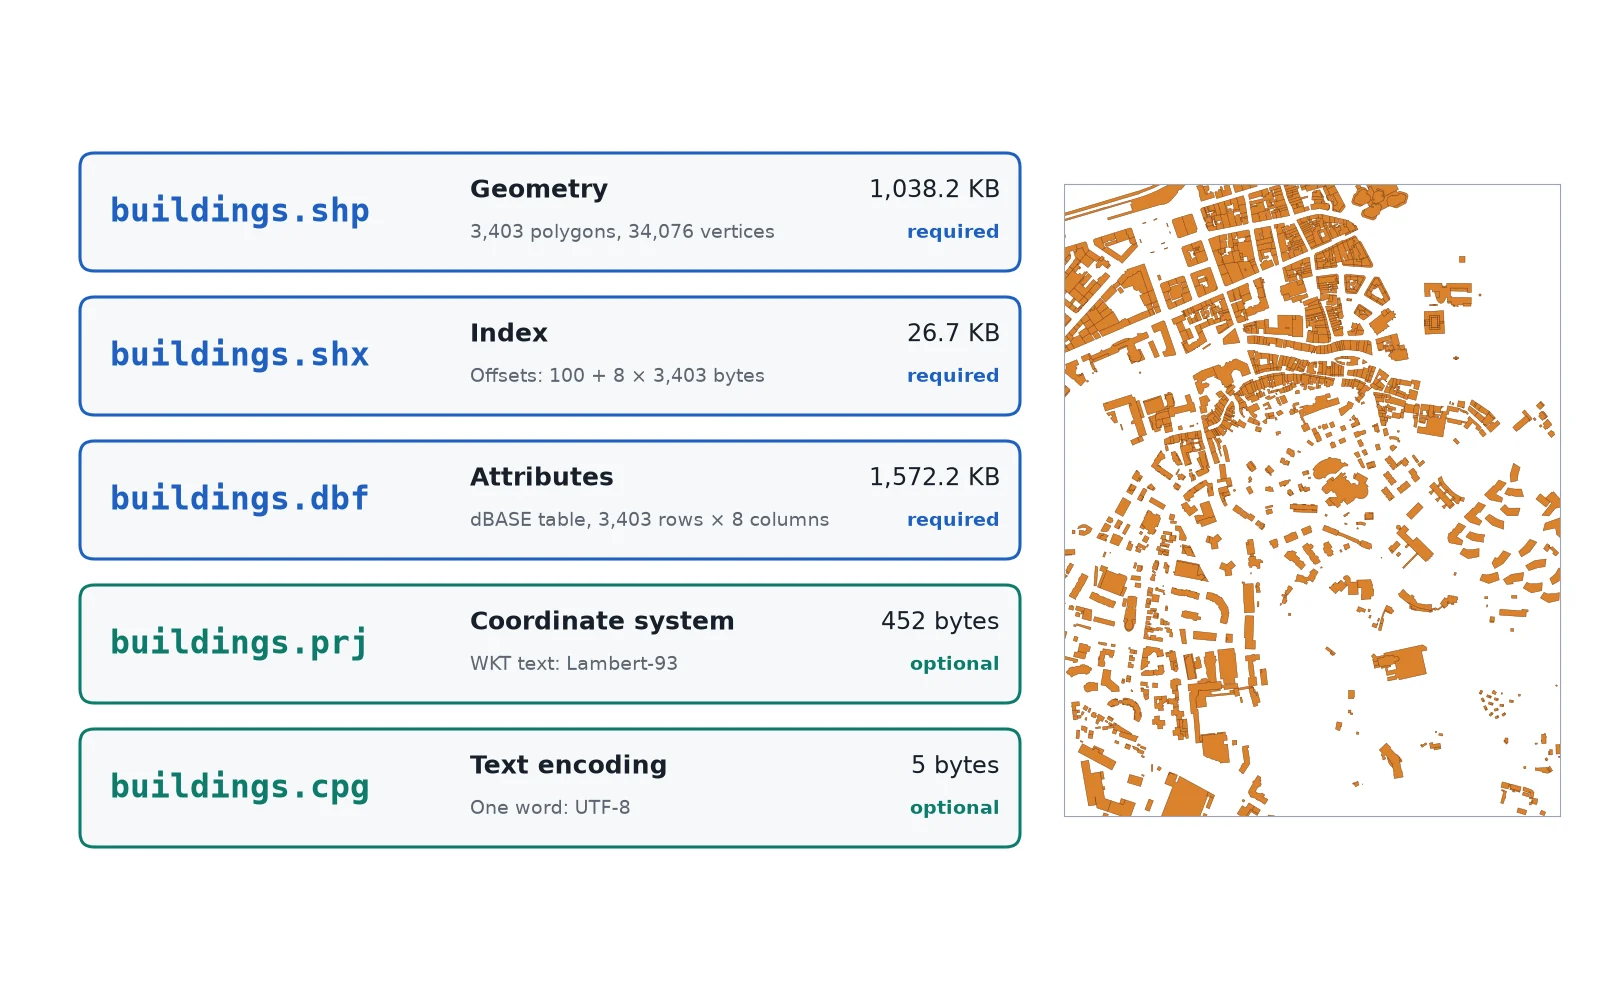
| Shapefile | .shp (+ .shx, .dbf, .prj) | Vector | Legacy Esri format; 10-character field names, 2 GB limit per component file |
| GeoJSON | .geojson, .json | Vector | Text-based web format; stores coordinates and attributes in plain JSON |
| KML / KMZ | .kml, .kmz | Vector (mostly) | XML format used by Google Earth; can also wrap raster ground overlays |
| CSV with coordinates | .csv | Vector (points) | Tabular text with latitude/longitude or easting/northing columns |
| GeoTIFF / COG | .tif, .tiff | Raster | Industry standard for georeferenced grids and satellite bands |
| JPEG 2000 | .jp2 | Raster | Wavelet-compressed raster used by ESA for Sentinel-2 imagery |
| NetCDF | .nc | Raster | Multidimensional arrays used for climate, ocean and weather grids |
| Esri ASCII Grid | .asc | Raster | Plain-text header followed by space-separated cell numbers |
How to convert between vector and raster
You can convert data in either direction inside QGIS or in your browser, though every conversion trades away some information.
Raster to vector (vectorizing)
Turning a raster into vector features happens in three main ways:
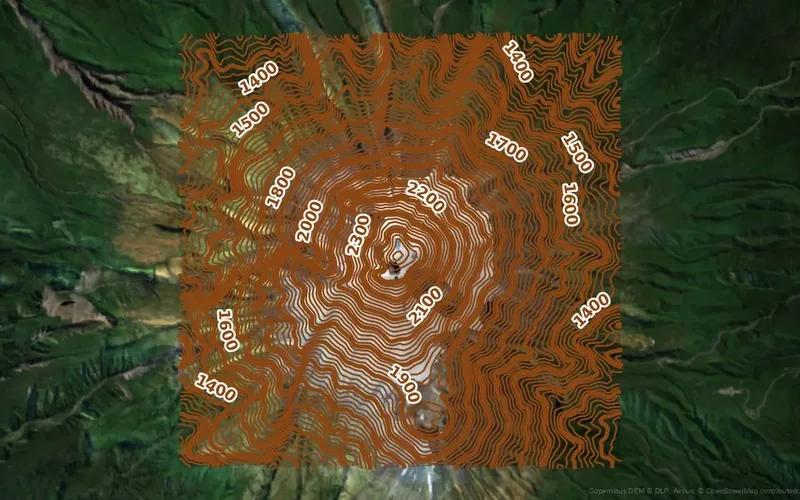
- Contour extraction. From a continuous elevation raster, you connect points of equal height into vector lines. Try this in your browser with our free contour line generator, which turns elevation data into downloadable vector contour lines without installing software.
- Polygonize (
Raster > Conversion > Polygonizein QGIS). For a classified raster (such as land cover or flood depth zones), QGIS groups contiguous cells that share the same value into vector polygons. Because cells are squares, the raw polygons have stair-step edges unless you smooth them afterward. See our step-by-step guide on converting raster to vector in QGIS. - Feature extraction from imagery. From an aerial or satellite photo, segmentation models trace buildings, roads or trees into clean vector polygons.
Vector to raster (rasterizing)
In QGIS, open Raster > Conversion > Rasterize (Vector to Raster). You choose the output cell size (in the layer's CRS units) and the attribute column whose number will fill the cells. Any detail smaller than your chosen cell size is lost, as shown in our 10 m Annecy test at the top of the page.
If you do not want to hunt through conversion menus and set cell dimensions by hand, AI Agent, the QGIS plugin we build, can run polygonize, rasterize or contour generation from one plain-language prompt inside your project.
Vector vs raster in graphic design (JPEG, PNG, SVG)
If you searched "vector vs raster" outside a mapping project, the underlying math is identical, without the Earth coordinates attached:
- Raster graphics (JPEG, PNG, GIF, WebP, phone photos) are grids of colored pixels. When you zoom in past 100% or print a small JPEG on a large poster, the square pixels become visible and the image looks blurry or blocky. A JPEG is always a raster file.
- Vector graphics (SVG, Adobe Illustrator
.ai, EPS, fonts and logos) store shapes as mathematical paths, curves and points. You can scale an SVG logo from a business card to a billboard without losing sharpness. - Container formats (PDF, GeoPackage) can hold both vector paths and raster images inside the same file.
Questions people ask
Vector data represents geographic features as points, lines and polygons defined by exact coordinate pairs, with a table of attributes attached to each feature. Raster data divides the world into a regular grid of equally sized cells (pixels), where each cell stores one numeric value such as elevation, temperature or color. Use vector for discrete objects like buildings and roads, and raster for continuous surfaces and imagery.
A JPEG is always a raster file. It stores an image as a fixed grid of colored pixels in rows and columns, which is why a JPEG turns blocky when you zoom in too far. For scalable vector graphics in design, use SVG, AI or EPS; for georeferenced rasters in GIS, use GeoTIFF instead of plain JPEG unless you pair the JPEG with a world file (.jgw).
Satellite imagery and drone orthomosaics are raster data. The sensor captures light across a grid of pixels, storing one reflectance value per pixel in each spectral band, such as 10 m pixels on Sentinel-2's visible bands or 30 m pixels on Landsat 8. You can later trace vector buildings or roads from that imagery, but the raw image itself is always a raster grid.
Neither is better overall; each solves a different job. Vector is better for discrete features with sharp boundaries (parcels, roads, buildings), network routing and multi-column attribute tables. Raster is better for continuous measurements (elevation, rainfall, temperature), satellite and aerial imagery, and fast cell-by-cell map algebra.
Yes, using a process called vectorization or polygonization. In QGIS, Raster > Conversion > Polygonize turns connected cells of the same value into vector polygons, while Raster > Extraction > Contour turns an elevation raster into vector contour lines. Keep in mind that polygonizing a coarse raster produces stair-step edges that follow the pixel grid unless you smooth the output.
A shapefile (.shp accompanied by .shx, .dbf and .prj files) is strictly a vector format. Each shapefile stores one geometry type (points, lines or polygons) along with an attribute table. It cannot store raster pixel grids; for rasters, GIS software uses formats such as GeoTIFF (.tif) or GeoPackage (.gpkg).
A Digital Elevation Model (DEM) is almost always a raster grid where every cell stores one ground elevation value in metres or feet, such as IGN's 5 m RGE ALTI grid. Elevation can also be represented in vector form using contour lines or a Triangulated Irregular Network (TIN), which are usually derived from the raster DEM.
Do it in QGIS by asking for it
AI Agent carries out the task you describe, in your own QGIS project. Free, no card.