
AI Agent for QGIS
Ask AI Agent in QGIS for contours, hillshade or slope over your own project area.
Free plan, no credit card.
 AI Agent
Frequently asked questions
Is this contour lines generator free?
Yes. No account, no watermark and no limit on downloads. Each area can be up to 400 km², about 20 by 20 km.
Where do the elevations come from, and how recent are they?
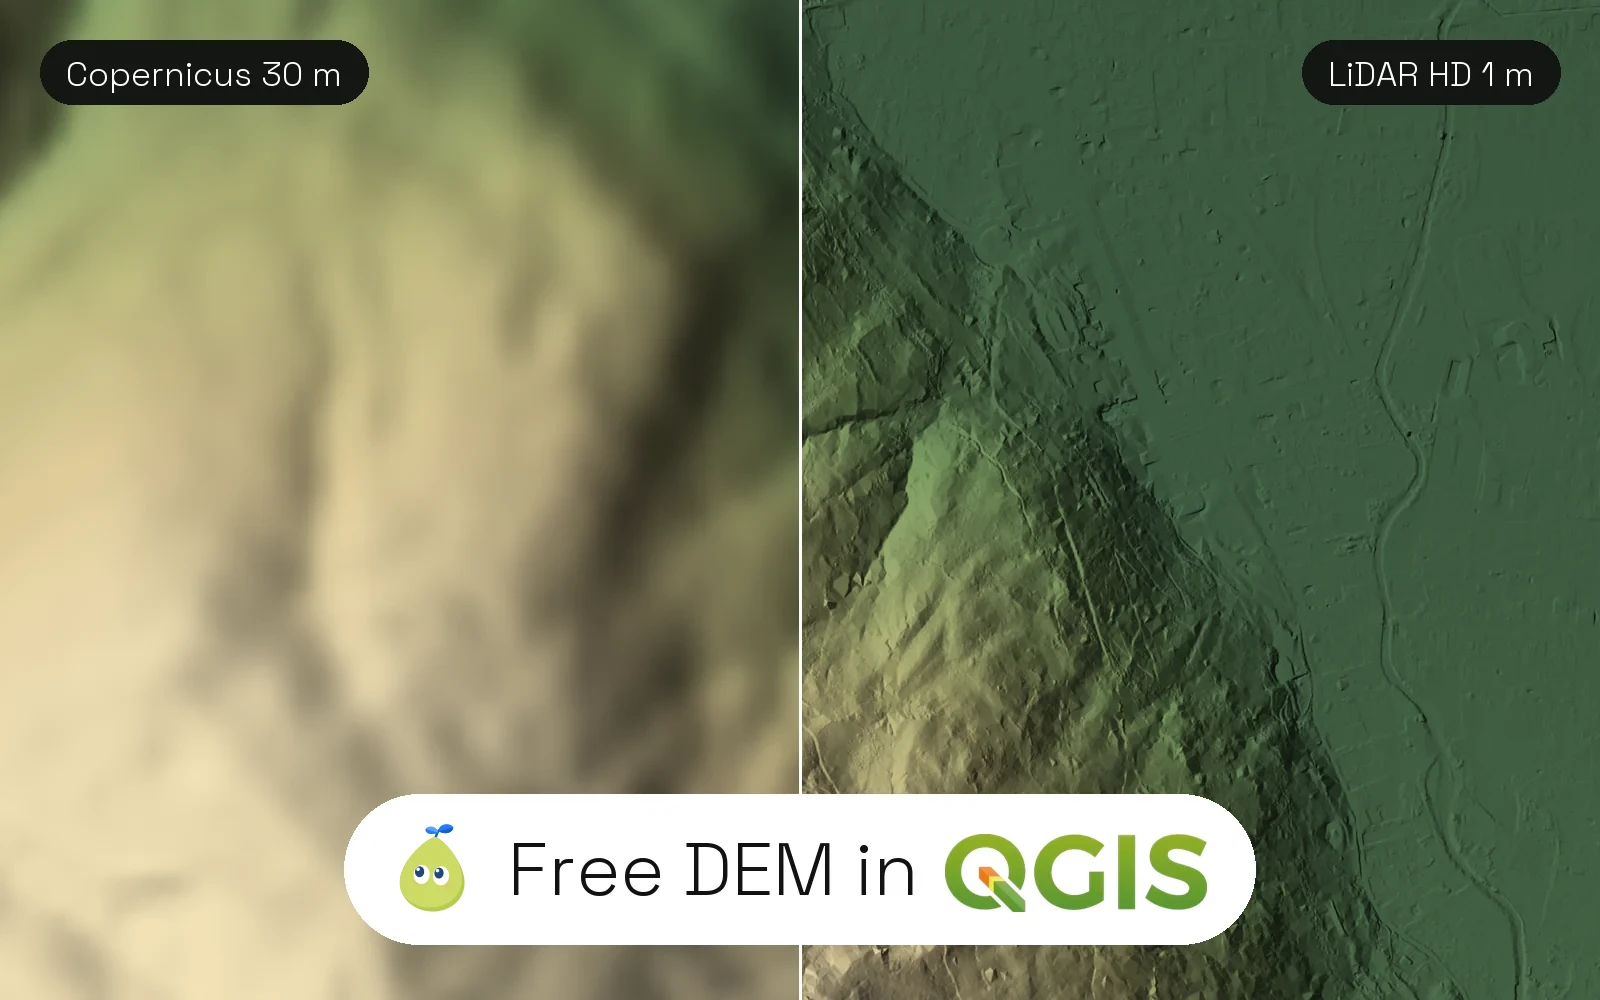
From Copernicus DEM GLO-30, the European Space Agency's global elevation model, built from TanDEM-X radar flown between 2011 and 2015. It has one value about every 30 m.
Which file formats can I download?
GeoJSON, a zipped Shapefile, KML or DXF. In the first three, every line has its elevation in metres (elev_m) and an index flag for every fifth line, in WGS 84 (EPSG:4326). The DXF is in metres, in the UTM zone of your area, with the elevation as Z.
Does it work outside Europe?
Yes. The model covers every land area on Earth, so you can pick a mountain in Nepal, a valley in Chile or a plot in Canada.
Show all 7 questions
Why do the lines look noisy in cities and forests?
The model measures the top of buildings and trees, not the bare ground. In open land and mountains the lines follow the terrain closely; for a plot survey, use a lidar model instead.
How do I open the lines in QGIS or AutoCAD?
In QGIS, drag the GeoJSON or the zipped Shapefile onto the map and label it with elev_m. In AutoCAD, BricsCAD or LibreCAD, open the DXF: the lines are 3D polylines at their real elevation.
Can I download the contour lines as DXF for AutoCAD?
Yes, for free. Pick DXF before you download. Each contour is a 3D polyline whose Z is its elevation in metres, on the layers CONTOUR_MINOR and CONTOUR_INDEX. Coordinates are in metres in the WGS 84 UTM zone of your area, and the zone and its EPSG code are written at the top of the file. One area can be up to 400 km². AutoCAD, Civil 3D, BricsCAD, LibreCAD, Fusion and QGIS open it.
About this tool
This tool draws contour lines inside the area you pick, anywhere on Earth, from the Copernicus DEM GLO-30 elevation model. Each line carries its elevation in metres, and every fifth line is marked as an index contour. Download them as GeoJSON, a zipped Shapefile or KML, ready to open in QGIS.
Copernicus DEM GLO-30 · areas up to 400 km² · GeoJSON, Shapefile, KML · no account
How it works
- Search a place, then drag the square to fit what you need, or draw a new one. Any area up to 400 km², about 20 by 20 km, works.
- The tool reads the Copernicus elevation model under the box, about one value every 30 m, and traces a line through every point at the same height.
- Change the interval and the lines redraw at once. Download the lines of the area as GeoJSON, Shapefile, KML or DXF.
Where the elevations come from
Copernicus DEM GLO-30 is a global elevation model from the European Space Agency and Airbus, built from TanDEM-X radar between 2011 and 2015. It covers every land area at 1 arc second, about 30 m. A few countries not covered at 30 m are read from the 90 m version.
It is a surface model: it measures the top of buildings and trees, not the bare ground. In open land and mountains the lines follow the terrain closely. In dense cities and forests they bend around roofs and canopy.
Copernicus DEM GLO-30 (c) DLR e.V. 2010-2014 and (c) Airbus Defence and Space GmbH 2014-2018 provided under COPERNICUS by the European Union and ESA; all rights reserved. Licence
Which interval to choose
Auto picks the interval that gives about 30 lines over your area. For a building site or a garden, 1 to 2 m. For a hiking or valley map, 10 to 20 m. For a mountain range, 50 to 100 m. Below the 30 m cell size, small intervals add lines but no real detail.
Open the lines in QGIS
Drag the GeoJSON or the zipped Shapefile onto the QGIS map. The elev_m field holds the elevation of each line and the index field is 1 for every fifth line: style by index to draw them thicker, and label them with elev_m. The lines are in WGS 84 (EPSG:4326); reproject them to your local system with Export > Save Features As.
Limits
- One area of up to 400 km², about 20 by 20 km. Smaller areas keep the full 30 m detail.
- About 30 m between elevation values (up to 50 m for the widest areas): fine for terrain, too coarse for a plot survey.
- Buildings and trees are part of the surface, so lines in cities and forests are noisy.
- GeoJSON, Shapefile and KML come in WGS 84 (EPSG:4326). The DXF comes in metres, in the WGS 84 UTM zone of the area.