
Download building footprints for any area
Compare four open building datasets, then download one.
0.00 km² / 25 km²
Bounding box
Sources
Download
 QGIS plugin
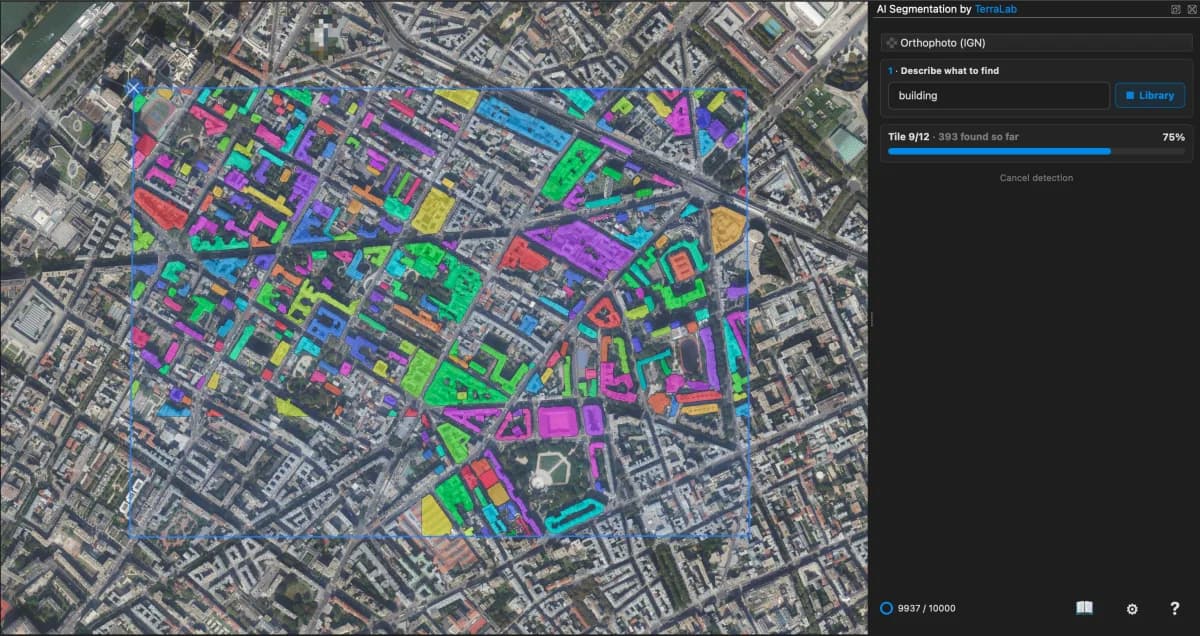
AI Segmentation for QGIS
Buildings missing or outdated in these datasets? Detect them yourself on any aerial image, in QGIS.
 AI Edit
 AI Agent
Guide
How it works, formats and limits.
About this tool
Draw a box, read the four open building datasets for it, and download the polygons as GeoJSON for QGIS or ArcGIS. No account, no email. The licence and the attribution travel inside the file.
Sources read: 4 open datasets · GeoJSON, Shapefile, KML, CSV · No account, no email · Dataset facts last checked
Six real downloads
Every picture below is one answer from this tool, drawn straight from the file it hands you. Nothing is redrawn and nothing is tidied up. Downloaded on
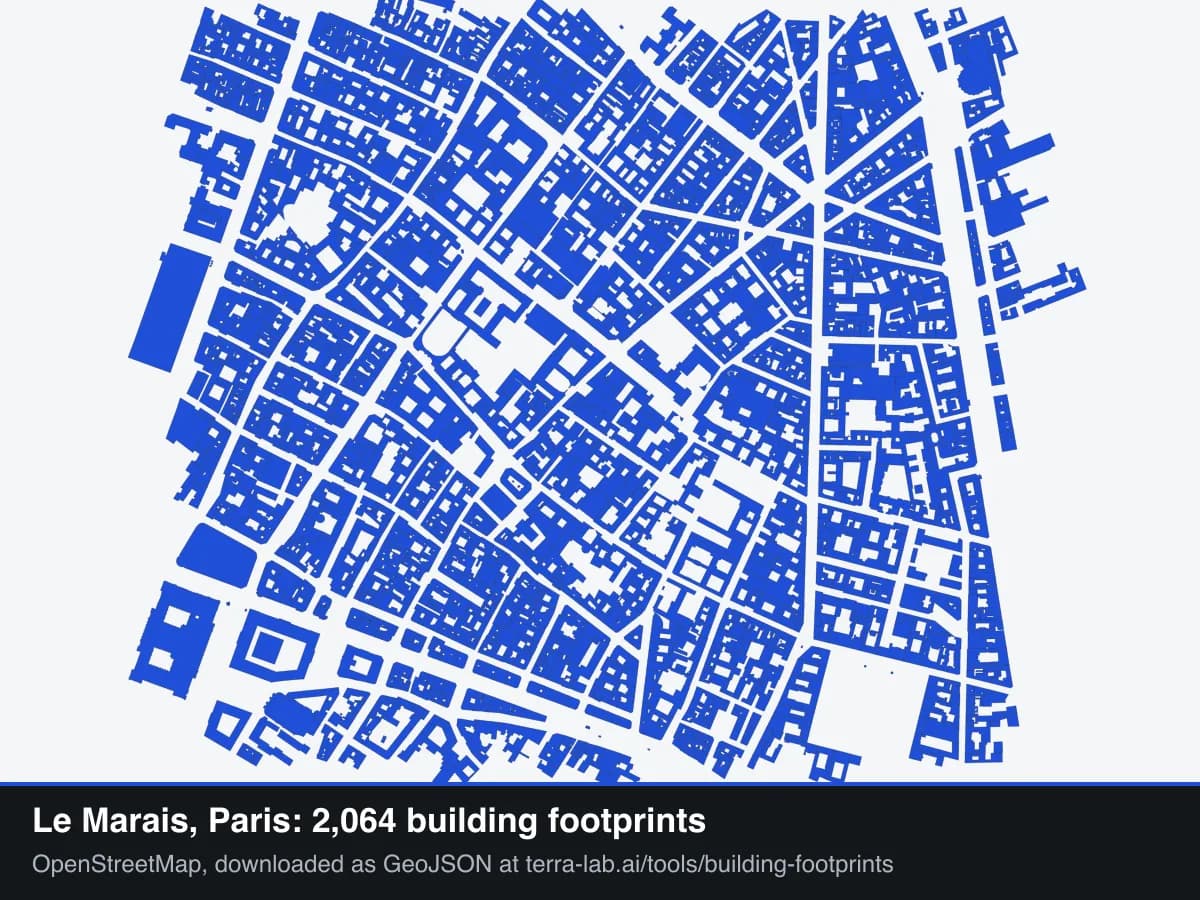
2064 buildings, OpenStreetMap Dense blocks that share their walls. One outline per building, so the courtyards behind them show. 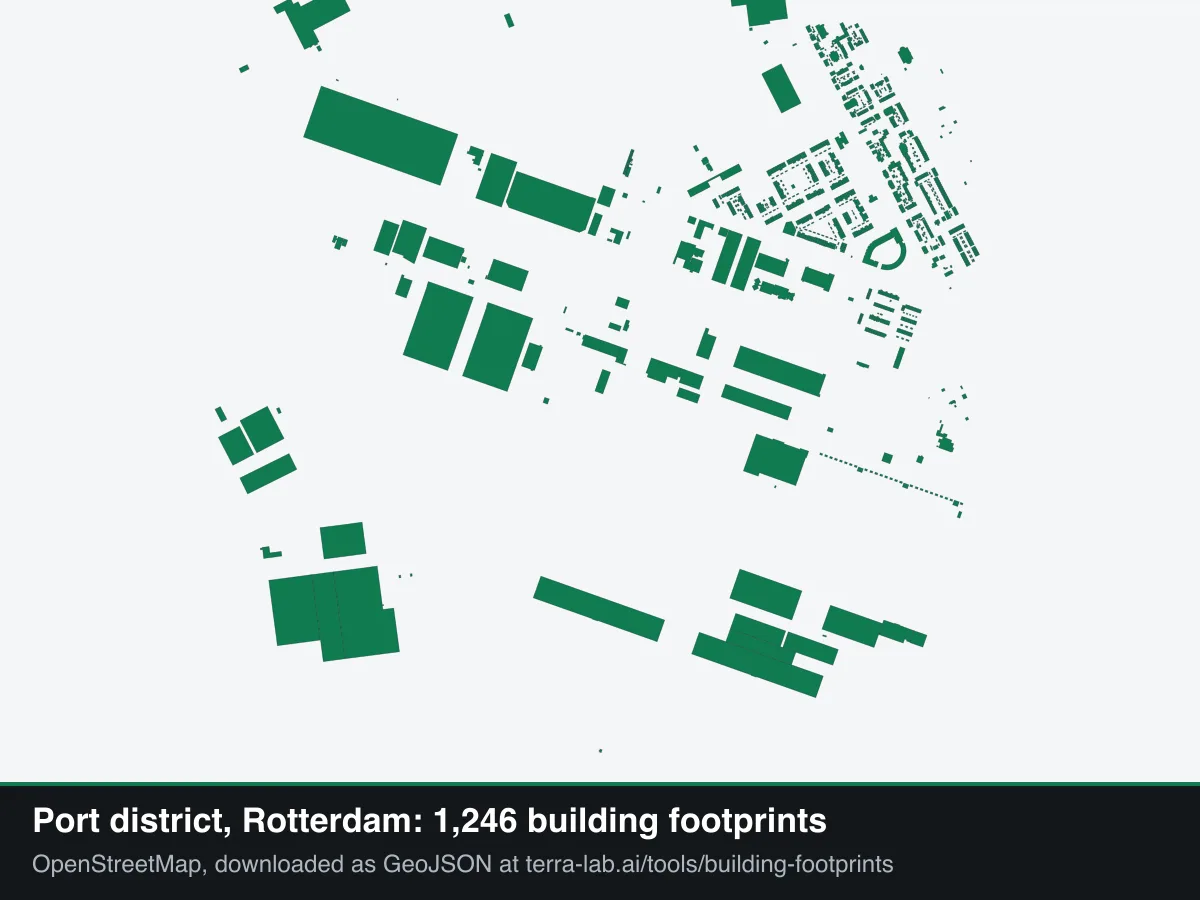
1246 buildings, OpenStreetMap Port sheds beside terraced housing. Two very different sizes of building in one download. 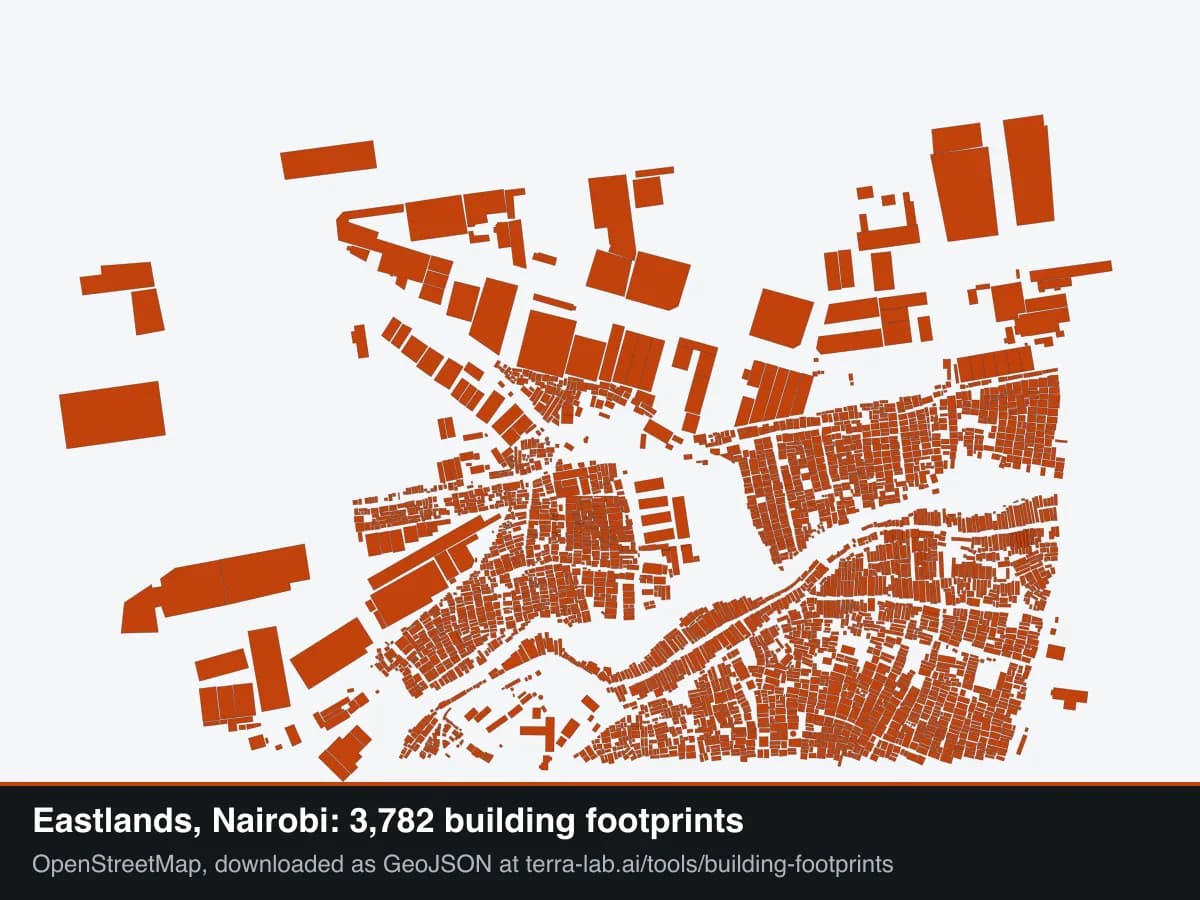
3782 buildings, OpenStreetMap 3,782 buildings inside one square kilometre, and OpenStreetMap has every one of them. 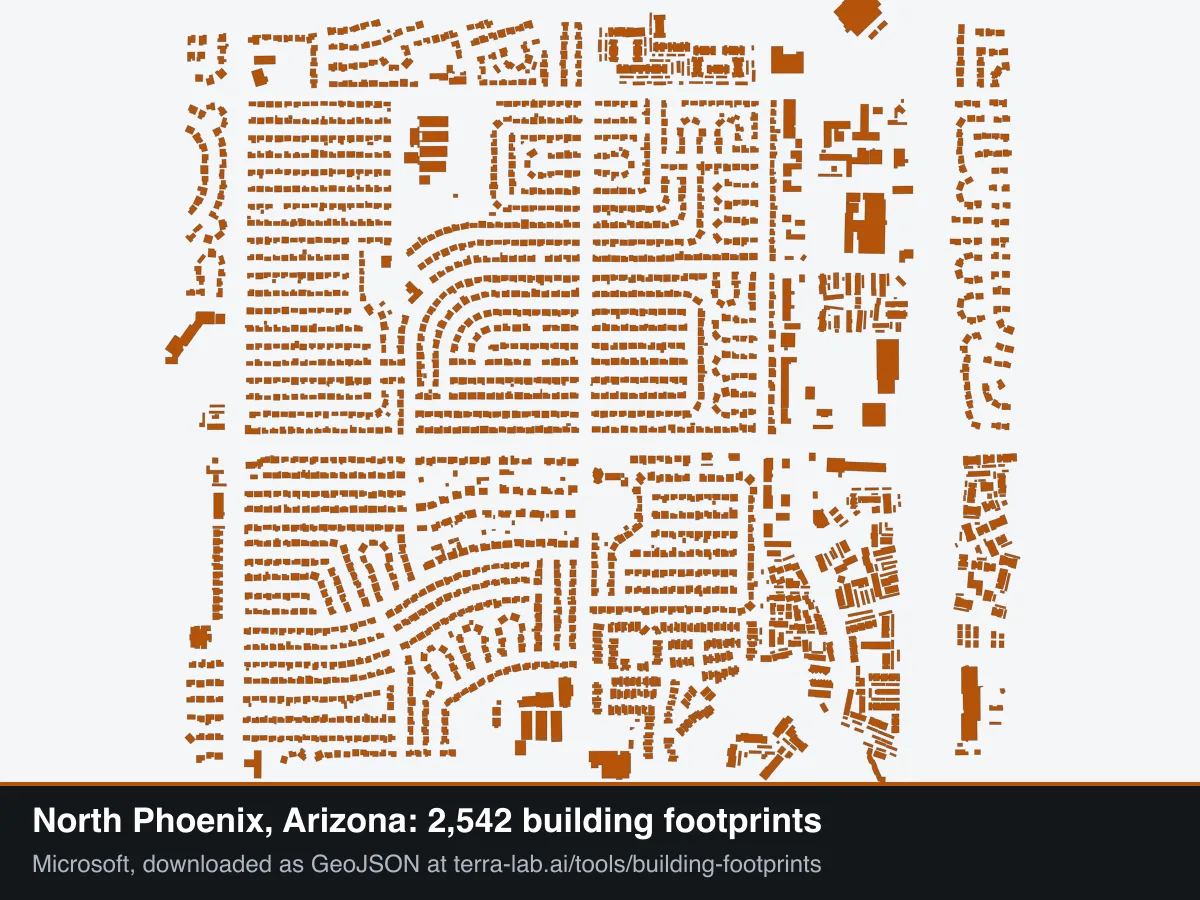
2542 buildings, Microsoft Machine detection over desert suburbia. Every house on the grid, traced from imagery rather than surveyed. 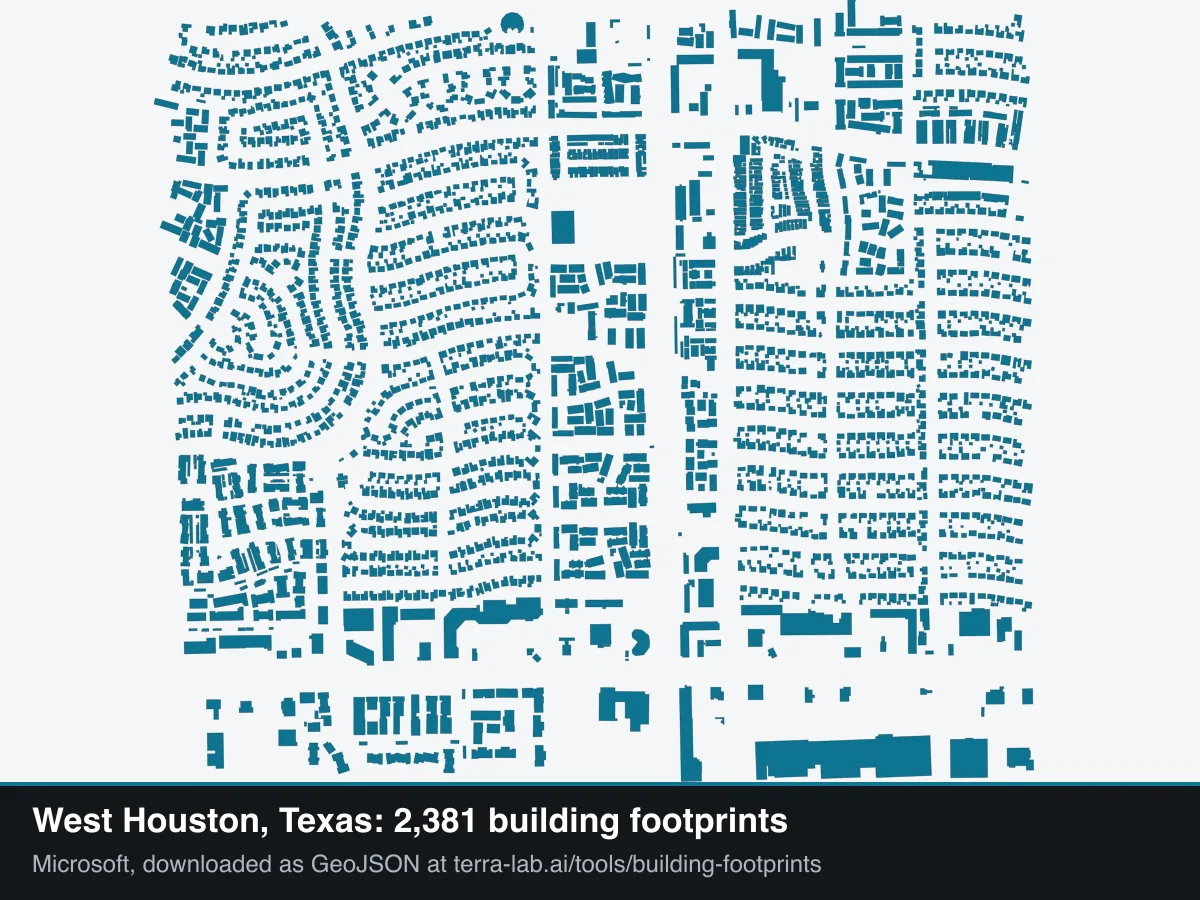
2381 buildings, Microsoft Cul-de-sacs, and the strip units on the main road. This is where Microsoft covers ground OpenStreetMap leaves thin. 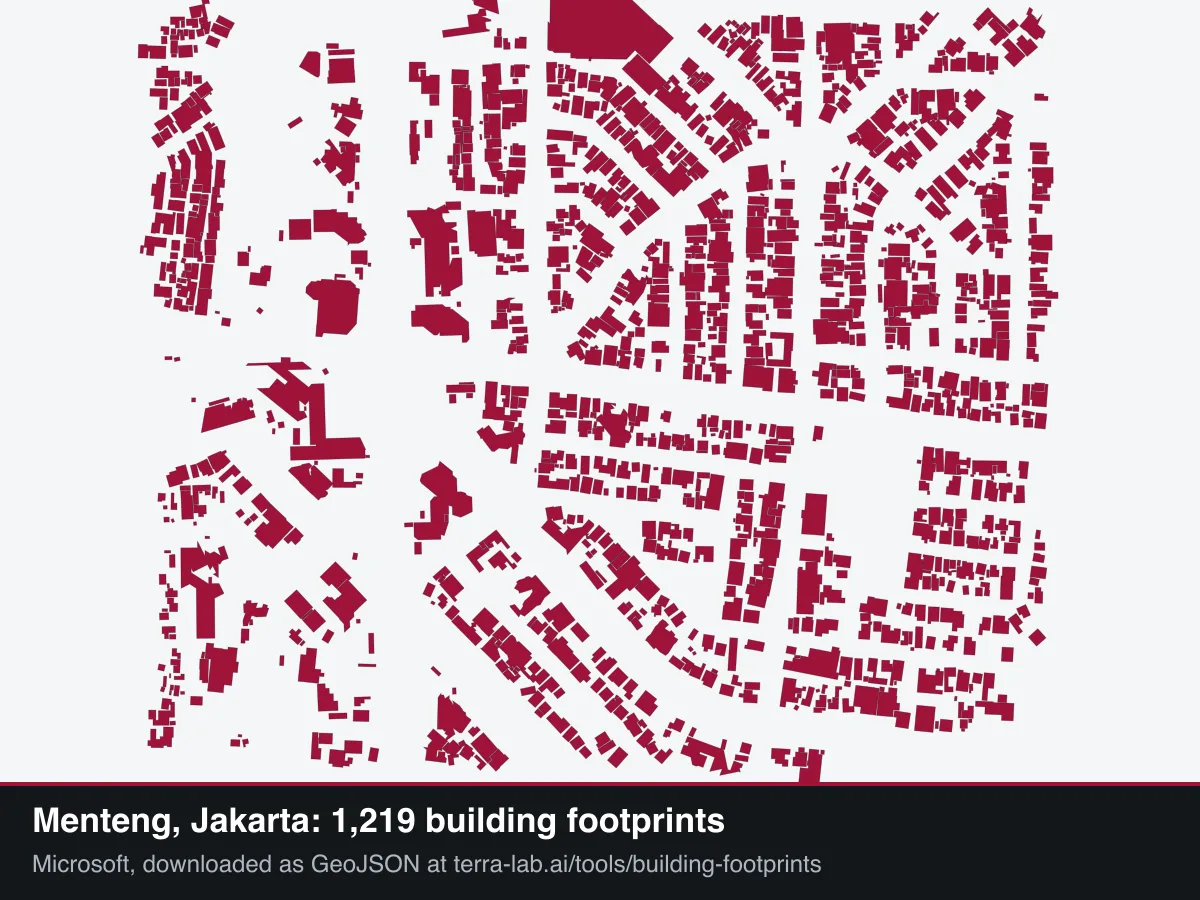
1219 buildings, Microsoft Dense low rise around larger plots. Here the two sources land within two hundred buildings of each other.
The four datasets, and what each one is good for
All four allow commercial use, and all four ask something back. Overture, OpenStreetMap and Google under ODbL want your derived database shared on the same terms. Google under CC BY 4.0 and Microsoft under CDLA Permissive 2.0 only want credit. They also disagree about the same ground, and the disagreement is the useful part.
| Dataset | Coverage | Vintage | Licence | What the polygons look like |
|---|---|---|---|---|
| Overture Maps buildings | Global. It holds what the other three hold, merged and deduplicated by Overture, so it is the most complete of the four and the quickest to answer: the box is cut server side from an index, not filtered out of a published file. | Release of 19 August 2026 | ODbL 1.0 | Merged from OpenStreetMap, Microsoft, Google and Esri, then deduplicated by Overture. One polygon per building, with a height and a floor count where an upstream dataset carried one, and the name of that upstream on every polygon. |
| OpenStreetMap | Global, and as complete as the local mapping community has made it. Dense in most European and North American cities, thin in places nobody has mapped yet. | Live. Whatever the map says right now. | ODbL 1.0 | Drawn by people. A terraced row is often one polygon. Rich attributes: address, levels, name, roof shape. |
| Microsoft Global ML Building Footprints | Global. A model ran over satellite and aerial imagery, so it fires on buildings a surveyor never visited and misses nothing on purpose. It also stops at whatever the imagery showed. | Release of 3 February 2026 | CDLA Permissive 2.0 | Detected by a model. One polygon per building, with a confidence score and a height estimate where the imagery allowed one. |
| Google Open Buildings v3 | Africa, South Asia, South East Asia, Latin America and the Caribbean only. Not Europe, not North America, not Australia. Inside that footprint it is the densest of the three. | Imagery to May 2023 | CC BY 4.0 or ODbL 1.0 | Detected by a model. Splits a compound into many small polygons, with a confidence score and an area in square metres. |
A worked example: 1 km² of central Paris
Measured on 2026-08-14 for the box 2.345400,48.852100,2.359000,48.861100, around the Île de la Cité. The numbers below are what this tool returned, not an estimate. Île de la Cité and the Latin Quarter, Paris, 1.0 km².
| Dataset | Buildings | Total footprint | What happened |
|---|---|---|---|
| OpenStreetMap | 1,391 | 454,132 m² | Answered live from Overpass in about six seconds. 326 m² per polygon. |
| Microsoft Global ML Building Footprints | 213 | 568,930 m² | One 91 MB file, quadkey 120220011, read whole and filtered to the box. 2,671 m² per polygon. |
| Google Open Buildings v3 | 0 | 0 m² | No coverage. Google Open Buildings v3 does not publish Europe. |
Read those two rows again. OpenStreetMap returns 6.5 times more polygons than Microsoft, and Microsoft covers 25% more ground. Both are true. In central Paris the model merges a whole block into one shape, 2 671 m² on average, while people drew each building, 326 m² on average. So a count tells you how the data was cut, not how much of the city is in it. That is why this page never ranks a source by its count, and why it shows total footprint area beside every one.
How the tool reads each dataset
OpenStreetMap: a live query
The box goes to Overpass, the OpenStreetMap query service, and comes back with every way and multipolygon relation tagged as a building. There is no vintage: you get the map as it stands at the moment you press the button. Relations are stitched back into proper polygons, so a building with a courtyard keeps its hole instead of arriving as loose lines.
Microsoft: one file per tile
Microsoft publishes the world as 30,344 gzipped files, one per Web Mercator zoom-9 tile, 117 GB in total. There is no index inside a file, so the only way to get a small box is to read the whole tile and throw the rest away. The median tile is small enough to do that inside a web request. A dense city is not: central Paris is a single 91 MB file. When the tile is too big, this page names the exact file instead of spinning.
Google: continent-sized files
Google Open Buildings v3 is 1.85 billion buildings in 312 files, 178 GB in total, split by S2 cell. The median file is 164 MB and the largest is 8.4 GB. Almost no box can be sliced out of that inside a web request, so for Google this page is mostly a locator: it tells you which of the 312 files covers your area and how big it is. That is still the answer most people are looking for.
Coverage is checked, not guessed
Google publishes the boundary of every cell it released, and this page carries a copy. So when the answer is "Google has nothing here", that comes from Google's own index, not from a lookup table someone typed. Google does not cover Europe, North America or Australia.
Licences and attribution
Every file this page writes carries its licence and its attribution string inside the GeoJSON, so the obligation survives the file being renamed or passed on. Read the licence before you publish anything derived from ODbL data: it is share-alike, and the other two are not.
Overture Maps buildings
ODbL 1.0 · Read the licence
Keep this line with the data
© Overture Maps Foundation, © OpenStreetMap contributors, Microsoft, Google, Esri
OpenStreetMap
Microsoft Global ML Building Footprints
CDLA Permissive 2.0 · Read the licence
Keep this line with the data
Microsoft Global ML Building Footprints, CDLA Permissive 2.0
Google Open Buildings v3
CC BY 4.0 or ODbL 1.0 · Read the licence
Keep this line with the data
© Google Open Buildings v3, CC BY 4.0 or ODbL 1.0
What this tool does not do
- Boxes are capped at 25 km². Past that Overpass times out and the file gets too large to draw in a browser.
- Polygons are never cut. A building that touches your box arrives whole, so the file can reach past the edges you drew. That matters most with Microsoft, whose polygons in a dense city can be a whole block each.
- Shapefile export cuts every field name to 10 characters, the format's limit, so long OpenStreetMap tags come out shortened. Keep GeoJSON when you need the full attribute names.
- One dataset per file. Merging two sources means deciding which duplicate to keep, and that decision belongs to you, not to us.
- A box crossing the antimeridian is refused rather than silently split.
Guides that use this data
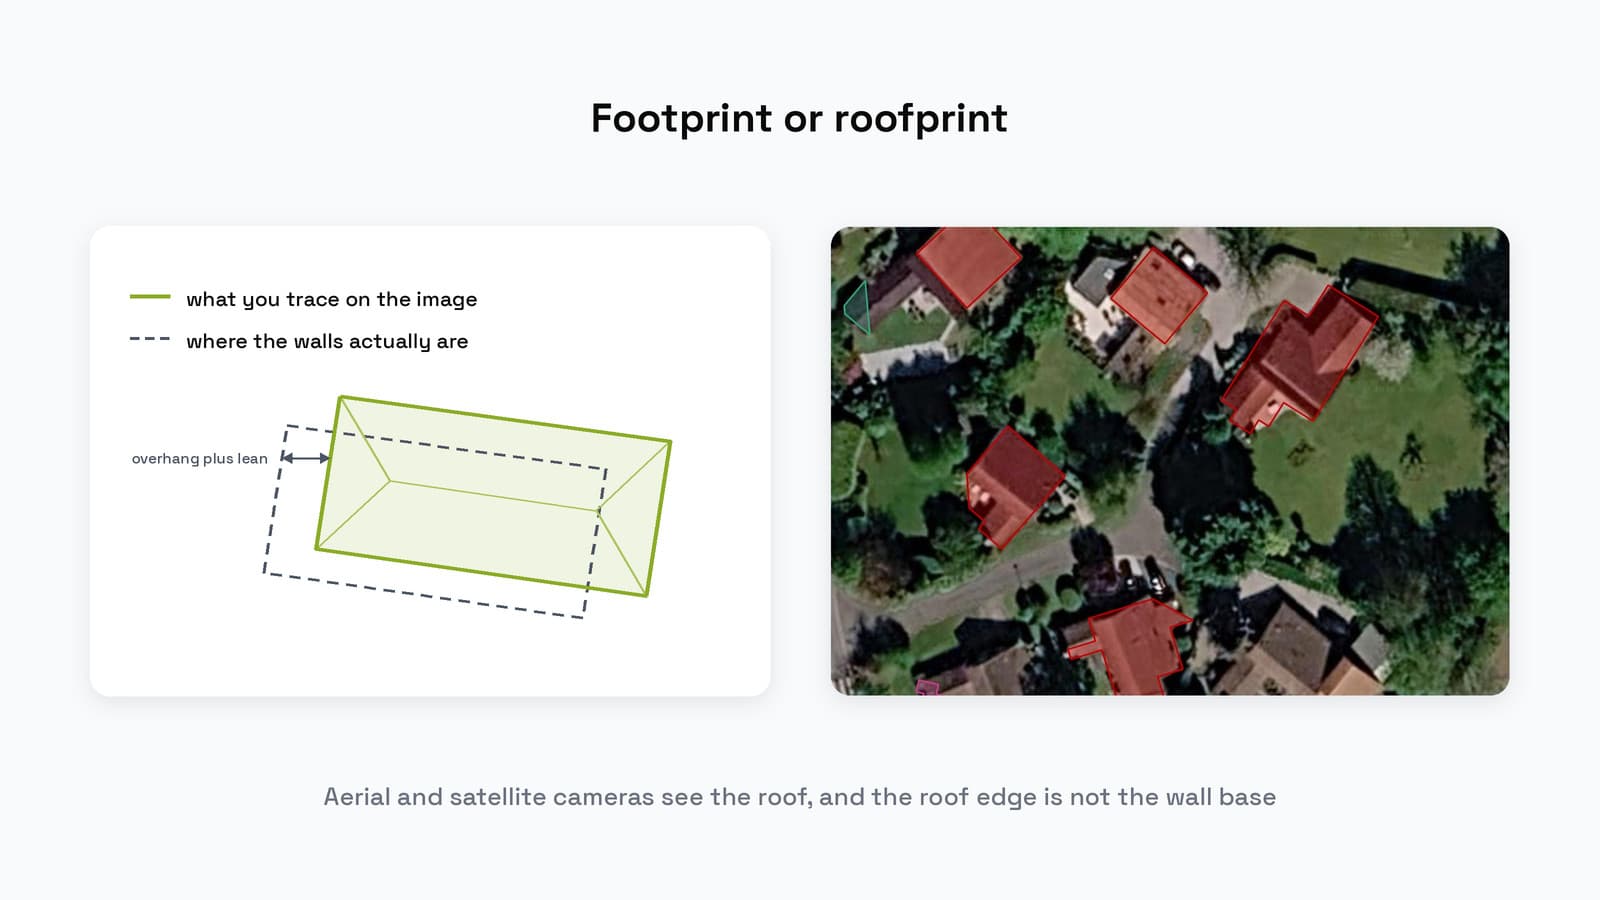 What Is a Building Footprint? Meaning & CalculationA building footprint is the ground area inside a building's outer walls. What counts, how it differs from floor area, and how to calculate it from a plan.
 Detect Building Footprints in QGIS: 3 MethodsDraw a zone, name the object, run it: you get a polygon layer in minutes. Open data, AI detection and hand-digitizing compared, with the filtering step.
 Convert Raster to Vector in QGIS: 5 MethodsFor a classified raster, use Raster > Conversion > Polygonize. Here are the five methods, the fix for staircase edges, and what to do with a photograph.
 AI Segmentation for QGIS: The Complete GuideDraw a zone, name the object, get every polygon as a clean vector layer. The full run in QGIS, the three-step review in any order, and Semi-Auto mode.
 Segment Anything (SAM) in QGIS: 7 Plugins ComparedSAM outlines an object from a click or a word. Seven QGIS plugins run it: what each costs, which needs an NVIDIA card, and how to install one.
 Semantic vs Instance Segmentation on Aerial ImagerySemantic segmentation labels every pixel with a class: building or not. Instance segmentation draws every building as its own object.
Longer read on the three ways to get building polygons, and the filtering step that decides whether the layer is usable: How to detect building footprints in QGIS