Free DEM Download: SRTM, Copernicus and LiDAR in QGIS
Published
A DEM, or digital elevation model, is a raster in which every cell holds a height. Depending on the dataset, that height is the bare ground or the top of the trees and roofs, which DSM vs DTM vs DEM explains in detail.
The fastest free DEM download for anywhere on Earth is the Copernicus DEM GLO-30, a 30 m model you can stream into QGIS from its public copy on AWS, with no account. In the United States, USGS 3DEP gives bare ground at 1 m. In France, IGN's LiDAR HD gives it at 0.5 m.
 from its public copy on AWS, with no account. In the United States, USGS 3DEP gives bare ground at 1 m. In France, IGN's LiDAR HD gives it at 0.5 m.
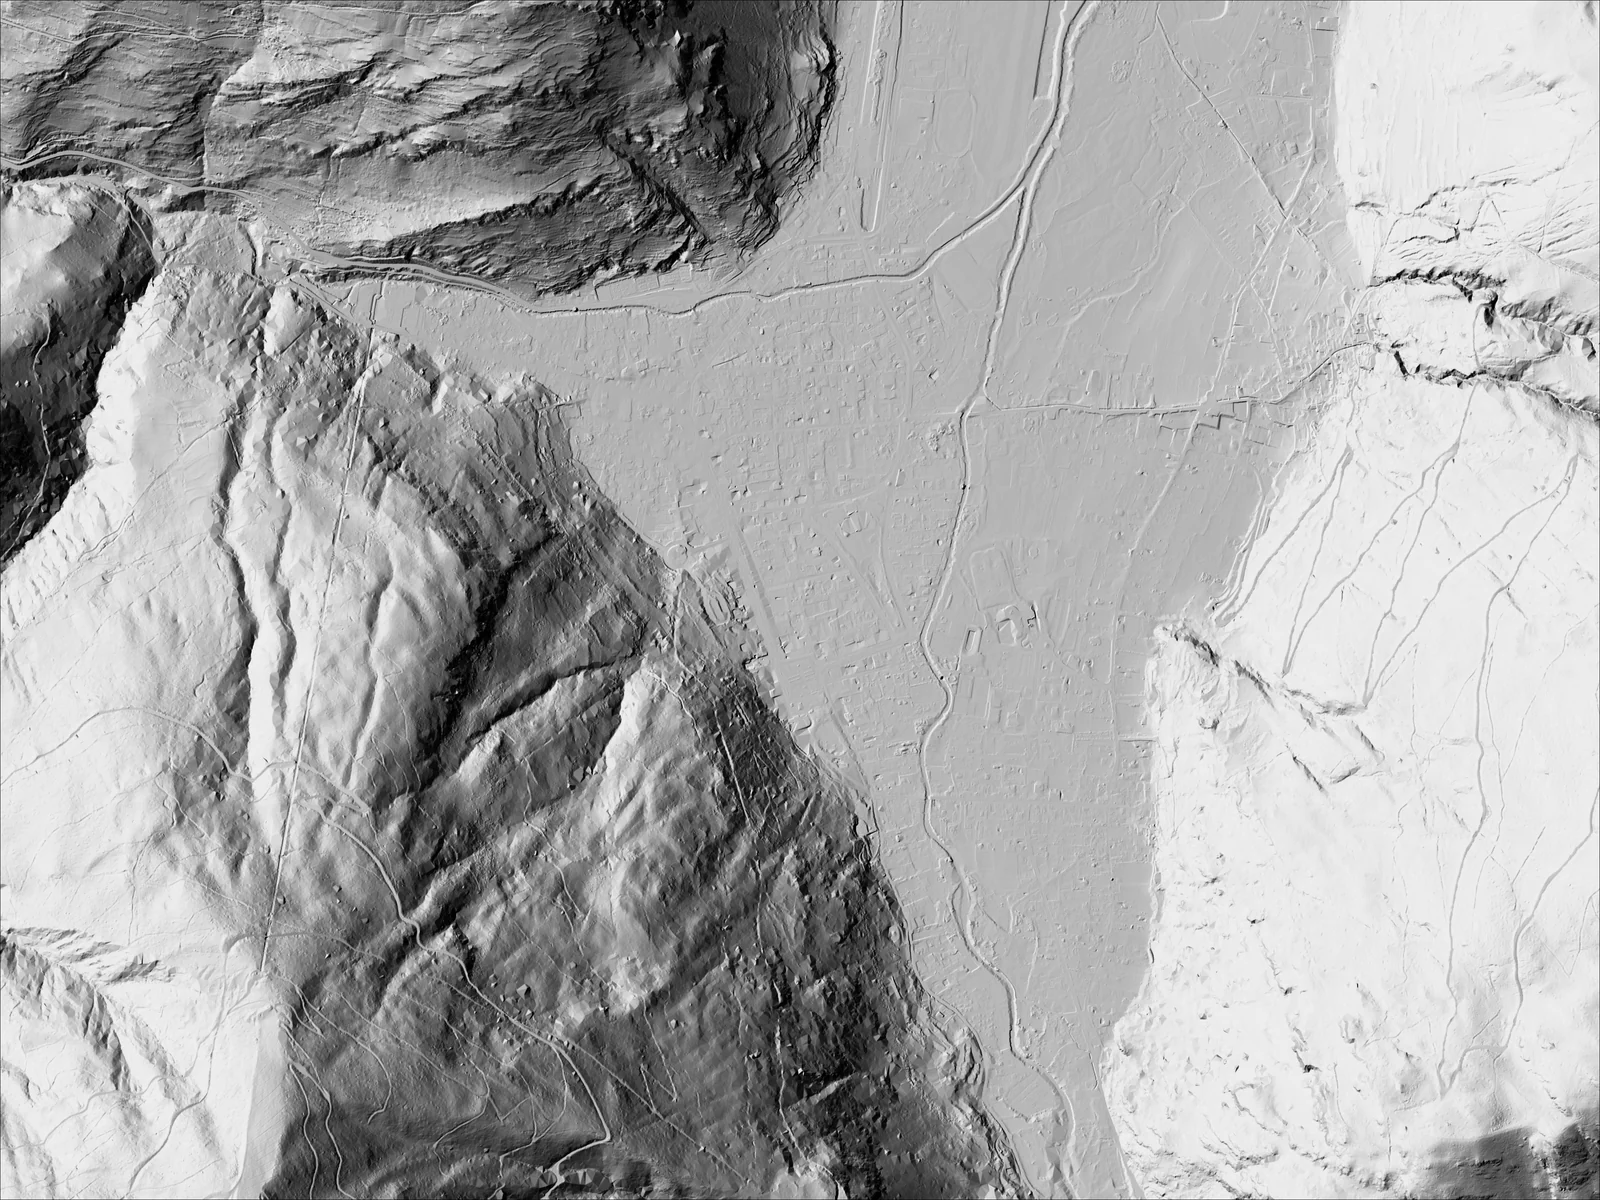
I loaded seven free DEMs over the same 12 km² around Bagnères-de-Luchon, in the French Pyrenees, on 11 October 2026, and measured six of them against IGN's LiDAR ground model. Drag the handle to see what 30 m and 1 m mean on the same valley.
The short answer
| You need | Take | Route | What I measured |
|---|---|---|---|
| A DEM anywhere on Earth, today | Copernicus GLO-30, 30 m | Stream the COG from AWS, no account | Tile open in QGIS in 7.0 s, first view in 3.6 s |
| SRTM, ALOS, NASADEM or a 30 m bare-ground model | OpenTopography DEM Downloader plugin | Free API key | 16.1 s for the 12 km² Luchon box |
| Bare ground in the United States | USGS 3DEP, 1 m or 1/3 arc-second | TNM Access API or The National Map Downloader, no account | 10 km tiles, 10 MB to 285 MB, already COGs |
| Bare ground in France | IGN LiDAR HD 0.5 m, or RGE ALTI 1 m and 5 m | Géoplateforme, no account | 4 MB per km² at 1 m, server answer in about 2 s |
| The hillshade and contours too, not only the file | One sentence to AI Agent in QGIS | Free plan | 3 min 10 s for IGN's 5 m model, a hillshade and 730 contours |
My default is the Copernicus DEM for a first look anywhere, then the national LiDAR model the moment the work involves water, slope or anything under trees. The test below shows why.
Where to download a DEM for free: 11 sources compared
Every source below is free to download. Fewer are free of a sign-in than the word "free" suggests: SRTM, ASTER and ALOS want a NASA or JAXA account or an OpenTopography key, EU DTM wants the key, while the Copernicus DEM, NASADEM, USGS 3DEP and IGN's French data open with no account at all. I checked each row on the publisher's page and, where a route needs no account, downloaded through it, on 11 October 2026.
| DEM | Cell size | Covers | Surface or bare ground | Licence | Sign-in | Fastest free route |
|---|---|---|---|---|---|---|
| Copernicus DEM GLO-30 | 30 m | Whole world | Surface (DSM), TanDEM-X radar, 2011 to 2015 | Free, commercial use included, with credit to DLR and Airbus | None on AWS | Stream the COG from the public AWS bucket |
| Copernicus DEM GLO-90 | 90 m | Whole world | Surface (DSM) | Same as GLO-30 | None on AWS | The copernicus-dem-90m bucket |
| SRTM 1 arc-second | 30 m | 60° N to 56° S | Surface, radar flown in February 2000 | Open, no restriction | NASA Earthdata login, or an OpenTopography key | OpenTopography plugin |
| NASADEM | 30 m | 60° N to 56° S | Surface, SRTM reprocessed | US government work | None on Planetary Computer | Planetary Computer STAC |
| ALOS AW3D30 | 30 m | Whole world | Surface, optical stereo, 2006 to 2011 | Free, commercial use allowed, JAXA terms | JAXA registration, or an OpenTopography key | OpenTopography plugin |
| ASTER GDEM v3 | 30 m | 83° N to 83° S | Surface, optical stereo, 2000 to 2013 | Open, no restriction | NASA Earthdata login | NASA Earthdata Search |
| EU DTM | 30 m | Continental Europe | Bare ground, predicted by machine learning | CC BY 4.0 | OpenTopography key | OpenTopography plugin |
| USGS 3DEP 1 m | 1 m | United States, where LiDAR was flown | Bare ground (DTM) | Public domain | None | TNM Access API, tiles are COGs |
| USGS 3DEP 1/3 arc-second | About 10 m | Lower 48, Hawaii, Puerto Rico, parts of Alaska | Bare ground (DTM) | Public domain | None | The National Map Downloader |
| IGN RGE ALTI | 1 m and 5 m | France | Bare ground (DTM), from LiDAR, aerial photos or radar depending on the zone | Licence Ouverte 2.0 | None | Géoplateforme download service, one archive per département |
| IGN LiDAR HD MNT | 0.5 m | France, block by block | Bare ground (DTM), from LiDAR | Licence Ouverte 2.0 | None | One GeoTIFF per square kilometre, address in the tile layer |
Three things the table can't show.
EU-DEM is gone. Older tutorials still send you to the 25 m EU-DEM. The Copernicus Land Monitoring Service now says it "is not maintained anymore and is no longer available on our website" and points to the Copernicus DEM instead. The 10 m Copernicus version for Europe, EEA-10, is reserved for public authorities and EU projects, so GLO-30 is the best Copernicus resolution an independent consultant can download.
SRTM-Downloader now needs the same key as OpenTopography. The QGIS 3 version installed here, 3.3.4, sends its requests to OpenTopography's API and asks for an OpenTopography key, not a NASA login. A free key covers both plugins.
IGN's WCS answered 404. Older guides load French elevation through a WCS at data.geopf.fr/wcs. On 11 October 2026 that address returned no Route matched with those values. The raster WMS still serves real heights as GeoTIFF, and the tile layer gives a direct address per square kilometre.
For the US, the 3DEP tiles are worth knowing better. Each 1 m tile covers 10 km by 10 km in UTM, is already a cloud-optimized GeoTIFF on a public bucket, and weighed 10 MB to 285 MB on the two tiles I checked near Boulder, Colorado. You can stream one into QGIS by URL like the Copernicus tiles below.
Same valley at 30 m, 5 m and 1 m: what free DEMs miss
On forested slopes, the free 30 m DEMs measure the trees, not the ground. Around Luchon, where 72% of the box stands under trees taller than 3 m, the Copernicus DEM sat a mean 14.6 m above IGN's LiDAR ground in fully wooded cells, and 0.3 m below it on open ground. The box is 4 km by 3 km across the Pique valley, from the town on the valley floor at 612 m to forested slopes at 1,631 m.
The 30 m model also smooths away anything a few cells wide: streets, terraces, river banks. Zoomed on the town centre, the three resolutions look like three different places.
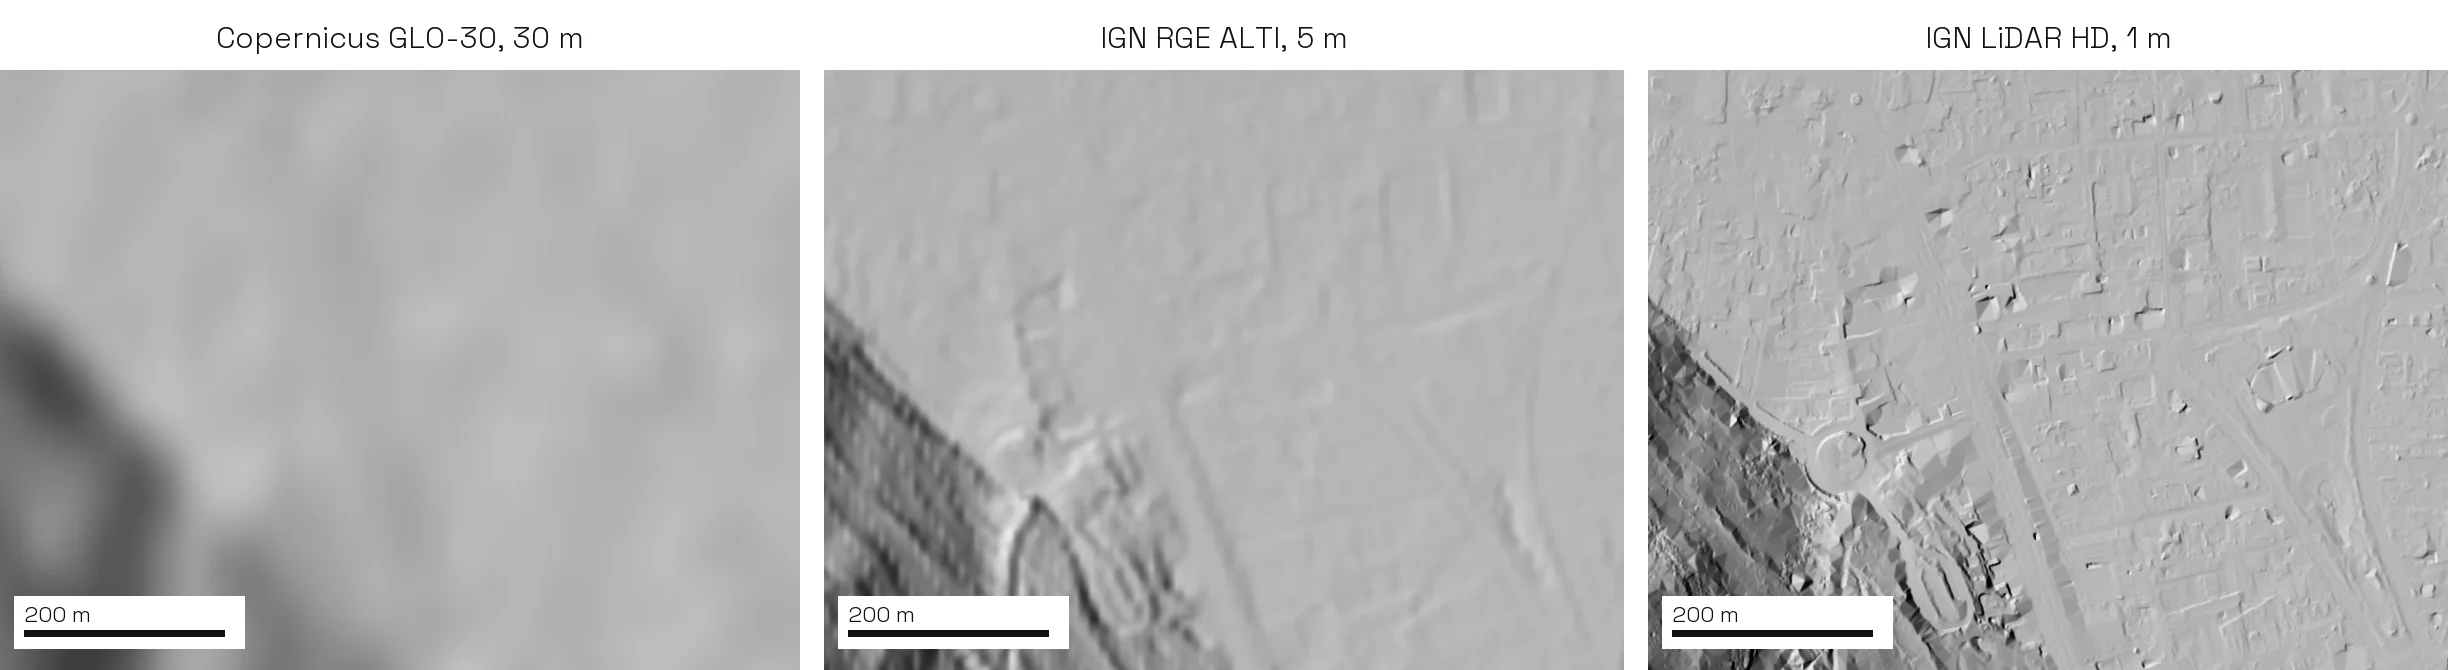
Across the whole valley the shapes agree, and the gap opens wherever there are trees. Along a 4 km line from west to east through the town, the orange Copernicus line rides 5 to 25 m above the ground on both wooded slopes and drops onto it on the open valley floor.
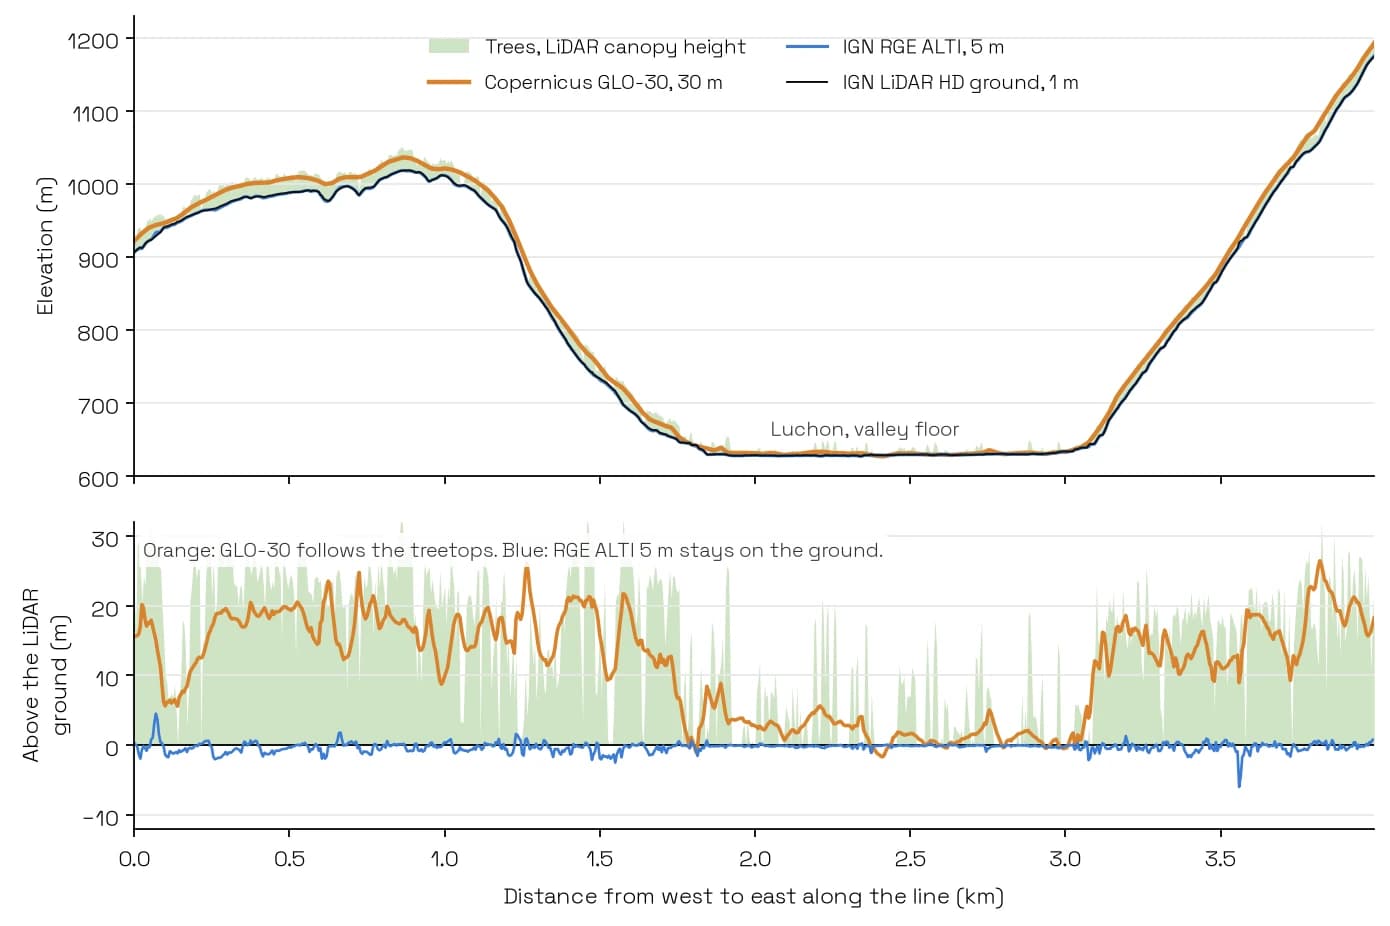
LiDAR sees the ground under a forest because some of its pulses pass between the leaves and return from the soil. Radar and stereo photographs return from the canopy, which is why SRTM, ALOS and the Copernicus DEM all behave like surface models here. Photogrammetry vs LiDAR covers the difference between the sensors.
Which free 30 m DEM is closest to the ground
Copernicus is the most accurate 30 m DEM where nothing stands on the ground, and EU DTM is the only one that stays close under the forest. Each model was compared cell by cell with the LiDAR ground averaged into the same cell.
| 30 m DEM | Under full forest, mean height above the LiDAR ground | Open ground, mean | Open ground, RMSE | All cells, RMSE |
|---|---|---|---|---|
| Copernicus GLO-30 | +14.6 m | −0.3 m | 1.2 m | 12.1 m |
| SRTM 1 arc-second | +12.7 m | +2.5 m | 3.9 m | 11.8 m |
| NASADEM | +11.5 m | +1.2 m | 3.1 m | 10.9 m |
| ALOS AW3D30 | +17.7 m | +3.6 m | 4.0 m | 14.7 m |
| EU DTM | +1.9 m | −1.3 m | 2.7 m | 5.9 m |
EU DTM is a machine-learning terrain model of Europe, trained on GEDI and ICESat-2 ground heights, and it brings the forest error from about 15 m down to 2 m at the cost of a slightly worse fit on open ground. For slope, drainage or flood work in a wooded European valley, it is the best free 30 m choice I found. Everywhere else, and for anything with no trees on it, I'd take Copernicus. It is only available through OpenTopography, so it needs the free key.
How we measured this. The box runs from 501,000 to 505,000 m east and 6,189,000 to 6,192,000 m north in Lambert-93. The reference is IGN's LiDAR HD terrain model, flown between 20 August 2021 and 20 September 2022, fetched at 1 m in 12 requests of 1 km², with IGN's LiDAR canopy height model for the tree mask. Each 30 m DEM stayed on its own grid. A cell counts as full forest when more than 90% of it is under canopy over 3 m (8,448 Copernicus cells) and as open when less than 10% is (1,361 cells), and cells within two cells of the box edge were dropped. The DEMs use different vertical datums (EGM2008, EGM96, IGN69) and I did not convert them; the open-ground biases stay under 4 m, which bounds that effect. One valley in one mountain range, with the LiDAR flown in late summer, so read the numbers as an order of magnitude for wooded mountains, not as a global ranking.
RGE ALTI or LiDAR HD in France: check the source map first
In France, RGE ALTI at 1 m matched the LiDAR HD ground within 0.98 m RMSE over 96% of the Luchon box, and missed it by 7.3 m RMSE on the other 4%. The split follows where IGN built RGE ALTI from. Its source map on the Géoplateforme marks 94% of the box as a laser survey and one patch of the western slope as filled from radar, and in that patch 45% of the cells are off by more than 5 m.
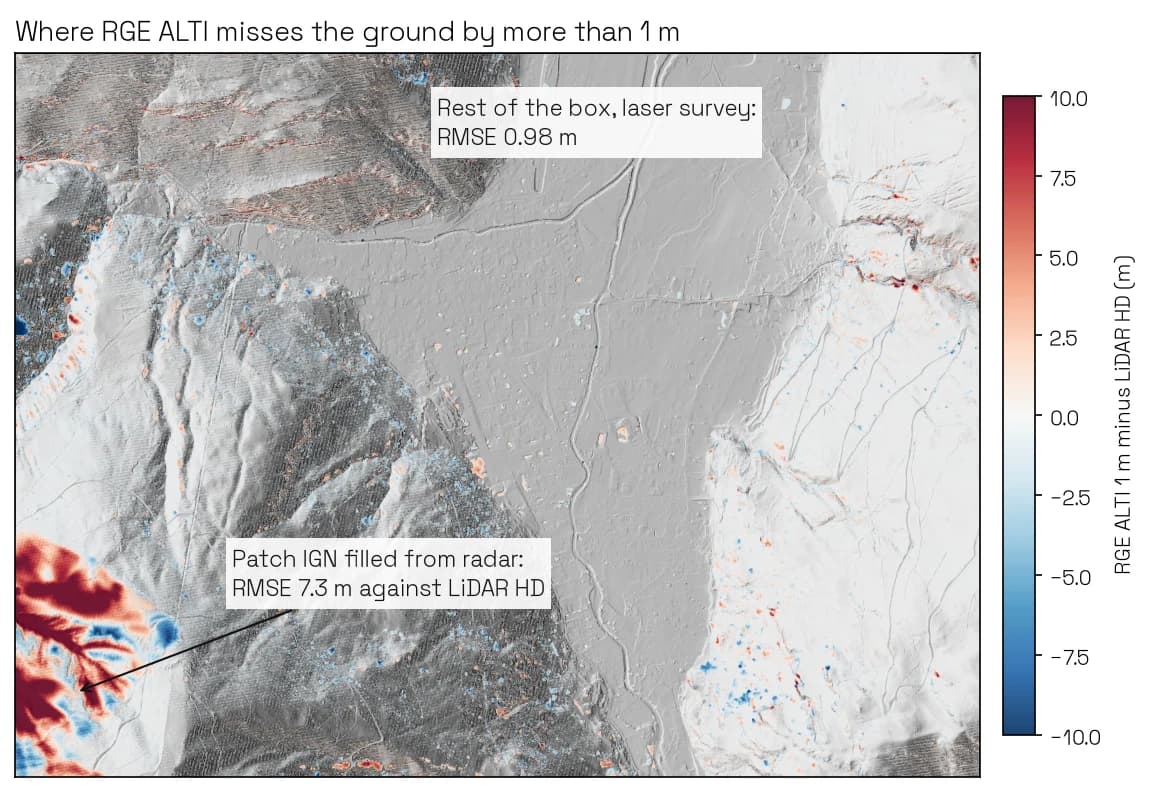
IGN stopped updating RGE ALTI in 2024, according to its data.gouv.fr page, while LiDAR HD replaces it. Where the LiDAR HD terrain model is published, take it. Where it isn't yet, load the layer ELEVATIONGRIDCOVERAGE.HIGHRES.QUALITY from the Géoplateforme WMS-R before you trust a slope on a mountainside: it colours each zone by source and gives the expected error in its legend. One more detail from the same test: RGE ALTI at 5 m scored 1.68 m RMSE against 1.72 m at 1 m, so for valley-scale work the 5 m file has 25 times fewer cells for the same fit.
How to get a DEM into QGIS
Four routes cover almost every case. The first two work anywhere on Earth; the third is for countries that publish their own LiDAR; the fourth does the download and the processing from one sentence.
Method 1: Stream the Copernicus DEM from its cloud copy, no account
The Copernicus DEM sits on AWS as one cloud-optimized GeoTIFF per 1° by 1° tile, readable by anyone. QGIS reads such a file over HTTP and only fetches the part on screen, so you never download the whole tile.
Build the tile address
The tile name is the south-west corner in whole degrees. Luchon, at 42.79° N and 0.59° E, sits inN42_00_E000_00: https://copernicus-dem-30m.s3.amazonaws.com/Copernicus_DSM_COG_10_N42_00_E000_00_DEM/Copernicus_DSM_COG_10_N42_00_E000_00_DEM.tif. For 90 m, swap 30m for 90m and COG_10 for COG_30.Add it as a raster
Layer > Add Layer > Add Raster Layer, set Source type to Protocol: HTTP(S), cloud, etc., paste the address and click Add.Save the part you need
Right-click the layer,Export > Save As…, set the Extent to the map canvas or to a layer of your area, and write a GeoTIFF. Do this before any analysis so you work on a local file.In my test the 3,600 by 3,600 pixel tile opened in 7.0 seconds and the first view over Luchon drew in 3.6 seconds. The same tile is also listed in Earth Search's STAC catalogue as cop-dem-glo-30, which the STAC browser in QGIS 3.40 and newer can search; the address above skips that step.
Use it when: you need a DEM anywhere on Earth, today, with no account. Skip it when: you need bare ground under trees, because this is a surface model.
Method 2: The OpenTopography DEM Downloader plugin
OpenTopography serves the global DEMs through one API, and the OpenTopography DEM Downloader plugin puts it in the Processing Toolbox. Version 4.2, dated 16 July 2026, offers 15 datasets: Copernicus 30 m and 90 m, SRTM 30 m and 90 m, NASADEM, ALOS World 3D, EU DTM and the newer global terrain models among them.
Get a free key
Create a free account on opentopography.org and request an API key from your myOpenTopo page. The plugin has required one since January 2022.Pick the DEM and the extent
OpenProcessing Toolbox > OpenTopography DEM Downloader, choose the dataset, then draw the extent on the canvas or take it from a layer.Run
Paste the key, leave the output as a temporary file or pick a path, and clickRun. The plugin remembers the key for next time.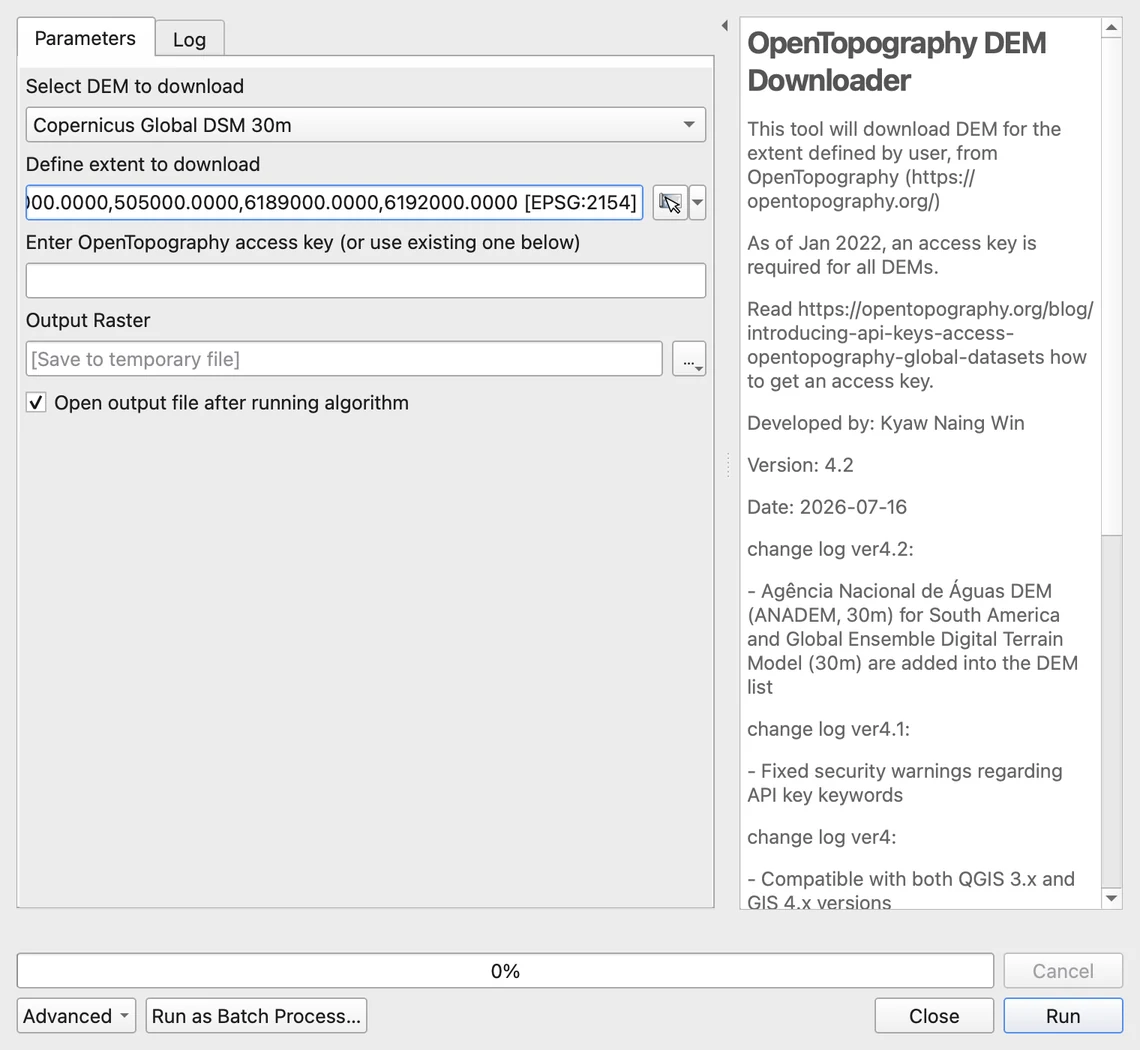
The Luchon box came back in 16.1 seconds, as a 180 by 101 pixel GeoTIFF in EPSG:4326, even though I drew the extent in Lambert-93. Calling the same API directly took 11 to 19 seconds per dataset for SRTM, NASADEM, ALOS, Copernicus and EU DTM, over two rounds. The free tier is capped at 50 calls a day for non-academic users, which is plenty for a project and not enough for a batch over a whole country.
Use it when: you want to compare several global DEMs, or you need SRTM, ALOS or EU DTM. Skip it when: you have no key and want Copernicus only. Method 1 is faster to set up.
Method 3: A national LiDAR DEM, USGS 3DEP or IGN
National agencies publish LiDAR terrain models at 1 m or finer, and nothing global comes close at the scale of a street or a field.
- United States. Query the TNM Access API or The National Map Downloader for "Digital Elevation Model (DEM) 1 meter". Each result carries a
downloadURLonprd-tnm.s3.amazonaws.comthat opens with no sign-in, and since the tiles are COGs you can stream them exactly as in Method 1. - France. For LiDAR HD, the
IGNF_LIDAR-HD_METADONNEE:metadatalayer of the Géoplateforme WFS lists every published square kilometre with aurl_mntfield: paste that address in a browser, then drag the GeoTIFF into QGIS. The LiDAR HD guide walks through it with the PointCloudFR plugin as well. RGE ALTI comes as one archive per département from the Géoplateforme download service, in ASCII grid tiles.
One catch with the French route: the url_mnt address is a WMS request. Pasted into Add Raster Layer as a URL, GDAL's WMS driver catches it and serves a picture, not heights. Download the file first, then add it.
Use it when: your area is in a country with a LiDAR programme and you need slopes, drainage or flood levels at street scale. Skip it when: your area crosses a border. A national model stops at it, as Method 4 shows.
Method 4: One sentence to an AI agent in QGIS
We build one of these tools, AI Agent, a chat panel inside QGIS that runs the steps in the project you have open. This section is about our own tool.
It fits the reader who wants the result, not the file: the DEM loaded, reprojected, shaded and contoured, without picking a source by hand. In an empty project I typed:
Load an elevation model of Bagnères-de-Luchon in the French Pyrenees, then make a hillshade and 20 m contour lines.
3:10min
from Send to answer
8
actions in one message
5m
IGN terrain model it chose
730
contour lines at 20 m
It geocoded Luchon, searched its data catalogue, picked IGN's 5 m RGE ALTI terrain model, streamed only the part around the town, and computed the hillshade and 730 contour lines in Lambert-93, so the slopes are in metres. Most of the 3 minutes 10 seconds went to streaming the 5 m model over a slow connection.
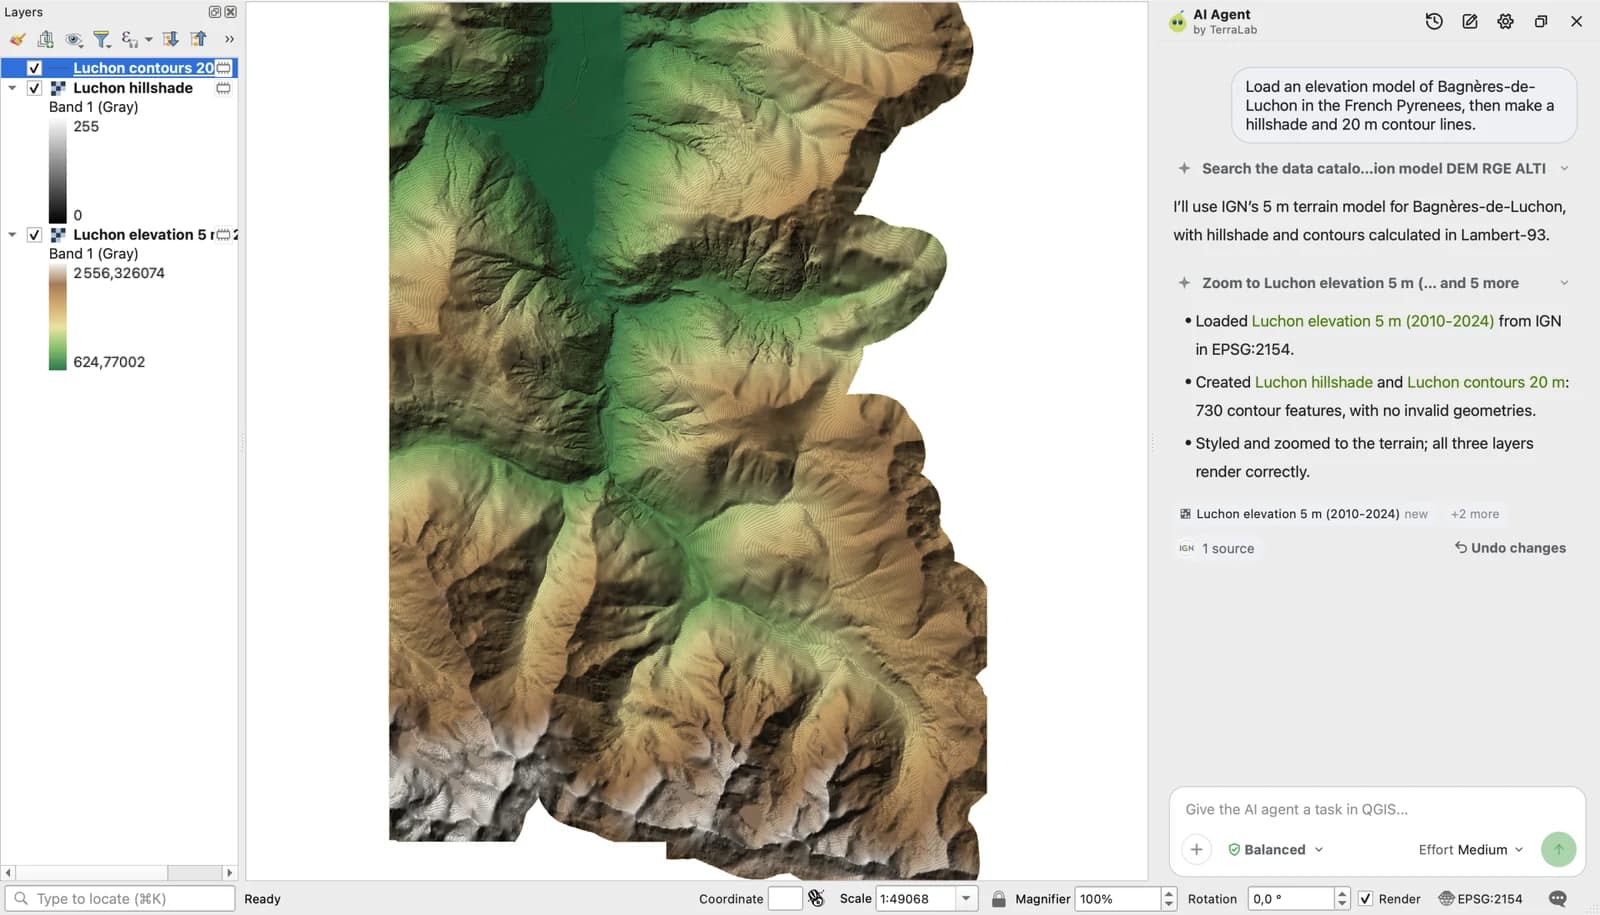
Two earlier runs of the same request taught me its limits. In the first, the 5 m stream ran past the agent's 5-minute budget for one step, while my own test downloads shared the line, and it switched to the Copernicus DEM on its own and said so: from there, download, reprojection, hillshade and 610 contours took 34 seconds. In the second, the right side of the map came back blank past the Spanish border at Bossòst, because a national model stops at the frontier. For a valley that crosses a border, ask it for the Copernicus DEM by name.
Try it free in QGIS, no card needed
Use it when: you want the DEM and its first products in one step, or you don't know which national source covers your area. Skip it when: you need the raw 0.5 m LiDAR HD tiles on disk. Method 3 gets them, and the LiDAR HD guide shows the PointCloudFR route.
After loading: merge, clip, reproject, then hillshade and contours
A DEM straight from a download is rarely ready to analyse. These steps take a few minutes in QGIS, in this order, and the third one is the one people skip.
Merge the tiles
Several tiles become one layer withRaster > Miscellaneous > Build Virtual Raster. It writes a small .vrt file that points at the tiles, with no copy. My Luchon box needed 12 LiDAR HD tiles of one square kilometre each.Clip to your area
Raster > Extraction > Clip Raster by Extent or by Mask Layer. Everything after this runs faster on the clipped file.Reproject to metres
Raster > Projections > Warp (Reproject) to a projected CRS in metres, such as the national grid or the UTM zone. Global DEMs come in EPSG:4326, in degrees, and QGIS's slope tools then divide metres of height by degrees of distance. On the Copernicus tile for Luchon, both Slope tools in QGIS returned 90° on every single cell. After reprojecting to Lambert-93, the mean slope was 22.6°. What a CRS is explains degrees against metres.Fill NoData if there is any
Raster > Analysis > Fill NoData interpolates small holes, such as voids over water or radar shadow. Check first with the layer's histogram: none of the DEMs I loaded over Luchon had a hole, and filling a border or a sea is not a repair.Hillshade
Raster > Analysis > Hillshade, or set the layer's symbology to Hillshade with Multidirectional ticked. Keep the Z factor at 1 once the layer is in metres.Contours
Raster > Extraction > Contour, with an interval suited to the cell size: 20 m on a 30 m DEM in mountains, 1 to 5 m on LiDAR. A 1 m interval on a 30 m DEM draws noise, not terrain.If the next step is water, use a bare-ground model and read how to simulate a flood in QGIS: a surface model holds water behind every hedge and building.
What to remember
- The Copernicus DEM GLO-30 is the fastest free DEM for anywhere on Earth: stream it from AWS by URL, no account, 30 m.
- It is a surface model. Around Luchon it sat 14.6 m above the ground under forest and within 1.2 m RMSE of it on open ground. EU DTM, through OpenTopography, stayed within 2 m under the trees.
- For bare ground at street scale, take the national LiDAR model: USGS 3DEP 1 m in the US, IGN LiDAR HD in France. In France, check RGE ALTI's source map: its radar-filled patches missed the ground by 7.3 m RMSE.
- "Free" does not mean no sign-in: SRTM, ASTER and ALOS need a NASA or JAXA account or an OpenTopography key. EU-DEM is no longer distributed.
- Reproject to metres before slope. On the raw Copernicus tile in degrees, both QGIS slope tools returned 90° on every cell.
- To skip the setup, one sentence to AI Agent returned IGN's 5 m model, a hillshade and 730 contours over Luchon in 3 minutes 10 seconds.
Questions people ask
Where can I download a DEM for free?
For anywhere on Earth, the Copernicus DEM GLO-30 from its public AWS bucket, with no account, or SRTM, NASADEM and ALOS through OpenTopography with a free key. For the United States, USGS 3DEP from The National Map. For France, IGN's LiDAR HD and RGE ALTI from the Géoplateforme. Most other countries publish their own LiDAR DEM through their national mapping agency.
Is the Copernicus DEM better than SRTM?
On open ground, yes: around Luchon its error was 1.2 m RMSE against 3.9 m for SRTM. Under forest both read the canopy, Copernicus 14.6 m above the ground and SRTM 12.7 m. Copernicus is also more recent: its radar data were acquired between 2011 and 2015, against February 2000 for SRTM.
Do I need an account to download SRTM?
From NASA, yes: SRTM sits behind a free NASA Earthdata login. Through OpenTopography you need a free API key instead, and both the OpenTopography plugin and SRTM-Downloader 3.3.4 ask for that key. NASADEM, the reprocessed SRTM, opens with no account on Microsoft's Planetary Computer.
Which free DEM has the highest resolution?
National LiDAR models: 0.5 m for IGN LiDAR HD in France and 1 m for USGS 3DEP in the United States, both bare ground. The best free global DEMs stop at 30 m. Copernicus has a 10 m version for Europe, EEA-10, but only public authorities and EU projects may download it.
Why does my slope come out as 90 degrees in QGIS?
The DEM is in degrees, usually EPSG:4326, and the slope tool is dividing a height in metres by a distance in degrees. Reproject the DEM to a metric CRS with Raster > Projections > Warp (Reproject), then run the slope again. On the Copernicus tile for Luchon that took the result from 90° everywhere to a mean of 22.6°.
Is a DEM a DSM or a DTM?
It depends on the dataset. The global 30 m DEMs behave like surface models over forest, and the national LiDAR DEMs are bare ground. DSM vs DTM vs DEM shows how to tell which one you downloaded.
What happened to EU-DEM?
The Copernicus Land Monitoring Service withdrew it. Its page now says EU-DEM "is no longer available on our website" and recommends the Copernicus DEM at 30 m. OpenTopography's EU DTM is a different and newer dataset, a bare-ground model at 30 m.
Once the DEM is in, simulating a flood in QGIS is the natural next step, and the LiDAR HD guide covers the French point clouds behind the 0.5 m terrain model. If your next layer is imagery rather than terrain, downloading Sentinel-2 in QGIS follows the same tested format, and the QGIS AI hub lists the rest.