GIS Digitizing in QGIS: By Hand, From a Scan, or With AI
Published
Digitizing in GIS means turning what you see on a map or a photo into vector shapes: points, lines and polygons you can measure and query. In QGIS, you create a layer, switch on editing and click each corner of the object. QGIS has four faster ways round that, from tracing along existing lines to letting AI Segmentation outline every building in a zone at once.
 , you create a layer, switch on editing and click each corner of the object. QGIS has four faster ways round that, from tracing along existing lines to letting
 | What you start from | Method | What it costs |
|---|---|---|
| An area somebody has already mapped | Method 1, download it | Free |
| An aerial photo or satellite image, a few objects | Method 2, digitize by hand | Free, core QGIS |
| A scanned paper map | Method 3, georeference, then trace | Free, core QGIS |
| A classified raster or a clean scan | Method 4, polygonize | Free, core QGIS |
| An aerial photo, hundreds of objects | Method 5, AI that outlines them for you | Free 1.5 km² a month (Automatic), then €39 |
How much work digitizing is
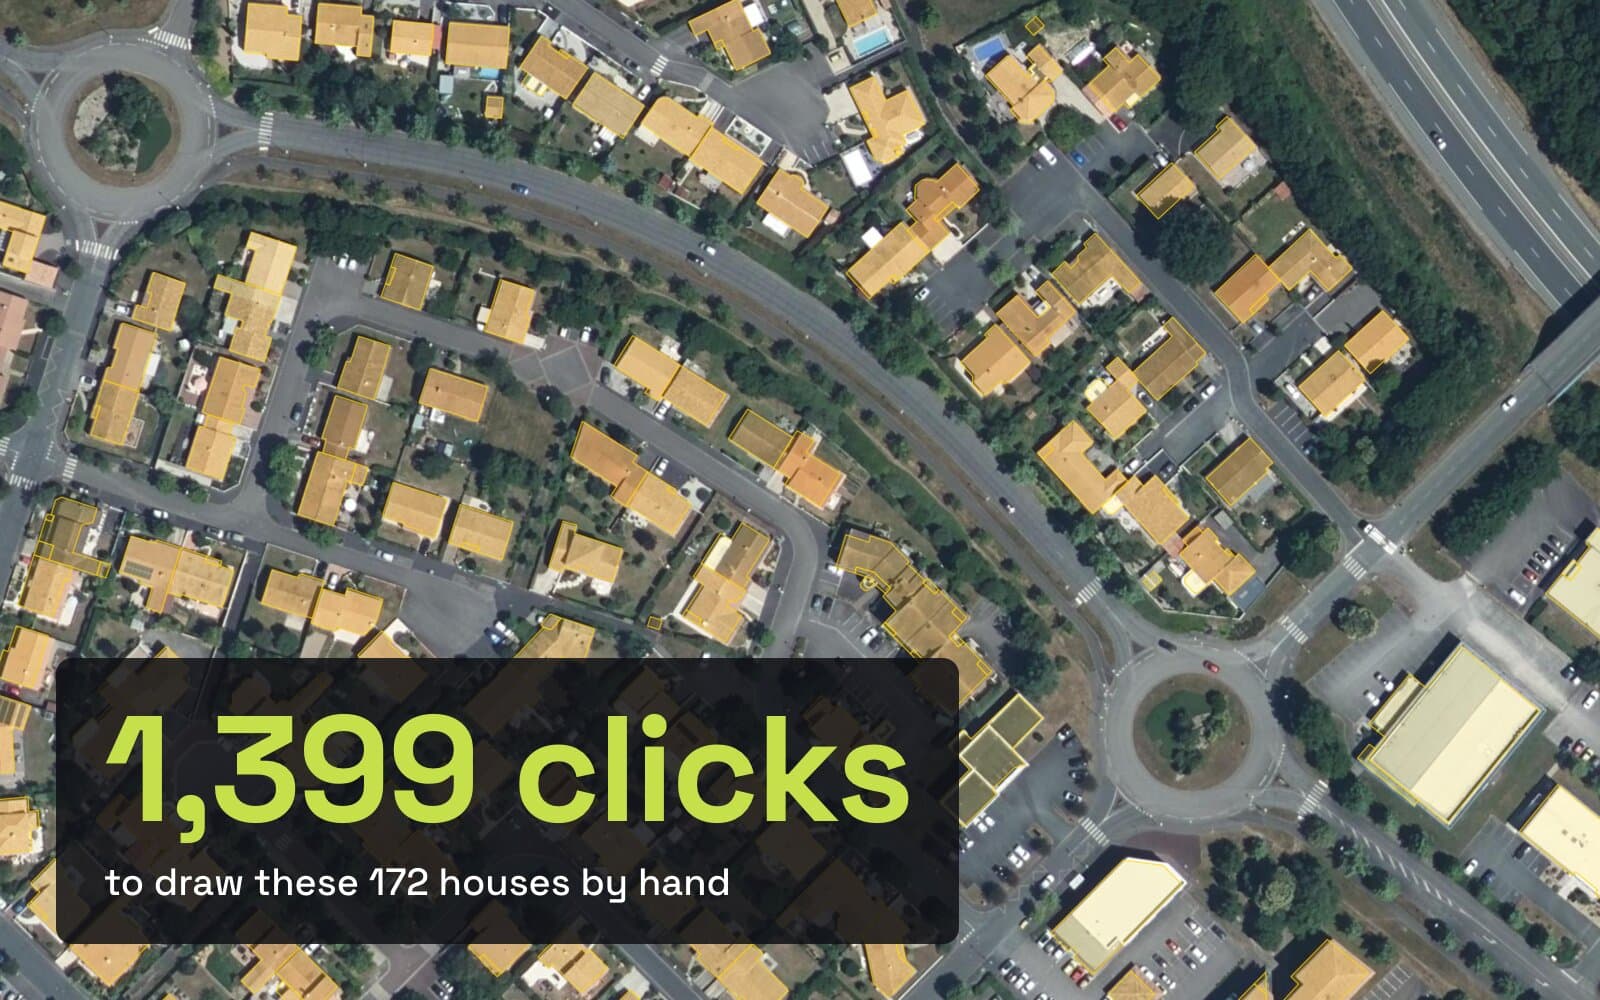
We counted it on a real block. The housing estate on the cover is 400 by 250 m of La Roche-sur-Yon, in western France, on the national IGN orthophoto. OpenStreetMap holds 172 buildings there, drawn with 1,399 corners in total.
Each corner is one click when you digitize by hand. A typical house took 7 corners, and only 59 of the 172 are simple four-corner boxes. So one small estate is about 1,400 clicks, before you fix a single mistake.
Method 1: Download what is already mapped
Check the open data before you click anything. Two free sources cover most places:
- OpenStreetMap. Install the QuickOSM plugin, then
Vector > QuickOSM > QuickOSM…, keybuilding, run it on your area. Our guide to downloading OSM data in QGIS walks through it. - Building footprint datasets. Microsoft, Google and Overture publish building outlines for most of the world. Our free building footprint downloader shows what each holds for a box you draw.
Look before you trust it. In our block, 167 of the 172 OpenStreetMap buildings came from the French land registry, not from the photo. Their outlines sit visibly off the roofs in the capture below, which is normal for registry data and wrong if you need roofs.
Use it when: your area is mapped and the outlines do not have to match your imagery.
Skip it when: the data is missing, out of date, or drawn from another source than your photo.
Method 2: Digitize by hand
This is the classic way, and every QGIS install has it.
Create a layer
Layer > Create Layer > New GeoPackage Layer…. Pick Polygon for buildings or fields, Line for roads and rivers, Point for trees or poles. Choose a projected CRS in metres, so areas come out in m².
Switch on editing
Select the layer and click the pencil, Toggle Editing. The digitizing tools turn on.
Draw the shape
Click Add Polygon Feature (Ctrl+.), then left-click each corner. Right-click to finish, and fill in the attributes that pop up.
Save
Click Save Layer Edits, or toggle editing off and confirm.
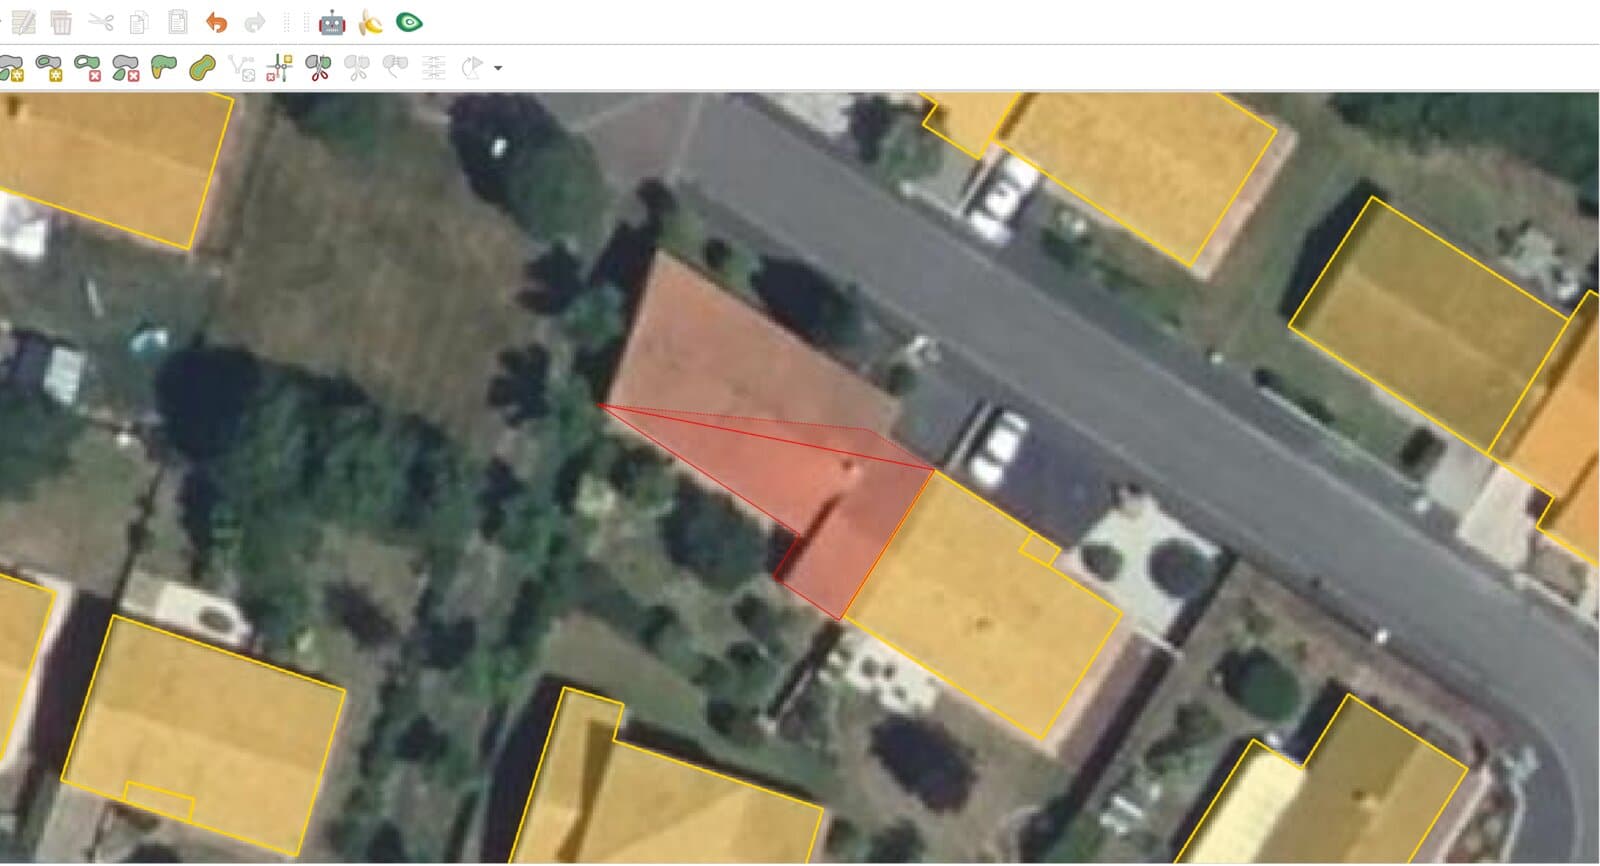
Four settings make hand digitizing faster and cleaner:
- Snapping. Turn it on from the Snapping toolbar (
View > Toolbars > Snapping Toolbar). A click near an existing corner lands exactly on it, so neighbours share their walls with no gap. - Tracing. Press
Twith snapping on, and QGIS follows the edge of an existing shape between two clicks. Useful for a field that borders a road you already have. - Avoid overlap. In the snapping options, a new polygon is cut so it never covers an existing one. Good for parcels and land cover.
- Shape tools. The Shape Digitizing toolbar draws a rectangle from three clicks, a circle or an ellipse. A plain house takes three clicks instead of four or more.
Fix mistakes with the Vertex Tool: drag a corner, double-click an edge to add one, or select a corner and press Delete.
Use it when: you need a few dozen shapes, or precise ones.
Skip it when: you need hundreds of the same thing. That is Method 5.
Method 3: Digitize a scanned map
A scan has no coordinates, so place it on the map first. Open Layer > Georeferencer…, load the scan, and click points you can find on both the scan and a reference map, such as road crossings. Our guide on how to georeference an image in QGIS tests it on a 1947 map.
Once the scan sits in place, digitize on top of it with the tools of Method 2. Turn the scan semi-transparent in the layer properties, so you can compare it with today's imagery underneath.
Use it when: the information only exists on paper, such as an old plan or a hand-drawn survey.
Skip it when: a modern dataset already has the same lines.
Method 4: Convert a raster to polygons
If the map is already a raster of classes, such as a land cover map or a clean black-and-white scan, QGIS can draw the polygons for you. Use Raster > Conversion > Polygonize (Raster to Vector)…. Every patch of the same value becomes one polygon.
The edges come out as staircases that follow the pixels. Our guide to converting raster to vector in QGIS shows the clean-up: dissolve, drop tiny areas, then simplify and smooth.
Use it when: each pixel value already means a class.
Skip it when: the input is an ordinary photo. A photo has millions of colours, not classes, so polygonize returns noise.
Method 5: Digitize automatically with AI
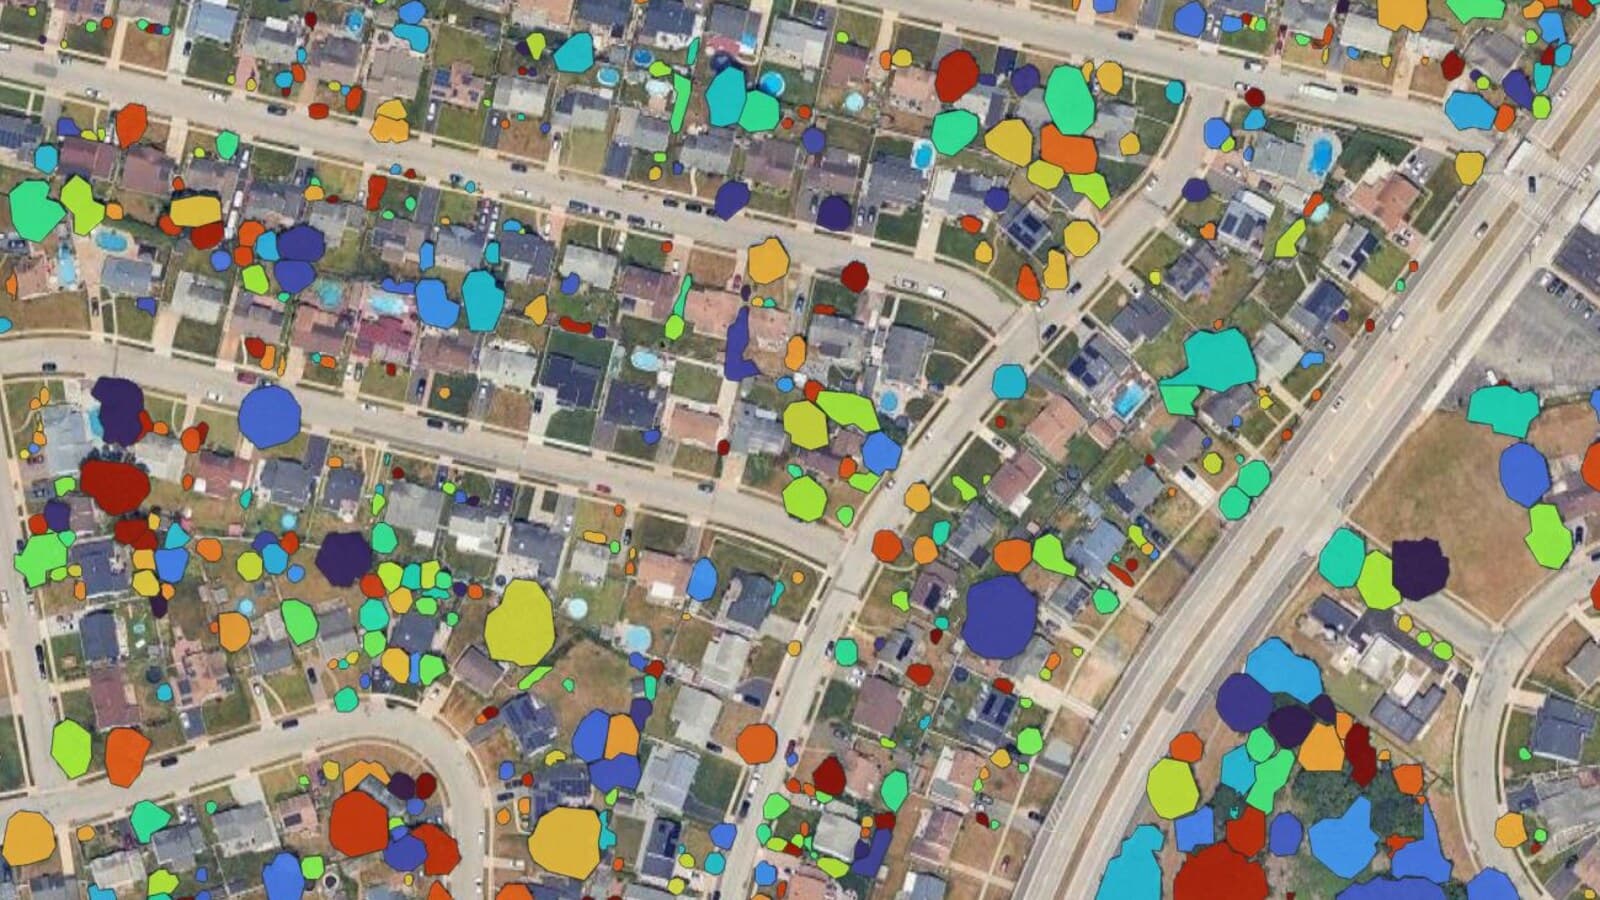
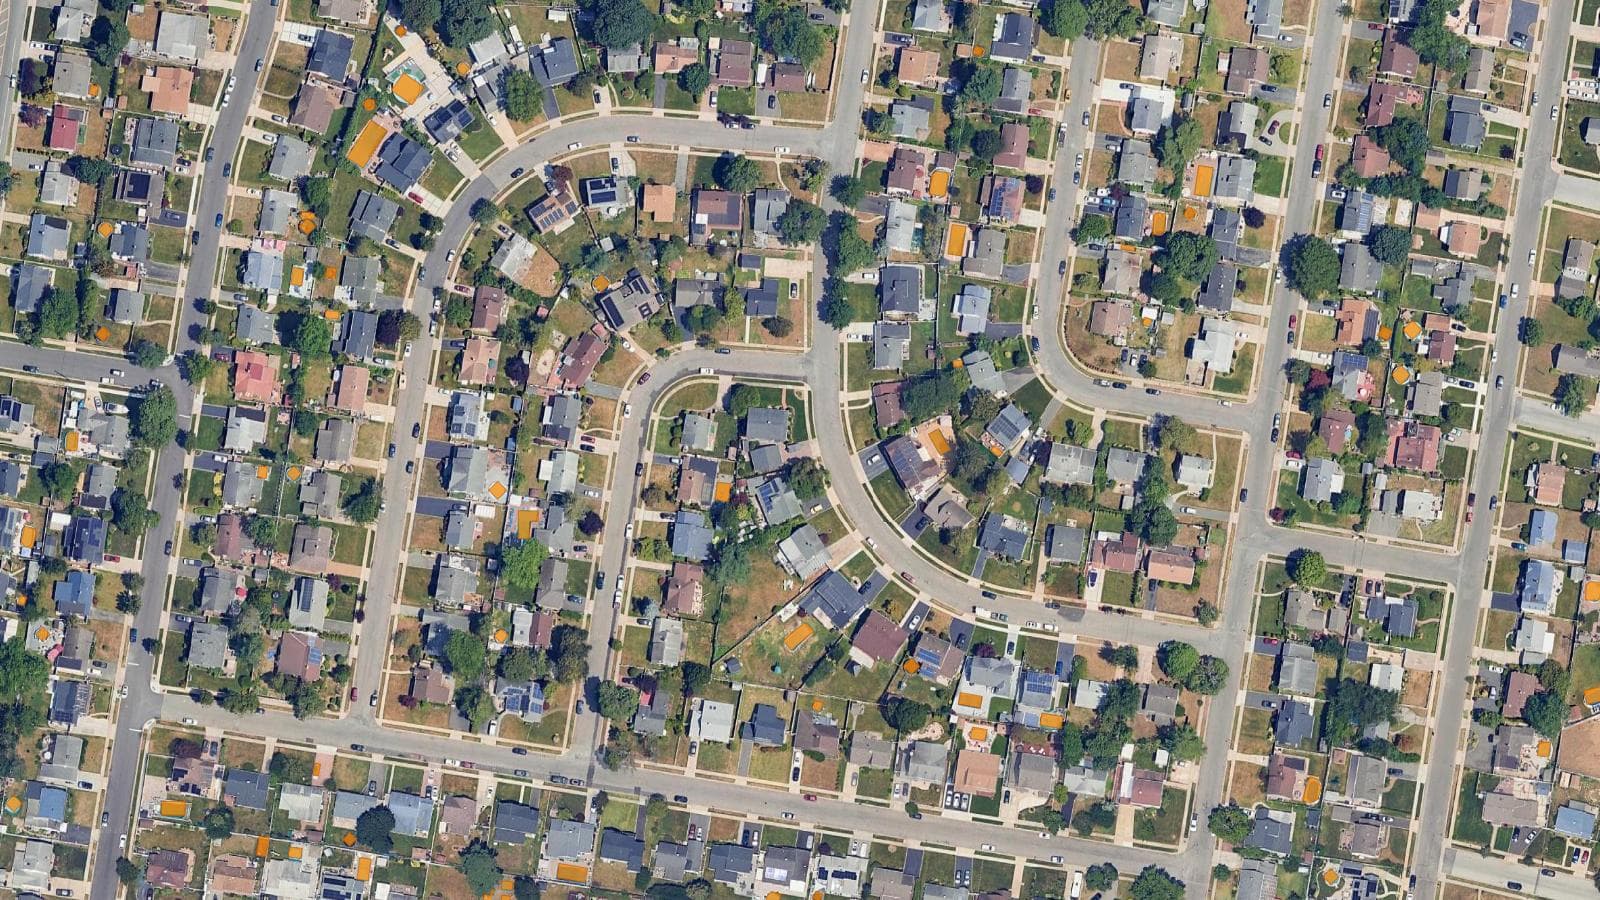
A segmentation model has learned what a roof, a pool or a tree looks like, so it outlines them for you. AI Segmentation is our QGIS plugin for this. Draw a zone over any imagery QGIS shows, type building, and every house comes back as its own polygon with an area and a confidence score.
People use it exactly this way. Between 15 August and 14 October 2026, 2,018 accounts outside our team exported 7,133 building runs. The model found 5.2 million candidates, and people kept 1.9 million of them, or 36.5%, after filtering by confidence and size. The median run kept 67 buildings.
The review is still yours. In 18.2% of those runs, people corrected at least one outline by hand before exporting. The plugin gives you the same QGIS vertex tools for that, plus a click-to-fix mode.
For a few exact objects, Semi-Auto mode outlines one object per click instead, and on your own computer it has no counter. Our complete guide to AI Segmentation shows both modes.
Best for: hundreds of similar objects on an aerial or satellite photo: roofs, pools, solar panels, trees, fields.
Not for: objects you cannot see in the image, like property lines or underground pipes.
Price: free each month for 1.5 km² (Automatic) and 20 objects (Semi-Auto), no card. Pro is €39 a month excluding VAT for 100 km² (Automatic) and 500 objects (Semi-Auto).
Runs on: our servers in Europe for Automatic, so it needs no graphics card.
Which method to pick
| Download | By hand | Scanned map | Polygonize | AI Segmentation | |
|---|---|---|---|---|---|
| Input | None | Any image | Paper map | Class raster | Any image |
| Speed for 100 objects | Minutes | Hours | Hours | Minutes | Minutes |
| Matches your imagery | Not always | Yes | Matches the scan | Yes | Yes |
| Cost | Free | Free | Free | Free | Free tier, then €39 |
What to remember
Download first. If your area is already mapped, you are done in minutes.
Digitize by hand with snapping on, and use the rectangle tool for plain buildings.
Georeference a scan before you trace it, or nothing lines up.
Polygonize only works on rasters whose pixels are already classes.
For hundreds of objects on a photo, let AI Segmentation draw them and spend your time on the review.
Questions people ask
What is digitizing in GIS?
Digitizing is turning features you see on a map, a scan or an aerial photo into vector data: points, lines and polygons with coordinates. Once digitized, you can measure areas and lengths, add attributes, and run analysis on them. In QGIS you digitize by editing a vector layer.
How do I digitize a polygon in QGIS?
Create or select a polygon layer, click Toggle Editing, then Add Polygon Feature (Ctrl+.). Left-click each corner and right-click to finish. Fill in the attributes and save the edits. Turn on snapping first so shared walls line up.
Can QGIS digitize automatically?
Core QGIS can convert a classified raster to polygons with Polygonize, but it cannot read objects from a photo. For that you need a plugin with a detection model. AI Segmentation outlines every building, pool or tree in a zone you draw, and it is free to start.
How do I digitize a scanned map in QGIS?
Georeference the scan first with Layer > Georeferencer…, using points you can find on both the scan and a reference map. Then create a vector layer and trace the features on top of the placed scan.