How to Add a Basemap in QGIS: XYZ, WMS, QuickMapServices
Published Updated
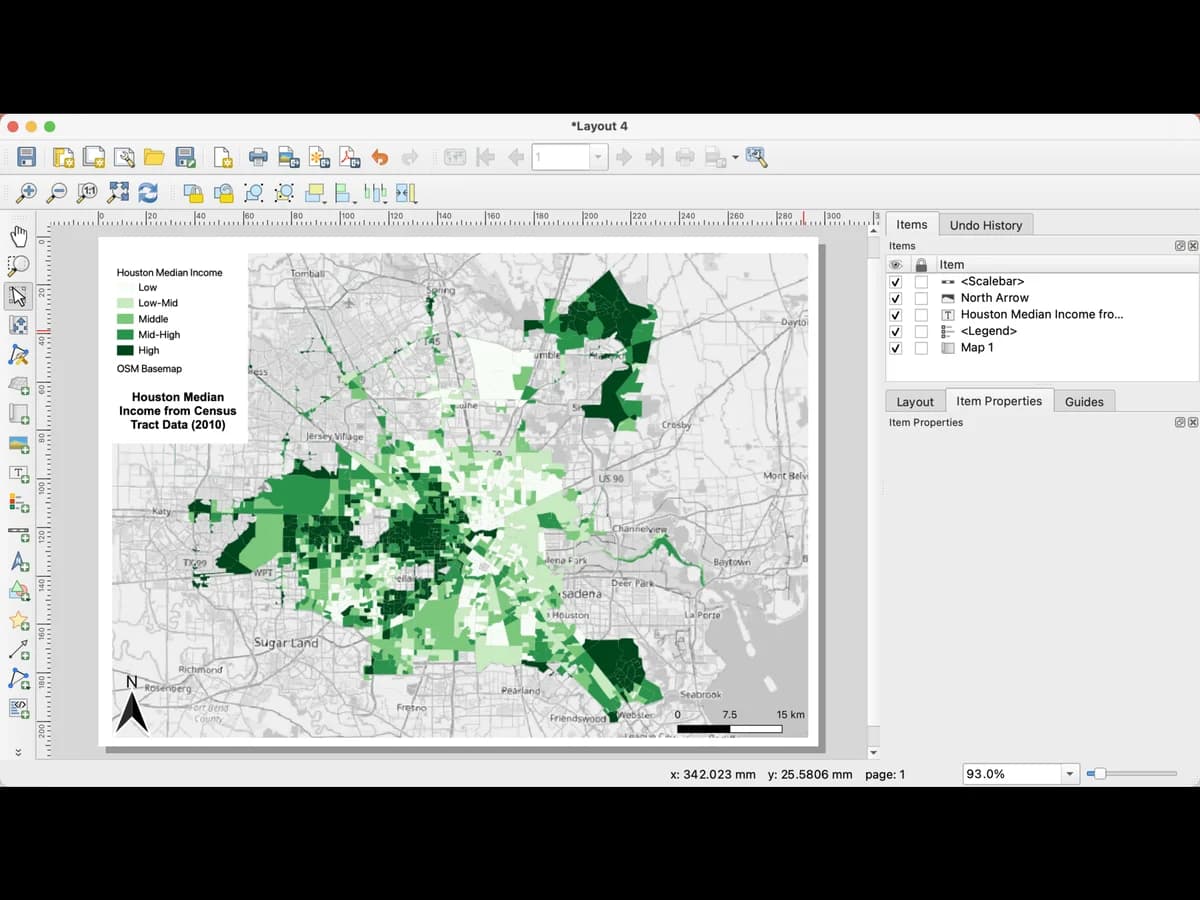
The fastest basemap in QGIS is already installed: open the Browser panel, expand XYZ Tiles, double-click OpenStreetMap. For satellite imagery, add an XYZ connection with a tile URL, several of which are below, or install the QuickMapServices plugin and pick from its list. For your national orthophoto, add a WMS or WMTS layer from your mapping agency. Or type the basemap you want in the AI Agent panel and it adds the layer for you.
This post gives the exact clicks for each, and ends with the question that matters if you want to run a detection model on the result: which basemap is sharp enough. Two tables measured on 7 September 2026 give the size of one pixel at each zoom level, and the last level where each service still has real imagery.
How to add a basemap in QGIS: the short answer
To add a basemap in QGIS, double-click OpenStreetMap under XYZ Tiles in the Browser panel. Every other base map below is a variation on that: a new tile URL, a plugin that fills the URL in, or a web service from your mapping agency. The menus are the same in the QGIS 3.44 long term release and in the current 4.2 release.
| You want | Do this | Time |
|---|---|---|
| A street map, now | Browser, XYZ Tiles, OpenStreetMap | 5 seconds |
| Any of these, without the menus | Type it in the AI Agent panel | One message |
| Satellite imagery | Browser, XYZ Tiles, New Connection, paste a URL from below | 1 minute |
| A list to pick from | Plugins, Manage and Install Plugins, QuickMapServices | 2 minutes |
| Your national orthophoto | Layer, Add Layer, Add WMS/WMTS Layer, the agency's URL | 2 minutes |
| A GeoTIFF or image you already have | Drag it from the Browser panel onto the map | 1 minute |
| Imagery a model can read | See the last section |
Method 1: the OpenStreetMap base map already in QGIS
Yes, QGIS has a base map built in. It ships with two XYZ connections in the Browser panel: OpenStreetMap, and Mapzen Global Terrain, which is an elevation source rather than a picture to look at.
Open the Browser panel
View, Panels, Browser, if it is not showing.Expand XYZ Tiles
OpenStreetMap is listed. Double-click it, or drag it onto the map.Check the CRS
Web tiles are drawn in Web Mercator, EPSG:3857. QGIS reprojects them on the fly to your project CRS, which is fine for a backdrop. If the tiles look blurred at high zoom, set the project CRS to EPSG:3857 while you work with them.The layer is live: every pan fetches new tiles from the server, and it needs an internet connection. That is true of every basemap on this page.
The built-in connection is plain XYZ: the URL is https://tile.openstreetmap.org/{z}/{x}/{y}.png, with zoom levels 0 to 19. That 19 matches the zoom table further down.
Method 2: ask for a basemap in one sentence
If you would rather not look for a URL, describe the basemap in plain words and let a tool add it.
We make AI Agent, a chat panel inside QGIS, so this method is our own tool. You type the basemap you want, and it finds the service, adds the layer and places it over any basemap already there and under your data.
 , so this method is our own tool. You type the basemap you want, and it finds the service, adds the layer and places it over any basemap already there and under your data.
Add the IGN orthophoto of this area under my parcels.
It knows the street maps (OpenStreetMap, OpenTopoMap, OpenFreeMap's light and dark styles, and our own vector basemap) and national orthophotos by name: IGN's BD ORTHO in France, SWISSIMAGE in Switzerland, PDOK's aerial photo in the Netherlands, PNOA in Spain, USGS and NAIP imagery in the United States, and the 20 cm orthophotos of several German states. If QuickMapServices is installed, it can also pick from that plugin's list.
Two limits. Its own worldwide satellite layer is a 2021 Sentinel-2 picture at 10 m that stops at zoom 14: a backdrop for a region, not for a house, so name your national orthophoto when you need detail. And it does not add Google or Esri tiles from its own list, because we withdrew both over their terms of use. The free plan covers a monthly allowance of messages.
Try it free in QGIS, no card needed
Method 3: add satellite basemaps to QGIS by URL
Any tile service whose address carries {z}, {x} and {y} placeholders can become a QGIS basemap in about a minute. Right-click XYZ Tiles in the Browser panel, New Connection, give it a name and paste the URL. Then set Max. Zoom Level to the last level the service really has, from the tables further down. QGIS then keeps the last real tile on screen when you zoom past it, instead of going blank. Leave the other fields as they are unless the provider asks for a Referer or a key.
OpenStreetMap, standard style. The built-in tiles, in a connection you control. OpenStreetMap's tile policy asks for visible credit ("© OpenStreetMap contributors"), forbids bulk downloading and prefetching, and promises no uptime. Use the HTTPS address.
https://tile.openstreetmap.org/{z}/{x}/{y}.png
USGS Imagery, United States. National open data. It is mostly NAIP aerial photography, 1 m pixels, taken in 2017 to 2021 for the lower 48 states, in Web Mercator. The service is visible down to a scale of 1:9,028, which is zoom 16: set that as the maximum. Credit: USDA, USGS The National Map: Orthoimagery.
https://basemap.nationalmap.gov/arcgis/rest/services/USGSImageryOnly/MapServer/tile/{z}/{y}/{x}
OpenTopoMap. A topographic style built from OpenStreetMap and SRTM elevation. CC-BY-SA, so free to use with its credit visible: "Map data: © OpenStreetMap contributors, SRTM | Map style: © OpenTopoMap (CC-BY-SA)".
https://a.tile.opentopomap.org/{z}/{x}/{y}.png
Esri World Imagery. Worldwide, usually the sharpest of the three outside big cities. Esri's terms tie it to Esri software or an ArcGIS Online subscription, and QGIS is not Esri software: without a subscription, treat it like Google and keep it on your screen.
https://server.arcgisonline.com/ArcGIS/rest/services/World_Imagery/MapServer/tile/{z}/{y}/{x}
Google Satellite. The URL works and every tutorial gives it. Google's terms of service do not permit use outside Google's own products and APIs, so for anything that leaves your screen, a report or a client deliverable, use your national imagery instead.
https://mt1.google.com/vt/lyrs=s&x={x}&y={y}&z={z}
OpenStreetMap, humanitarian style. A second street map, useful where the default style is dense.
https://tile.openstreetmap.fr/hot/{z}/{x}/{y}.png
Method 4: install QuickMapServices in QGIS for a list of basemaps
QuickMapServices, or QMS, is the plugin to install when you want a menu of basemaps for QGIS instead of a list of URLs. It is free, made by NextGIS, and fills in the tile address for you. It is the plugin most people mean when they say "add Google to QGIS".
Install QuickMapServices
Open the plugin manager
Plugins, Manage and Install Plugins, then the All tab.Search and install
Type QuickMapServices as one word, select NextGIS QuickMapServices, click Install Plugin.Find it
The plugin adds a QuickMapServices submenu to the Web menu, and buttons to the Web toolbar.The current release, 1.5.2 of 11 September 2026, needs QGIS 3.32 or later. On an older QGIS, the plugin manager offers the last version that supports it.
Get the full list of services: the contributed pack
Older tutorials say the menu shows only a handful of services until you add the "contributed pack". That was true before version 1.2.0 of March 2026. Since that version the contributed pack, the community list that holds Google, Bing and Esri layers, ships inside the plugin. There is no button to press.
If your menu still looks short, you are on an older version. Two fixes:
- Update the plugin: Plugins, Manage and Install Plugins, Upgradeable.
- Or, on the old version, open Web, QuickMapServices, Settings, go to the More services tab, read the notice and click Get contributed pack, then Save.
Since version 1.0.0 the settings live in the QGIS Options dialog, on a QuickMapServices page with three tabs: General, Add/Edit/Remove and Visibility. Visibility is where you hide the groups you never use, so the menu stays short. General has one option worth knowing: "Enable EPSG:3857 (OTF) on adding TMS", which sets Web Mercator when you add a tile layer and keeps tiles sharp.
Add a basemap from the menu
Web, QuickMapServices, then the group, then the layer. It is added to the project as a raster layer. Drag it under your data in the Layers panel if it lands on top. On 27 September 2026 the contributed pack held 65 services in these groups:
| Group | Layers you will use most |
|---|---|
| Satellite, Hybrid, Road, Terrain | |
| Bing | Satellite, Map |
| Esri | Satellite, Topo, Terrain, Ocean, Gray light and dark, National Geographic, plus a group of vector styles |
| OpenStreetMap | OSM Standard, OpenTopoMap, Wikimedia Map, Waymarked Trails for hiking and cycling |
| OpenFreeMap and VersaTiles | Free vector street maps in several styles |
| National and other | basemap.at for Austria, with its orthophoto; Waze, Yandex and AutoNavi |
CartoDB and Stamen styles appear in many old tutorials. They are not in the current pack. Version 1.5.1 also removed every service that needs an API key.
Search for any other service
The menu is the short list. The search panel reaches the whole QMS catalog at qms.nextgis.com, hundreds of services added by users.
Open the search panel
Web, QuickMapServices, Search NextGIS QMS, or its button on the Web toolbar. A search panel opens.Type a name or a place
Try "orthophoto", "satellite", a country or an agency name.Add it
Double-click a result, or select it and click Add.Narrow to your area
Click Filter by extent to keep only services that cover the area on your map. Not every service in the catalog has an extent set, so turn the filter off if you miss one.Save a service you reuse to your favourites from its result in the panel. The panel also keeps your recently used services. QMS adds XYZ and TMS tiles, WMS, WFS, GeoJSON and vector tiles, so the search can also return data layers, not only basemaps.
Licences: what QuickMapServices does not change
QuickMapServices does the same thing as method 3 with the URLs filled in for you. It does not give you a licence to any of them. The terms of each provider still apply, and NextGIS's own documentation tells you to read them before you make anything from a basemap.
- Google layers. The QMS entry for Google Satellite points to Google's Maps terms. Those terms do not permit use outside Google's own products and APIs. Keep them on your screen.
- Bing layers. The QMS entries for Bing carry no licence information at all. That does not mean there is no licence: Microsoft's terms apply, so treat Bing like Google.
- Esri layers. Tied to Esri software or an ArcGIS Online subscription, as in method 3.
- OpenStreetMap. Free to use in a map you publish, with the credit "© OpenStreetMap contributors".
For a deliverable that leaves your desk, use OpenStreetMap or your national orthophoto, below.
Method 5: add your national orthophoto as a QGIS base map by WMS or WMTS
For professional imagery, add your mapping agency's WMS or WMTS service. National mapping agencies publish their orthophotos as web services, sharper and more recent than the global tiles, and licensed for professional use.
Find the service URL
In France, the IGN orthophoto is a WMTS on cartes.gouv.fr, free without a key since 2024. In the United States, the USGS National Map serves NAIP imagery as WMS. In Britain, Ordnance Survey imagery needs an API key from the OS Data Hub. Most other agencies have a "web services" page with the URL on it.Add the connection
Layer, Add Layer, Add WMS/WMTS Layer, New, paste the URL, Connect. The list of layers the service offers appears.Pick the orthophoto layer
Select it, Add. For a WMTS, pick the tile matrix set that matches your project CRS when the service offers several.Method 6: use a GeoTIFF or image you already have as a basemap
A basemap does not have to come from a server. Drag a GeoTIFF from the Browser panel onto the map and move it under your data in the Layers panel.
A plain JPEG or TIFF with no location inside needs a world file before QGIS can place it:
- Same name as the image, in the same folder, with the extension
.tfwfor a TIFF (not.twf). - Six lines, one number each: pixel size in X, rotation, rotation, the pixel size in Y with a minus sign, then the X and Y coordinates of the centre of the upper-left pixel.
Set the layer CRS to the system those coordinates are in.
How far each QGIS basemap zooms
A tiled basemap has a limit: the zoom level past which the provider has no imagery. Two tables tell you where you stand.
First, the size of one pixel at each level. This is arithmetic, not an estimate: a 256-pixel Web Mercator tile at level z covers 156,543.03 × cos(latitude) / 2^z metres per pixel.
| Zoom level | At the equator | At the latitude of Paris |
|---|---|---|
| 16 | 2.39 m | 1.57 m |
| 17 | 1.19 m | 79 cm |
| 18 | 60 cm | 39 cm |
| 19 | 30 cm | 20 cm |
| 20 | 15 cm | 10 cm |
| 21 | 7.5 cm | 4.9 cm |
Second, the real limit of each service. On 7 September 2026 we requested one tile per level, from 16 to 22, in nine places, and looked at where the server stops returning a real image.
| Service | Last level with real imagery | Past it |
|---|---|---|
| Google Satellite | 22 in all eight cities tested, 21 in rural Cantal | 404 error |
| Esri World Imagery | 19 in Paris, Chartres, London, São Paulo, Nairobi and rural Kansas, 20 in New York and Berlin | a grey square returned with a 200 code |
| IGN orthophoto by WMTS | 19 | 404 error |
| OpenStreetMap | 19 | 400 error |
The Esri line deserves a word, because it explains more "my basemap is blurry" than anything else. Past its last level, Esri does not return an error: it returns a 200 code and a 2,521-byte image, a grey square carrying the words "Map data not yet available". QGIS takes it as a valid tile and draws it. Nothing tells you the service has run out. IGN and OpenStreetMap return a plain error instead, and QGIS then keeps the last sharp tile.
One caveat on the first column: a tile served at level 22 does not prove the imagery was captured at 2.5 cm, only that the server answers. We measured how far each service agrees to go, not the native resolution of its imagery.
Which basemap a detection model can read
A detection model needs a recent photographic basemap with small pixels, usually your national orthophoto, never a street map. This is the question behind the question, for anyone who adds a basemap to run AI Segmentation, the plugin we make at TerraLab for QGIS, or any other detection tool on it. A model reads the pixels you show it, and a basemap has three properties that decide what it can find.
Ground pixel size. The first table above gives it at every level. At zoom 18 at the latitude of Paris, one pixel covers 39 cm. At zoom 19, 20 cm. A house is hundreds of pixels at either, a tree crown is dozens, a car is a few. The resolution scale on the AI Segmentation guide says what the model finds at each size. The national orthophoto at 20 cm is better than any global tile for small objects.
Date and consistency. Global tiles stitch imagery of different dates at tile edges. A detection run across a seam sees summer on one side and winter on the other, and trees on one side that are bare on the other. A national orthophoto is flown in one campaign.
What is drawn on it. A street map basemap has no pixels a model can use. Labels, roads and building outlines are drawn, not photographed, and a model trained on imagery returns nothing useful on them. The plugin needs an imagery layer visible on the canvas, and it says so when there is none.
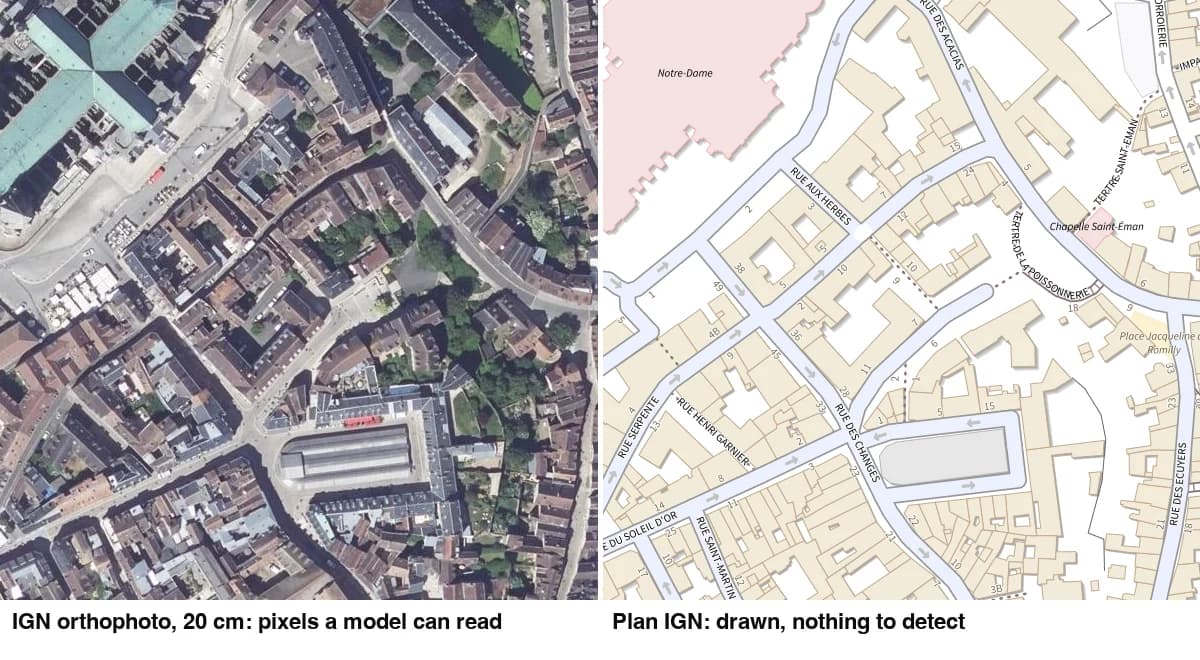
Run the detection on the sharpest, most recent imagery you can load. For most of Europe and North America that is the national orthophoto by WMS. The building footprint guide runs the same block on two basemaps and shows the difference in the count.
Questions people ask
Why is my basemap blurry?
Three causes. You are zoomed past the last level the service actually has, which happens with Esri past zoom 19 in most of the world, and it does not tell you: it returns a grey square with a 200 code. The project CRS is not EPSG:3857 and QGIS is resampling the tiles. Or the connection has a maximum zoom set lower than the service. Check the level table above, then the project CRS, then the connection.
Can I use Google Satellite in QGIS legally?
You can load it. Google's terms do not allow use of its imagery outside its own products, so a map made from it should not leave your screen. Esri World Imagery is the same case unless you hold an ArcGIS Online subscription, because Esri's terms tie it to Esri software. OpenStreetMap and most national services allow use with attribution. Read the one you use.
Is there a free source for basemaps in QGIS?
Yes. OpenStreetMap is built in and free with credit, OpenTopoMap is free under CC-BY-SA, and national agencies such as the USGS and IGN publish orthophotos as open data. Free to load is not always free to publish: use the credit line each provider asks for.
What is the difference between a map and a basemap?
A basemap is the reference layer under your data: streets, terrain or aerial photography that shows where things are. The map is the whole result, basemap plus your layers on top.
Does adding a basemap work the same way in QGIS 4?
Yes. The Browser panel route is documented the same way for the 3.44 LTR and the latest release. On 25 September 2026 QGIS 4.2.3 was the current release and 3.44.15 the long term one; 3.44 was the last 3.x feature release. A plugin can lag behind, so check that its page lists your QGIS version before you install it.
Can I add a basemap offline?
Not a live one. Download the extent you need as a GeoTIFF from your national agency, or use Raster, Miscellaneous, Build Virtual Raster on downloaded tiles, and load that. QGIS's Generate XYZ tiles algorithms go the other way, from your layers to a tile folder.
How do I set a default basemap for every new project?
Save a project with the basemap loaded as your project template: Settings, Options, General, Project files, Template folder, and put the project there. Or set the connection once in the Browser and drag it in each time. There is no global default.
Which basemap is best for AI Segmentation?
The sharpest and most recent imagery you can see on the canvas: your national orthophoto by WMS or WMTS, or Esri World Imagery if your ArcGIS licence covers it. Never a street map. The plugin reads what is visible, so zoom in until the objects you want are clear before you draw the zone.
The QGIS AI hub collects what AI can and cannot do inside QGIS. Once the basemap is on, the raster to vector post is the next step for turning what you see into polygons.