Map Tree Canopy in QGIS: 6 Methods, Free and Paid
Published Updated
To map tree canopy in QGIS from multispectral imagery, build NDVI in Raster > Raster Calculator…, cut it at a threshold with Reclassify by table, then run Raster > Conversion > Polygonize (raster to vector). That gives you cover, not single trees. Five other methods cover LiDAR, open data, and the case where you need one polygon per crown.
 from multispectral imagery, build NDVI in
 | What you have | Method | What it costs |
|---|---|---|
| Multispectral imagery with a near-infrared band | Method 1, NDVI then polygonize | Free, core QGIS |
| RGB imagery, no card, and you want crowns | Method 2, a cloud segmentation model | Free tier, then a subscription |
| LiDAR, or a DSM and a DTM | Method 3, canopy height model | Free, core QGIS |
| Imagery and several classes to separate | Method 4, supervised classification | Free, one plugin |
| A wide area, and last year's date is fine | Method 5, an open canopy dataset | Free download |
| RGB imagery and an NVIDIA card | Method 6, a local segmentation model | Free, and a model to find |
Decide whether you need cover or crowns. Cover is one surface and a percentage falls out of it. Crowns are countable objects, which is what a street survey or a park inventory needs.
Menu paths, algorithm ids, plugin versions and prices here were read on 3 September 2026 against the QGIS 3.44 manual and each project's own page.
Method 1: NDVI threshold
Work in a projected CRS. Every method here ends in an area, and an area in degrees is worth nothing.
NDVI separates green vegetation from roofs, roads and water. Open Raster > Raster Calculator… and enter ("nir@1" - "red@1") / ("nir@1" + "red@1").

Then run Reclassify by table (native:reclassifybytable, Processing Toolbox, Raster analysis), one row above the threshold and one below, with the output data type set to Byte. Polygonize the result.
Use it when: the imagery carries a near-infrared band and you want cover.
Skip it when: trees have to be told apart from lawn or crops. NDVI cannot do it, because all three are green.
Method 2: A cloud segmentation model
A segmentation model has learned what a crown looks like, so it splits a stand into countable objects where a threshold returns one blanket. We build one of these, AI Segmentation (complete guide). This section is about our own tool.
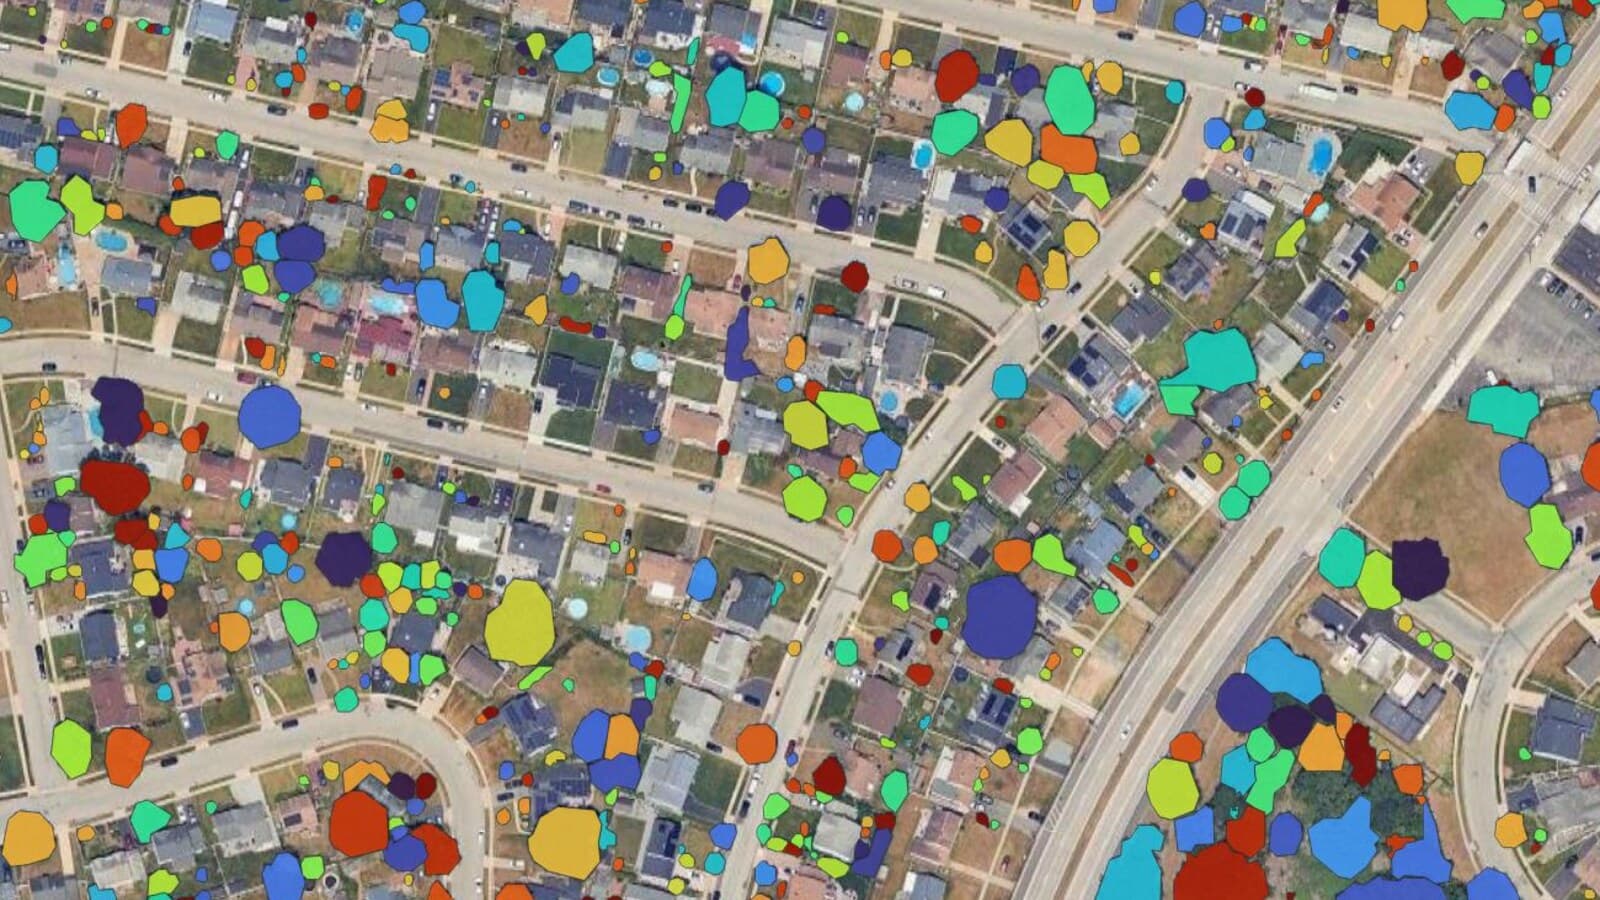
Draw a zone over the imagery already open in QGIS and type a word. The polygons land in your project CRS with an area and a confidence score on each. Type tree for one polygon per crown, tree canopy for the cover as a surface.

Best for: one polygon per crown over RGB imagery, on a machine with no GPU.
Price: free for 1.5 km² of ground a month plus 20 cloud Semi-Auto objects, no card. Pro is €39 a month excluding VAT for 100 km² and 500 objects. Try Pro free for 7 days: add a card, cancel before the end and nothing is charged.
Runs on: QGIS 3.22 and later, Windows, macOS or Linux. The model runs on our servers in the European Union.
Install: plugin manager, then an email to sign in. No packages, no weights.
Where it wins: the plain word measures well. Over 90 days of real runs tree came back empty on 10.5 percent of tiles, against 47.3 percent for orchard over 716 tiles, so the plugin nudges the second word to the first before you spend anything.
Where it falls short: a closed stand has no crown edges to find, so a tree run returns one blanket rather than a polygon per stem. Use tree canopy there and accept cover. Both cloud modes send imagery to our servers, and only Semi-Auto on your own machine does not.
Method 3: Canopy height model from LiDAR
Height is the one signal that does separate a tree from a lawn, and QGIS builds both surfaces straight from a LAS or LAZ file with Export to raster (pdal:exportraster, Point Cloud Conversion). Set Attribute to Z. For the terrain, add the filter expression Classification == 2, which is Ground in the ASPRS classes QGIS uses. For the surface, filter on ReturnNumber == 1.

Subtract one from the other in Raster > Raster Calculator… with "dsm@1" - "dtm@1", or in grass:r.mapcalc.simple on larger tiles. Reclassify at the height your specification calls canopy, then polygonize. The output carries a height per pixel, which nothing else on this page gives you.
Use it when: you have LiDAR, or a national DSM and DTM pair.
Skip it when: your points are not classified. QGIS 3.44 has no ground classification algorithm, so unclassified points go through PDAL outside QGIS first.
Method 4: Supervised classification
Draw training polygons for tree, grass, roof and road, then let a classifier label every pixel and polygonize the tree class. dzetsaka is the one I would install today. It is GPL, version 5.0.11, runs on QGIS 3.0 through 4.99, and ships eleven classifiers including Random Forest and SVM.
The Semi-Automatic Classification Plugin is better known and handles band sets and preprocessing too, but check the version first. Release 9.0.4 needs QGIS 3.99, the QGIS 4 line. On QGIS 3.44 you get 8.5.0, from November 2024.
Use it when: canopy is one class among several you need from the same scene.
Skip it when: trees are all you want. Training samples cost more time than Method 1.
Method 5: An open canopy dataset
Someone may have mapped your area already.

Four worth knowing. The Meta and WRI canopy height map is global, version 2 since March 2026, 1.2 m pixels and a mean absolute error of 3.0 m against airborne LiDAR. ETH Zurich's map is 10 m for 2020, from Sentinel-2 and GEDI, CC BY 4.0.
The other two are regional or historical. The Copernicus Tree Cover Density layer covers Europe at 10 m, yearly from 2018 to 2024, and downloading it needs an EU Login. Hansen Global Forest Change is 30 m and starts in 2000, so it is the one for change over time.
Cities publish their own. Paris serves 219,432 trees as points, Melbourne 57,980 canopy polygons for 2021, both as a GeoJSON URL you paste into QGIS.
All four global rasters answer range requests, so stream a tile with /vsicurl/ rather than download it. Copernicus serves WMTS at https://land.copernicus.eu/en/products/high-resolution-layer-forests-and-tree-cover/tree-cover-density-2018-present-raster-10-m-europe-yearly, where you set the year by hand. It advertises every date back to 1984 and almost none hold data.
Use it when: the area is wide and the acquisition date does not have to be yours.
Skip it when: you flew the site last month, or you need crowns. Most of these are percentage rasters, not countable objects.
Method 6: A local segmentation model
Deepness, Geo-SAM and samgeo run segmentation models on your own machine. Nothing leaves it and nothing is billed.
Use it when: the imagery cannot leave your machine.
Skip it when: you have no NVIDIA card, or no appetite for finding a model, requesting weights and building a Python environment.
The six methods side by side
| What you need | Method |
|---|---|
| Cover from your own multispectral imagery | Method 1 |
| Crowns, on RGB imagery, without a GPU | Method 2 |
| Canopy height, or trees separated from grass | Method 3 |
| Canopy as one class among several | Method 4 |
| A wide area, quickly, for nothing | Method 5 |
| Crowns, with nothing leaving the machine | Method 6 |
What to remember
Decide between cover and crowns before you pick a method, because that is a question about your deliverable and not about your imagery.
Height beats colour whenever you can get it, so a LiDAR canopy height model wins wherever LiDAR exists.
NDVI reads a lawn, a crop and an oak as the same thing, so a threshold alone never gives you trees.
A closed stand has no crown edges to find, so every method on this page returns cover there and none returns a stem count.
For a Europe-wide cover percentage the Copernicus layer is free and already finished, so running a model over that area pays twice for the same answer.
Try it free in QGIS, no card needed
Questions people ask
Can QGIS map tree canopy without a plugin?
Yes, through Methods 1, 3 and 5, which are core QGIS plus a download. What you get is cover as polygons, never individual crowns.
One polygon per tree, or one for the whole canopy?
Thresholding NDVI or a height model gives you cover. Only a segmentation model splits a stand into countable crowns, and in Method 2 the word you type decides which of the two you get.
How do I get a canopy cover percentage?
Every polygon carries its own area, so sum the area column and divide by the area you measured. That is one field calculation, on geometry you can open and check.
Which is more accurate, NDVI or a LiDAR height model?
The height model, and it is not close. NDVI reads a lawn and an oak as the same thing, while a canopy height model separates them by several metres.
Is any of this free?
Methods 1 and 3 to 6 cost nothing beyond your own data, and a graphics card for Method 6. Method 2 gives 1.5 km² a month free, then €39 a month excluding VAT.
Can I build a canopy height model straight from the LAS file?
The ground surface comes from the points classified as ground, and QGIS 3.44 has no algorithm that classifies them. On an unclassified cloud the filter returns nothing and the terrain comes out flat.
Which version of the Semi-Automatic Classification Plugin do I get?
Release 9.0.4 needs QGIS 3.99, the QGIS 4 line. On QGIS 3.44 the manager serves you 8.5.0 from November 2024, so check which one you actually got before you blame your samples.
The raster to vector guide walks through the polygonize and cleanup steps every method here ends with, and the SAM in QGIS post compares the plugins that run segmentation models. For chaining Method 2's height-model steps into one instruction instead of repeating them tile by tile, AI Agent runs them inside your open project. The QGIS AI hub sits above both.