LiDAR HD from IGN: download and open in QGIS
Published
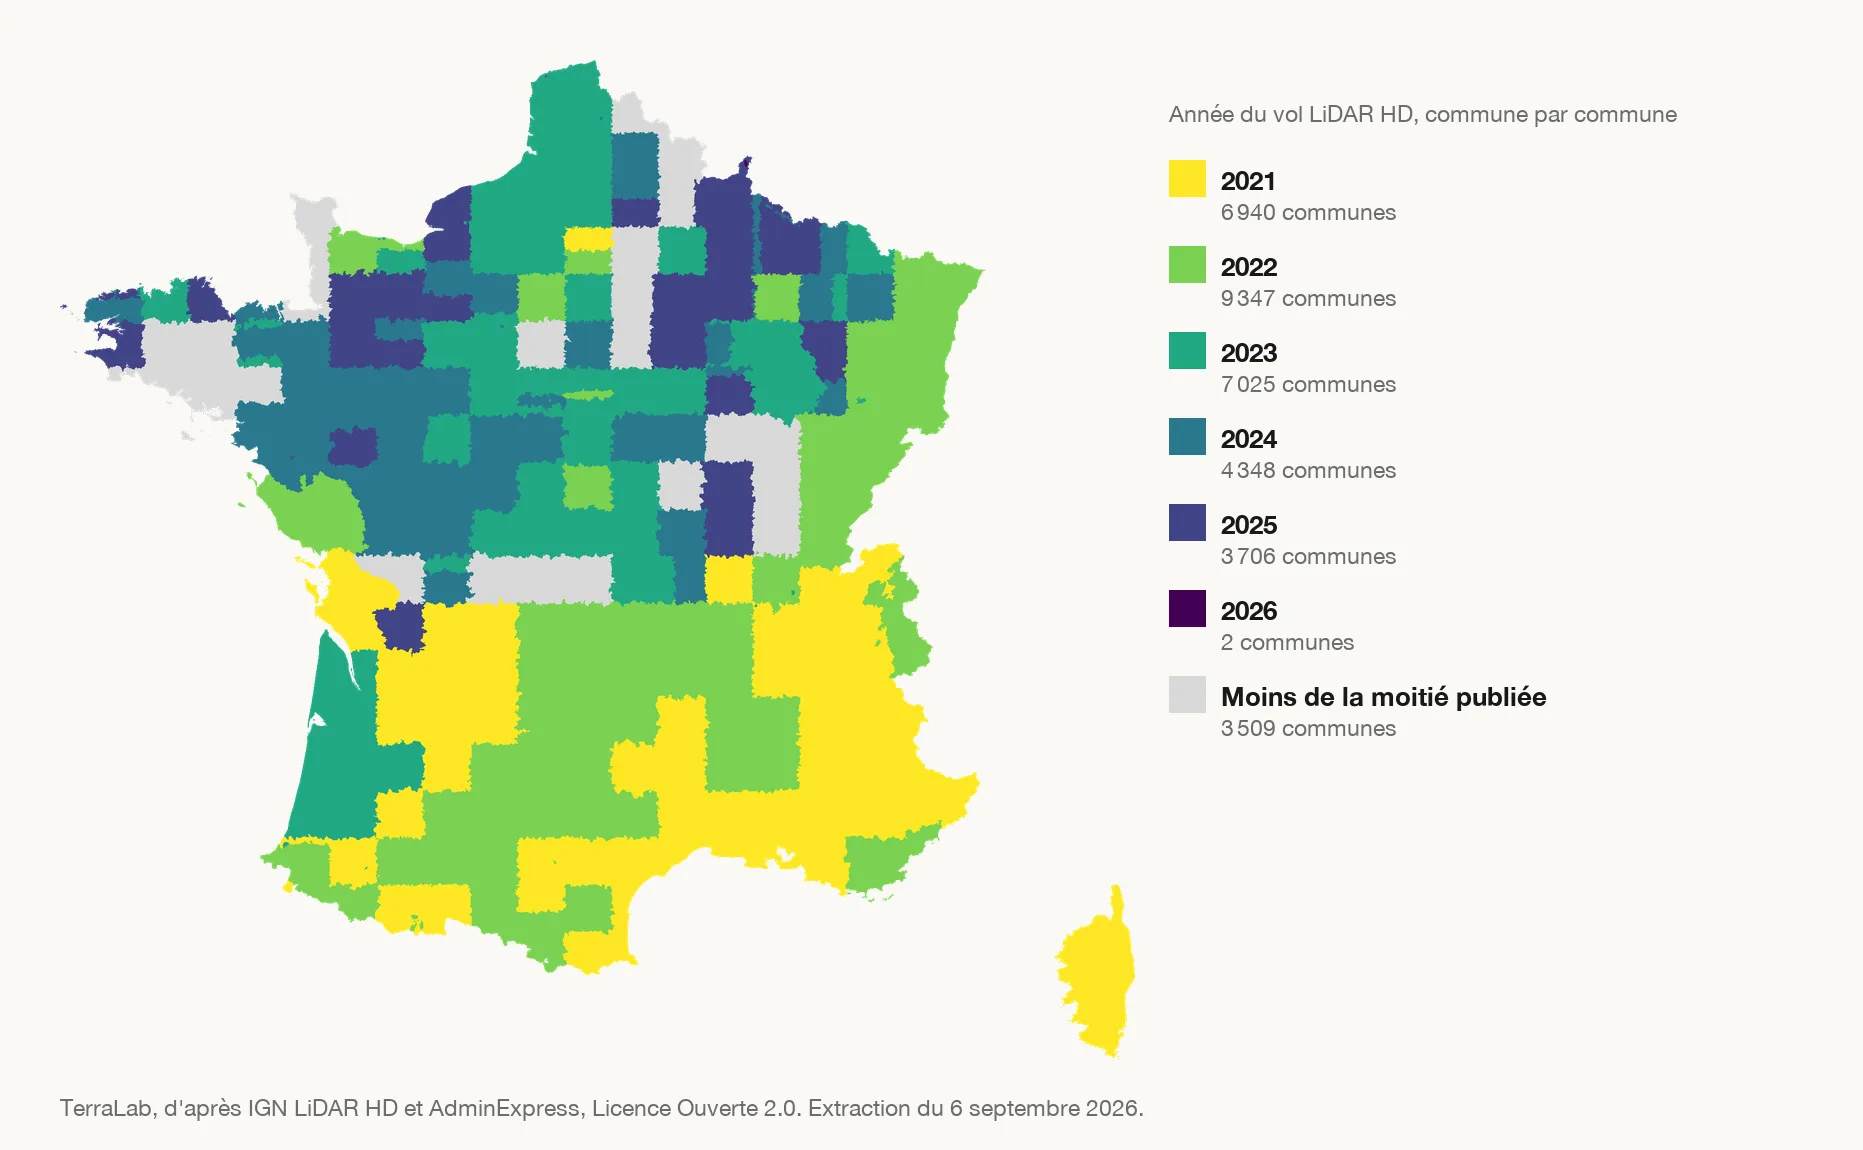
LiDAR HD is the airborne point cloud IGN has been surveying over the whole of France since 2021, at 10 points per square metre or more, released free per one-kilometre tile as a classified cloud, DTM, DSM and height model. On 6 September 2026, 507,791 tiles were published, covering 78.4% of the communal area and 30,933 of 34,877 communes in full; 3,054 communes have nothing yet. This article gives the state per year and per département, then the four ways to download the tiles and the clicks to open them in QGIS.
Where does the LiDAR HD programme stand?
The classified cloud is published over 78.4% of the communal area, and 30,933 of 34,877 communes are covered in full.
| What you are looking for | France, 6 September 2026 |
|---|---|
| Published one-kilometre tiles | 507,791 |
| Communal area with a published cloud | 78.4% |
| Communes covered at 99% or more | 30,933 of 34,877 |
| Communes with no tile at all | 3,054 |
| Residents in a covered commune | 60,241,094 |
| First and last published flight day | 13 April 2021, 19 January 2026 |
| Latest tile edition | 7 July 2026 |
| Flight year | Share of the covered area |
|---|---|
| 2021 | 24.9% |
| 2022 | 28.2% |
| 2023 | 20.8% |
| 2024 | 15.9% |
| 2025 | 10.2% |
The figures come from the IGN LiDAR HD map per commune dataset we publish on data.gouv.fr. It crosses the tile metadata, one row per published square kilometre with its flight dates, with the AdminExpress outlines. IGN publishes a progress map per fifty-kilometre block, with a status; it gives neither the flight date nor the answer for one commune. This dataset does.
IGN describes the programme as "sequenced over six years" with a "target of 10 points per square metre on average" (LiDAR HD programme, ign.fr, 28 February 2025, in French).
What is the state per département?
Nine départements have their own article, with the commune map, the flight dates of the main cities and the list of what is missing.
| Département | Area covered | Full communes | No tile | Dominant year |
|---|---|---|---|---|
| Nord | 46.1% | 267 of 647 | 342 | 2023 |
| Paris | 100% | 1 of 1 | 0 | 2023 |
| Bouches-du-Rhône | 99.9% | 117 of 119 | 0 | 2021 |
| Rhône | 100% | 266 of 266 | 0 | 2021 |
| Gironde | 99.6% | 530 of 534 | 0 | 2023 |
| Loire-Atlantique | 100% | 207 of 207 | 0 | 2024 |
| Haute-Garonne | 100% | 586 of 586 | 0 | 2022 |
| Seine-et-Marne | 40.7% | 192 of 507 | 261 | 2024 |
| Finistère | 67.8% | 193 of 277 | 55 | 2025 |
Two readings. The Rhône and the Bouches-du-Rhône are 100% covered but by a 2021 flight, five years old. The Nord and Seine-et-Marne are less than half covered, and the holes are the cities: Lille, Roubaix, Tourcoing, Meaux have no published tile.
How do you download the tiles?
Tiles are one kilometre square. Each exists as four products: the classified point cloud as COPC LAZ, and three 50 cm GeoTIFF rasters derived from it, the DTM (bare ground), the DSM (the top of everything) and the height model, the difference of the two. In metropolitan France everything is in Lambert-93, EPSG:2154, IGN69 heights. Four ways in, from the fastest to the most manual.
Method 1: the PointCloudFR plugin
Install the plugin
Plugins, Manage and Install Plugins, search PointCloudFR, Install. Version 2.3.1 of 10 September 2026, by Samy Khelil, QGIS 3.34 or newer.Draw the area
Create a polygon layer over the area you need in France, or load the commune from AdminExpress.Run the download
Processing Toolbox, PointCloudFR, pick the extent layer, the product (cloud, DTM, DSM or height model) and the output folder. The plugin downloads every tile that crosses the extent.Method 2: ask AI Agent in QGIS
AI Agent, the QGIS plugin we build at TerraLab, is a chat panel: you type a sentence and it adds the layers to your project. It does not save tiles to a folder. It loads the LiDAR HD ground model or relief, and it opens a tile of the cloud when you give it the address.
Ask for the ground model
Type for example "Load the 1 m LiDAR HD ground model over the Croix-Rousse in Lyon, with a hillshade." In five départements, Paris, the Rhône, Haute-Garonne, the Bouches-du-Rhône and Gironde, the agent takes the DTM at 1 m from a copy TerraLab hosts, one file per département, and reads only the part it needs, not the whole file. Elsewhere it adds IGN's 50 cm LiDAR HD hillshade, a picture drawn where the cloud is published, with no elevation values, and takes heights from RGE ALTI at 5 m.Open a tile of the cloud
Paste theurl_npl address of a tile, from the WFS layer of method 3, in the chat. The agent opens the .copc.laz as a point cloud layer, read in place from the Géoplateforme, without saving the file.It works at 1 m, not the 50 cm of the IGN tiles, and it does not load the DSM or the height model. For those, or for files on disk, use method 1.
Method 3: the tile layer over WFS
This is the source we read for this article, and it carries the download address of every tile.
Add the Géoplateforme WFS
Layer, Add Layer, Add WFS / OGC API - Features Layer, New, URLhttps://data.geopf.fr/wfs/ows, Connect.Load the metadata layer
FindIGNF_LIDAR-HD_METADONNEE:metadata in the list and add it. One feature per published tile, with its flight dates, mission, sensor and density.Read the addresses
Select the tiles you want, open the attribute table:url_npl is the LAZ cloud, url_mnt, url_mns and url_mnh are the three rasters. Paste the address in a browser or a script.Method 4: the cartes.gouv.fr catalogue
The LiDAR HD point clouds entry of the IGN catalogue offers a download by tile index. The older portal diffusion-lidarhd.ign.fr answered with a 503 error on 17 September 2026, go through cartes.gouv.fr.
How do you open the tiles in QGIS?
The point cloud
Layer, Add Layer, Add Point Cloud Layer, pick the.copc.laz files. QGIS 3.26 or newer reads COPC directly, no conversion. Colour by classification to separate ground, buildings and vegetation.The DTM or the DSM
Layer, Add Layer, Add Raster Layer. For several tiles, Raster, Miscellaneous, Build Virtual Raster stacks them without copying.A readable hillshade
Raster, Analysis, Hillshade on the DTM. This is the view that brings out the embankments, ditches and foundations the orthophoto hides.What does LiDAR not give you?
The cloud gives the shape of the ground and the height of what stands on it, on the day of the flight. Three things are missing.
- What the object is. An 8 metre height model cell is a roof or an oak, and the automatic classification separates ground, buildings and vegetation without telling a shed from a house.
- What changed since the flight. A quarter of the published area was flown in 2021; anything built since is not in it.
- The grey communes. 3,054 communes have no published tile yet.
For those three cases the orthophoto remains the current source, and that is what AI Segmentation, the plugin we build at TerraLab, extracts building footprints, roads or trees from, as polygons. The LiDAR HD height model then gives each of those polygons a height.
For the difference between the three rasters, read DSM vs DTM vs DEM. The rest of what we write about QGIS is on the QGIS and AI page.
Questions people ask
Is LiDAR HD free?
Yes. The classified cloud, the DTM, the DSM and the height model are under Licence Ouverte 2.0, usable commercially with an IGN credit. There is no key and no account to create to download a tile.
My commune is grey on the map, was it not flown?
Not necessarily. Grey means that less than half of the commune had a published classified cloud on 6 September 2026. IGN releases the cloud one to two years after the flight, so a block flown in 2025 can stay grey until 2027. The progress map per block on cartes.gouv.fr says whether the flight happened.
Which QGIS version opens the tiles?
QGIS reads the COPC format since version 3.26 and processes point clouds since 3.32. The PointCloudFR plugin asks for 3.34 or newer. The DTM, DSM and height model rasters are ordinary GeoTIFFs, any version opens them.