

Lilien Auger
Co-founder
Dev & AI Engineer
Work
Lilien co-founded TerraLab and codes on all of it: the three QGIS plugins, the AI models behind them, and the servers those models run on. He also answers the mail users send and takes the calls they book.
Background
42 Paris alumnus. He was an AI engineer at Publicis before TerraLab. His open-source work has passed 500 GitHub stars.
Elsewhere
Posts by Lilien Auger
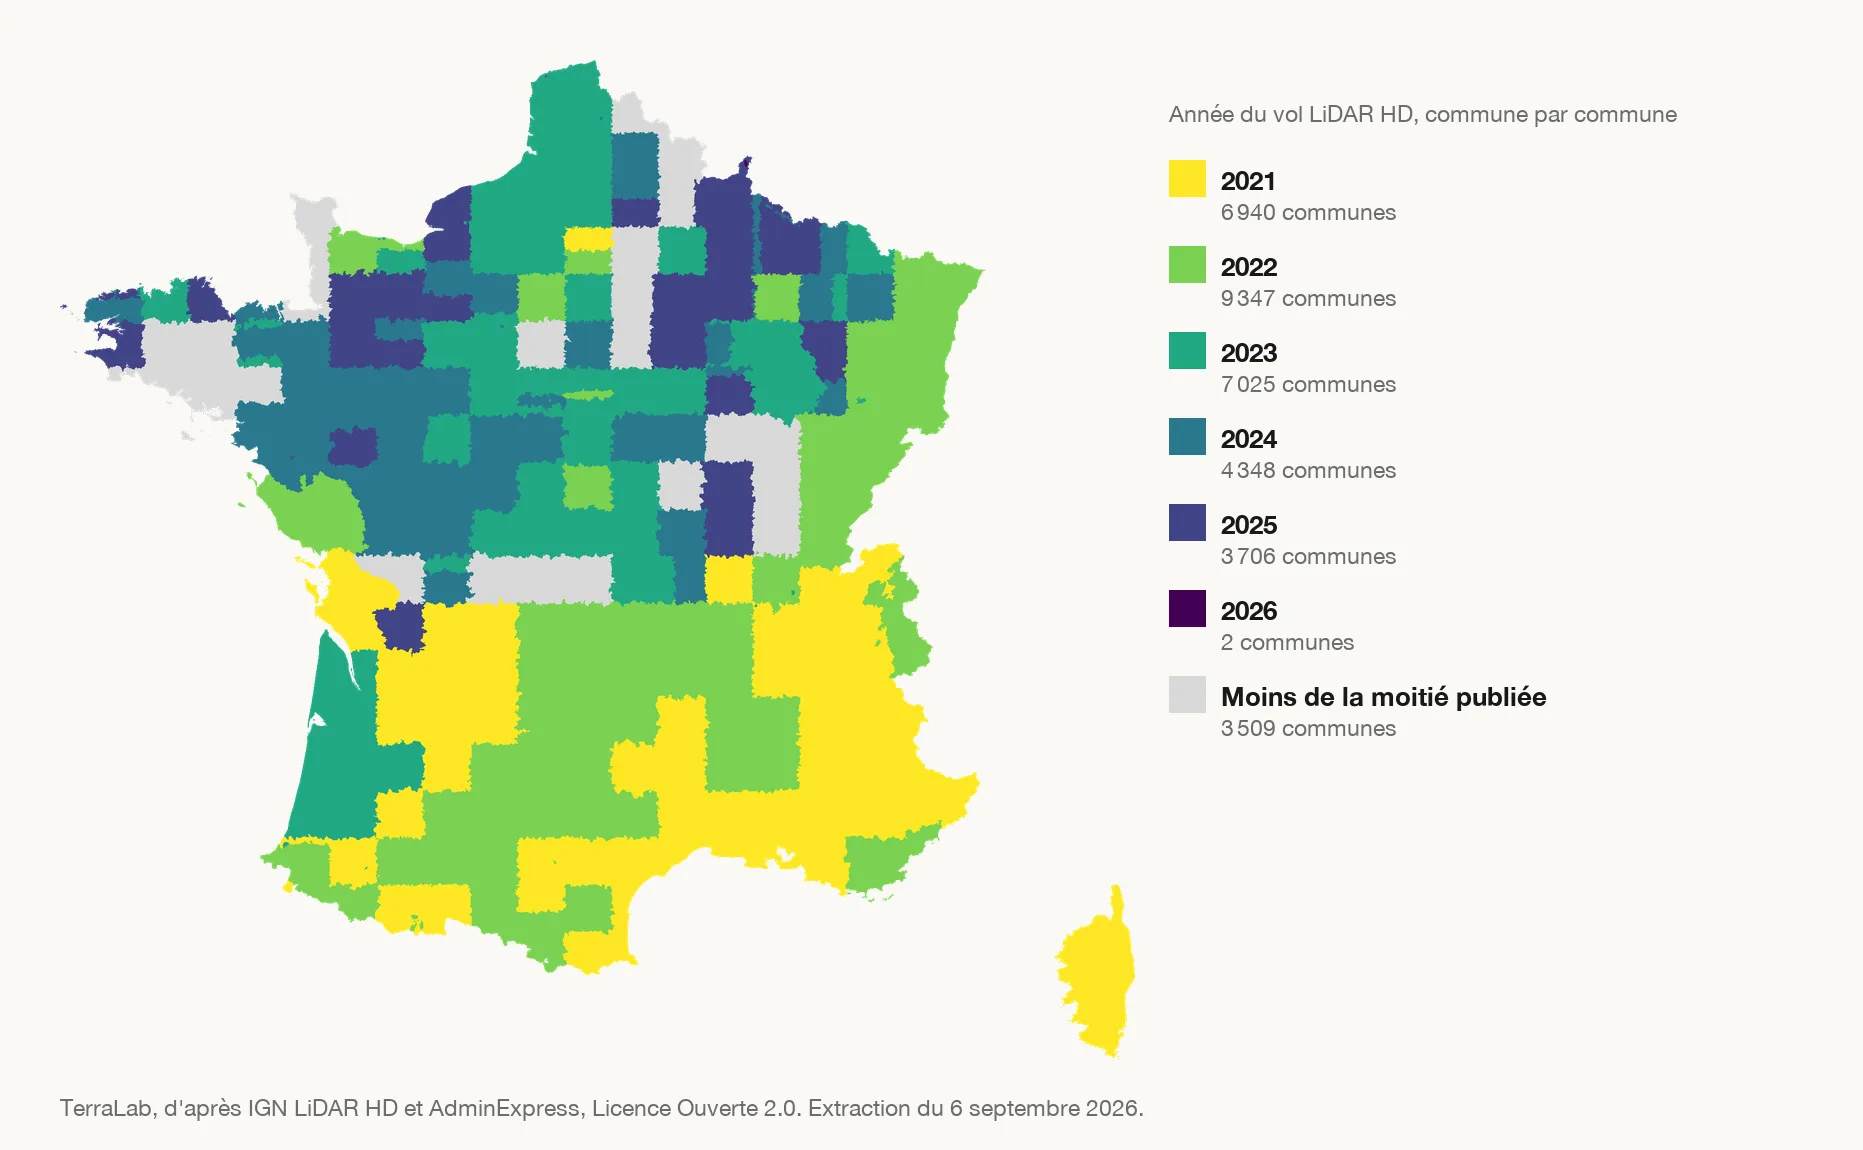
LiDAR HD from IGN: download and open in QGIS
The classified LiDAR HD cloud covered 78.4% of France on 6 September 2026, 30,933 of 34,877 communes. Map per commune, products, clicks in QGIS.
 Lilien Auger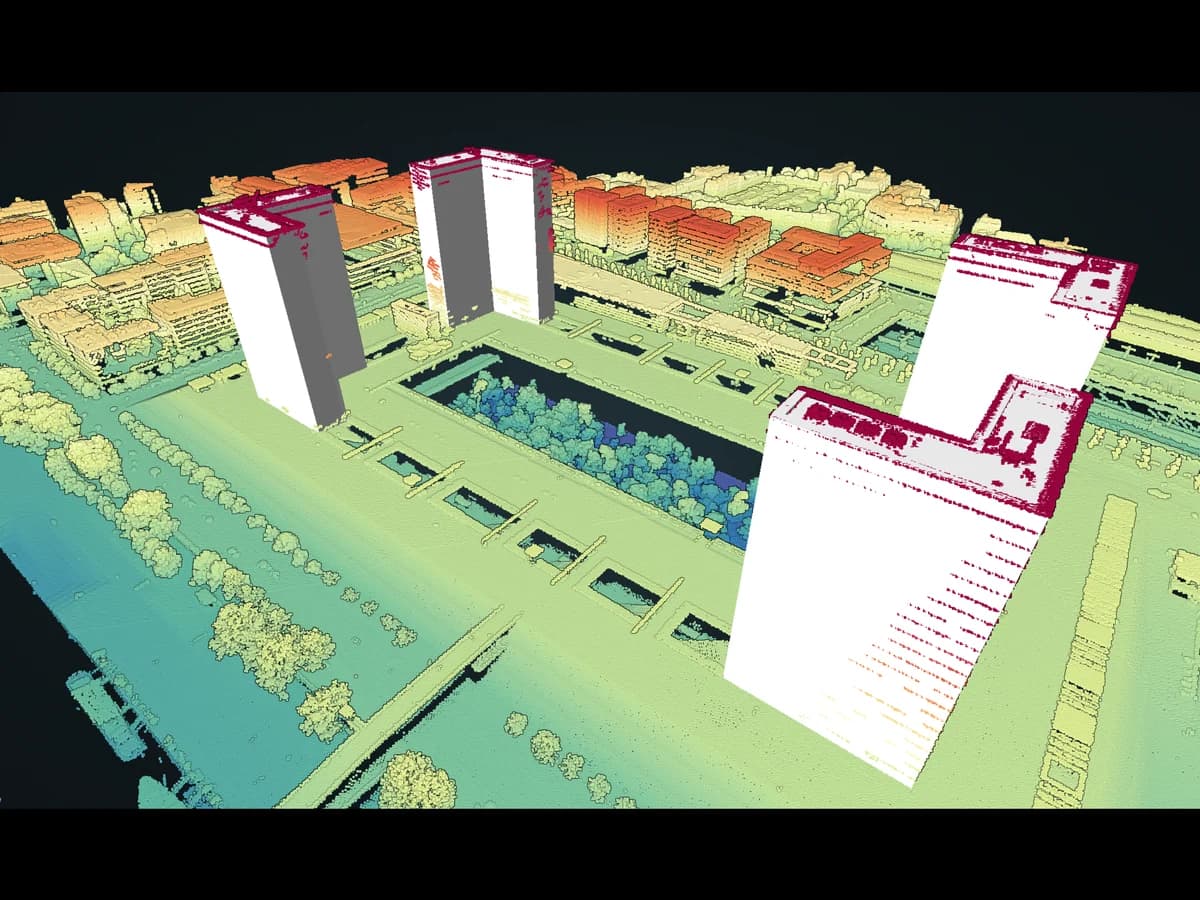
Photogrammetry vs LiDAR: Which One for Which Job
Photogrammetry rebuilds a surface from overlapping photos. LiDAR measures it with a laser. One gives colour and a cheap flight, the other sees under the trees.
Lilien Auger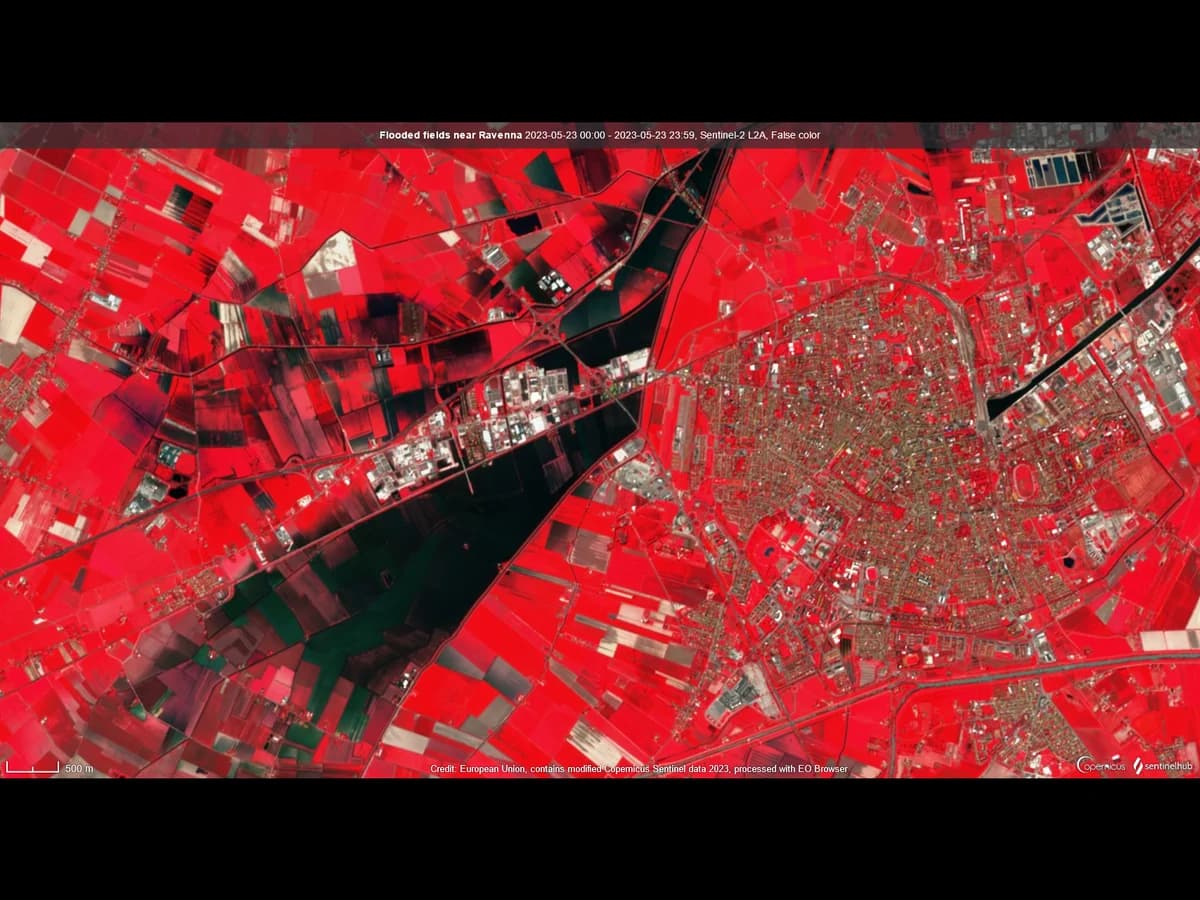
Multispectral vs Hyperspectral Imagery, Explained
Multispectral imagery records a few wide bands of light. Hyperspectral records hundreds of narrow ones. What each can tell you about a field, a roof or a mine.
Lilien Auger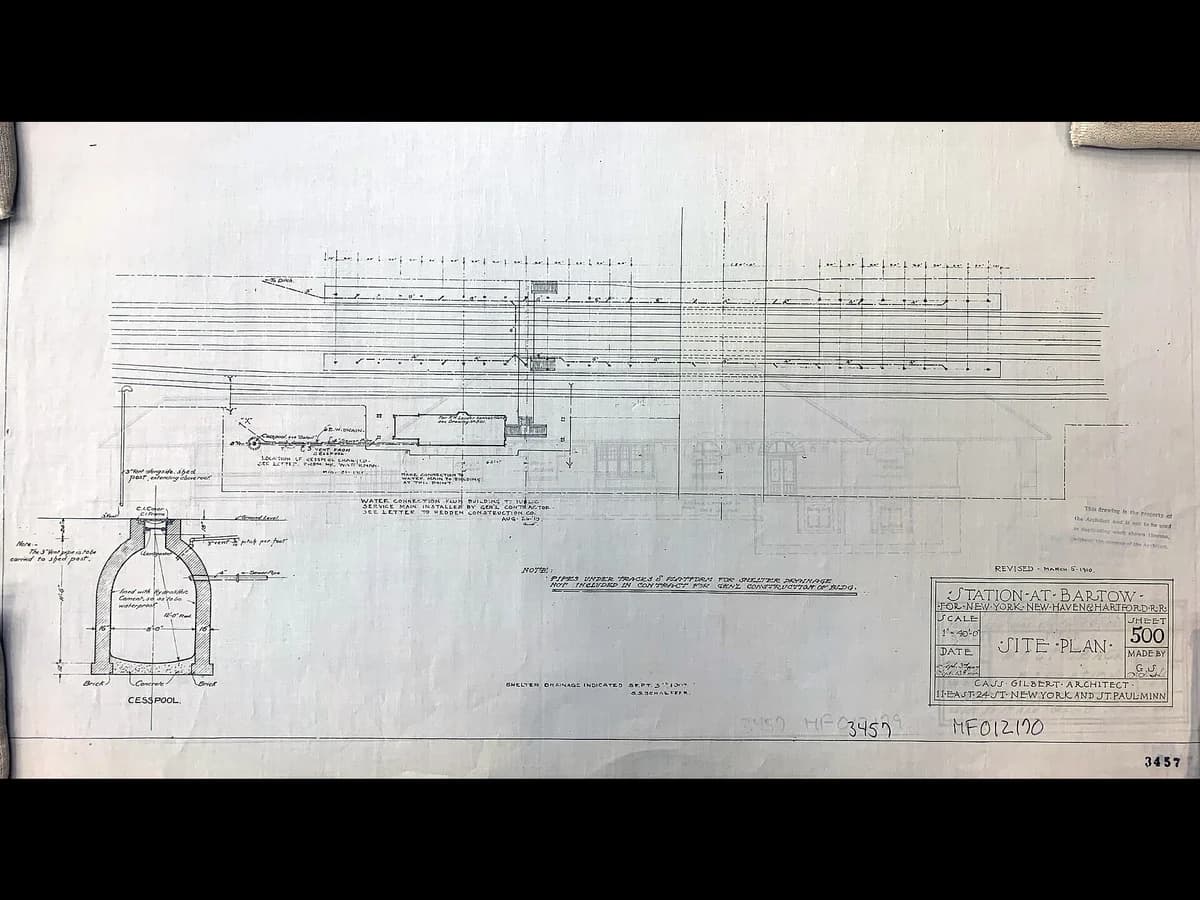
Site Plan vs Plot Plan: What Each One Shows
A plot plan draws one lot: its lines, its building, its setbacks. A site plan draws the whole project. Which one a permit asks for, and who draws it.
Lilien Auger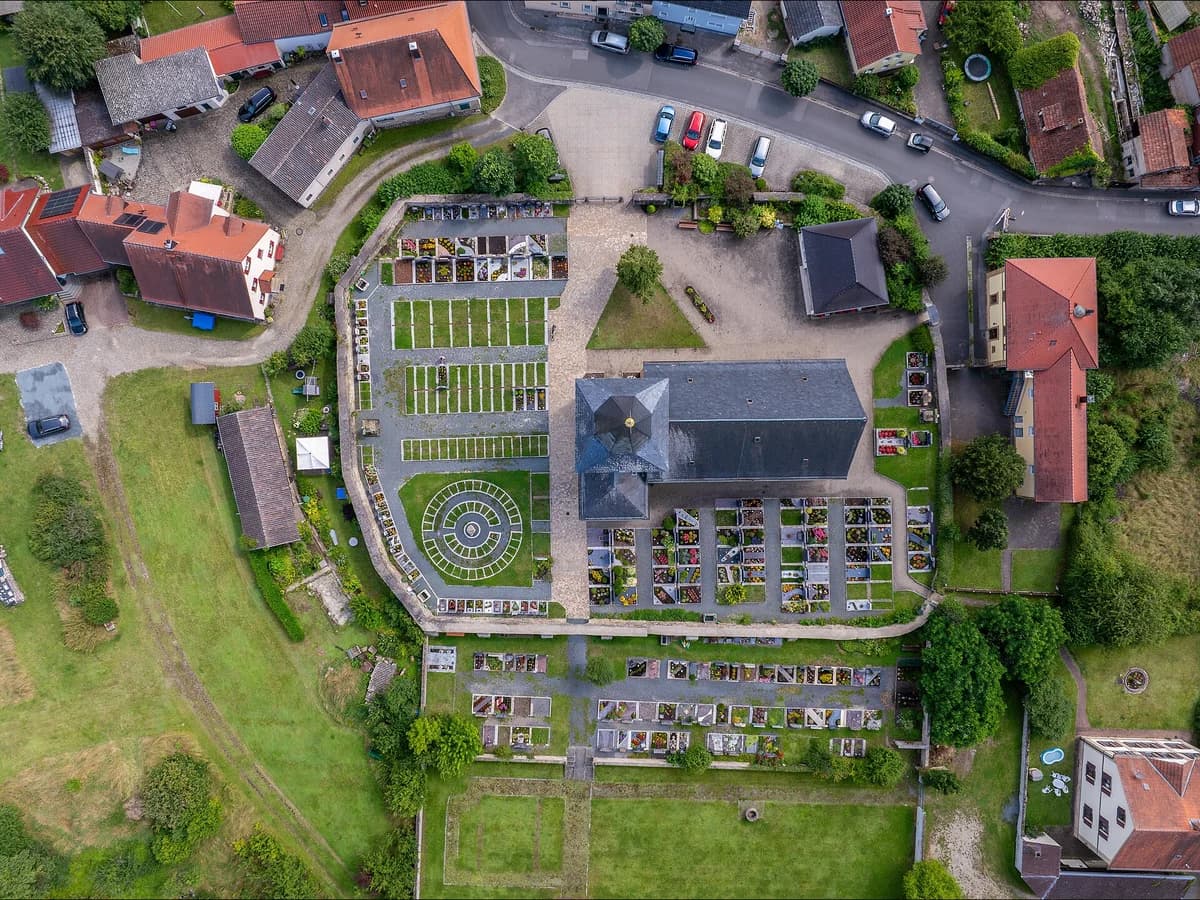
What Is an Orthomosaic? Orthomosaic vs Orthophoto Explained
An orthomosaic is one map-corrected image stitched from many aerial photos. An orthophoto is one corrected photo. Which you have, and where seams go wrong.
Lilien Auger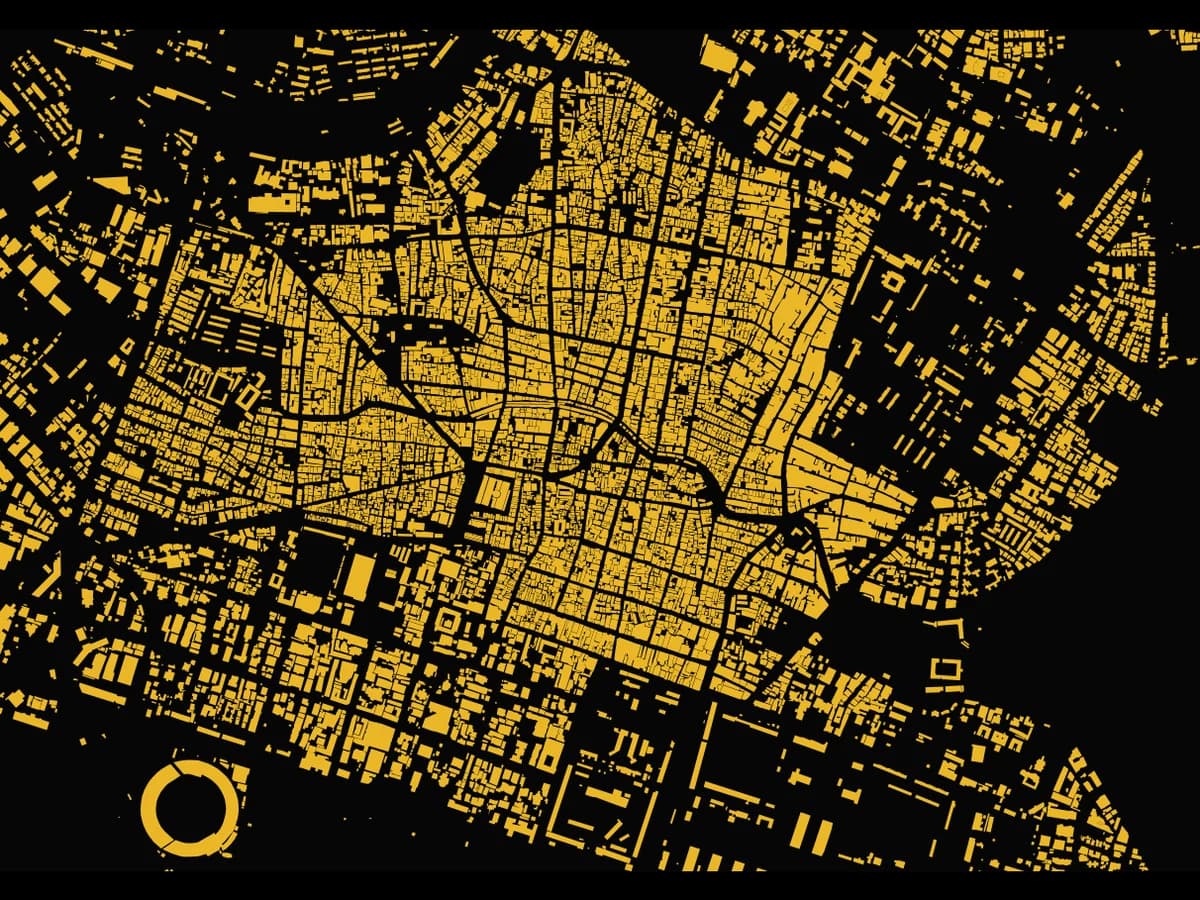
Semantic vs Instance Segmentation on Aerial Imagery
Semantic segmentation labels every pixel with a class: building or not. Instance segmentation draws every building as its own object.
Lilien Auger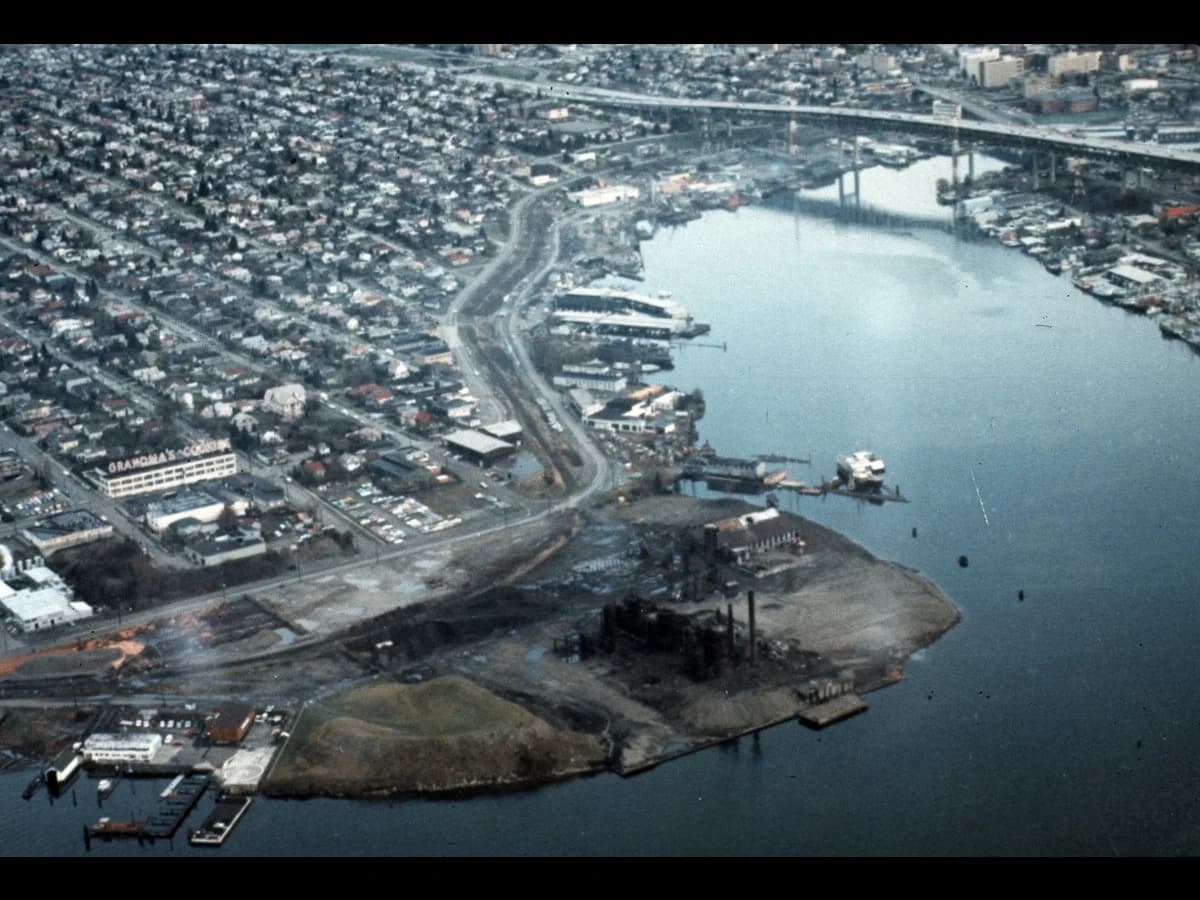
Greenfield vs Brownfield Sites: Meaning and Differences
A greenfield site has never been built on. A brownfield site has, and may still hold slabs, sheds or contamination. What each costs and how to tell them apart.
Lilien Auger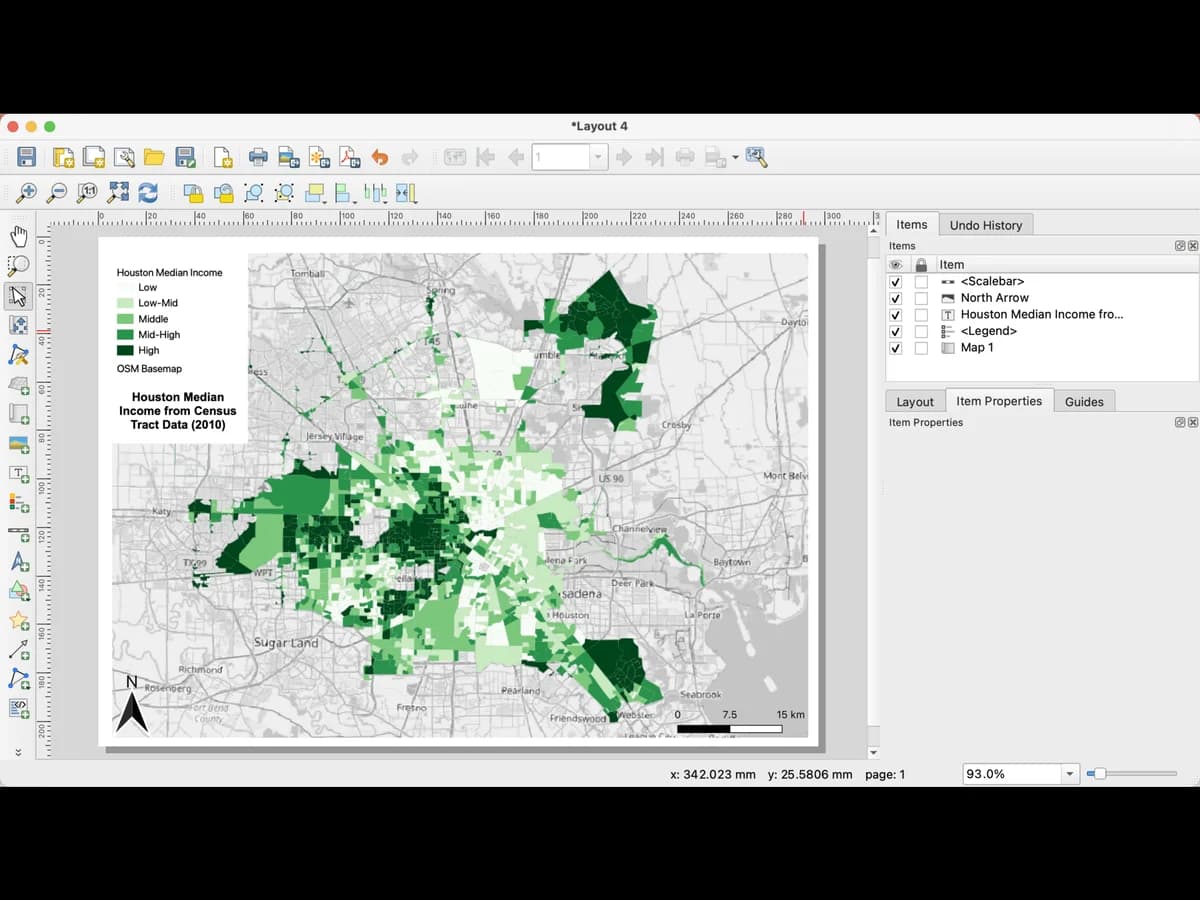
How to Add a Basemap in QGIS: XYZ, WMS and Plugins
Browser panel, XYZ Tiles, double-click OpenStreetMap. Then Google, Esri and Bing by URL, national imagery by WMS, and which basemap a detection model can read.
Lilien Auger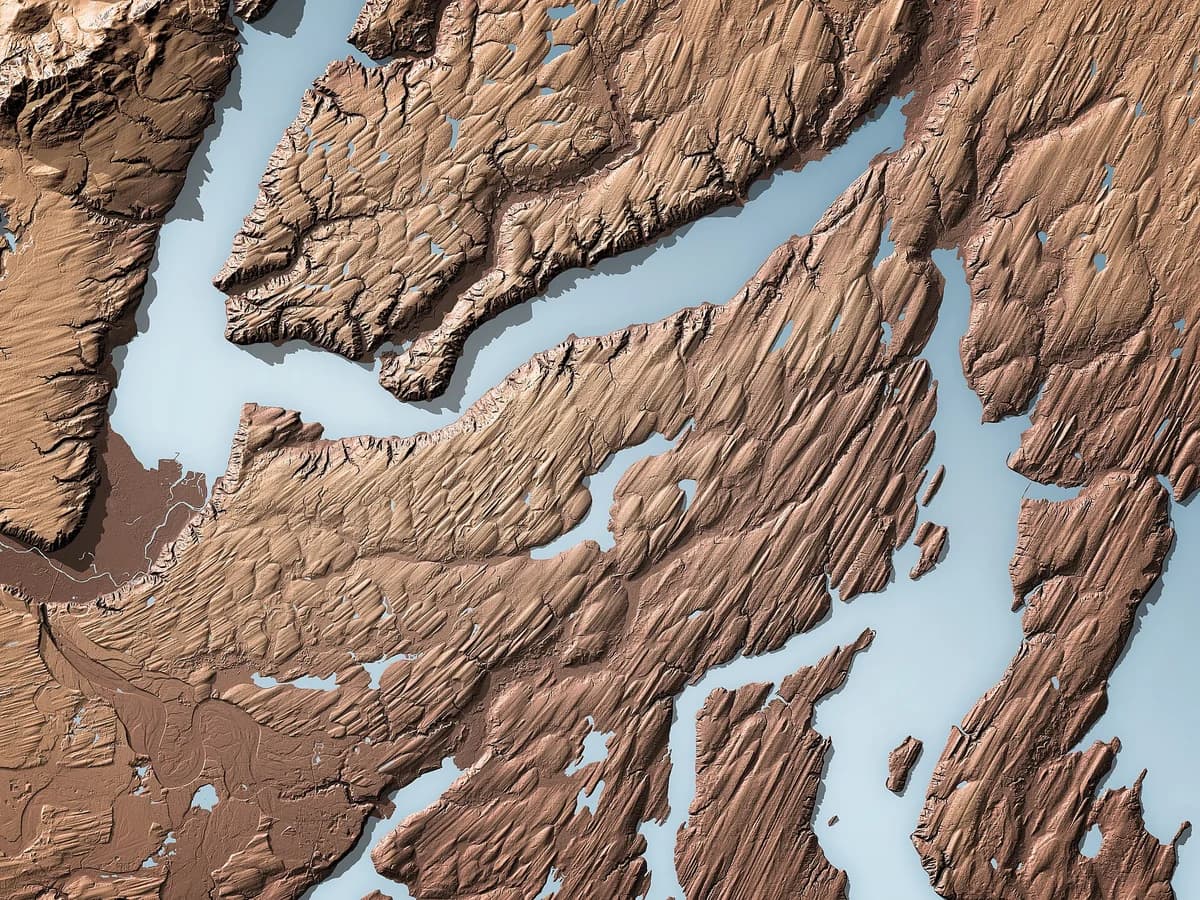
DSM vs DTM vs DEM: What's the Difference and Which to Use
A DSM is the top of everything: roofs, treetops, ground. A DTM is bare ground alone, and DEM usually means the same. Which one to use for flood, slope or 3D.
Lilien Auger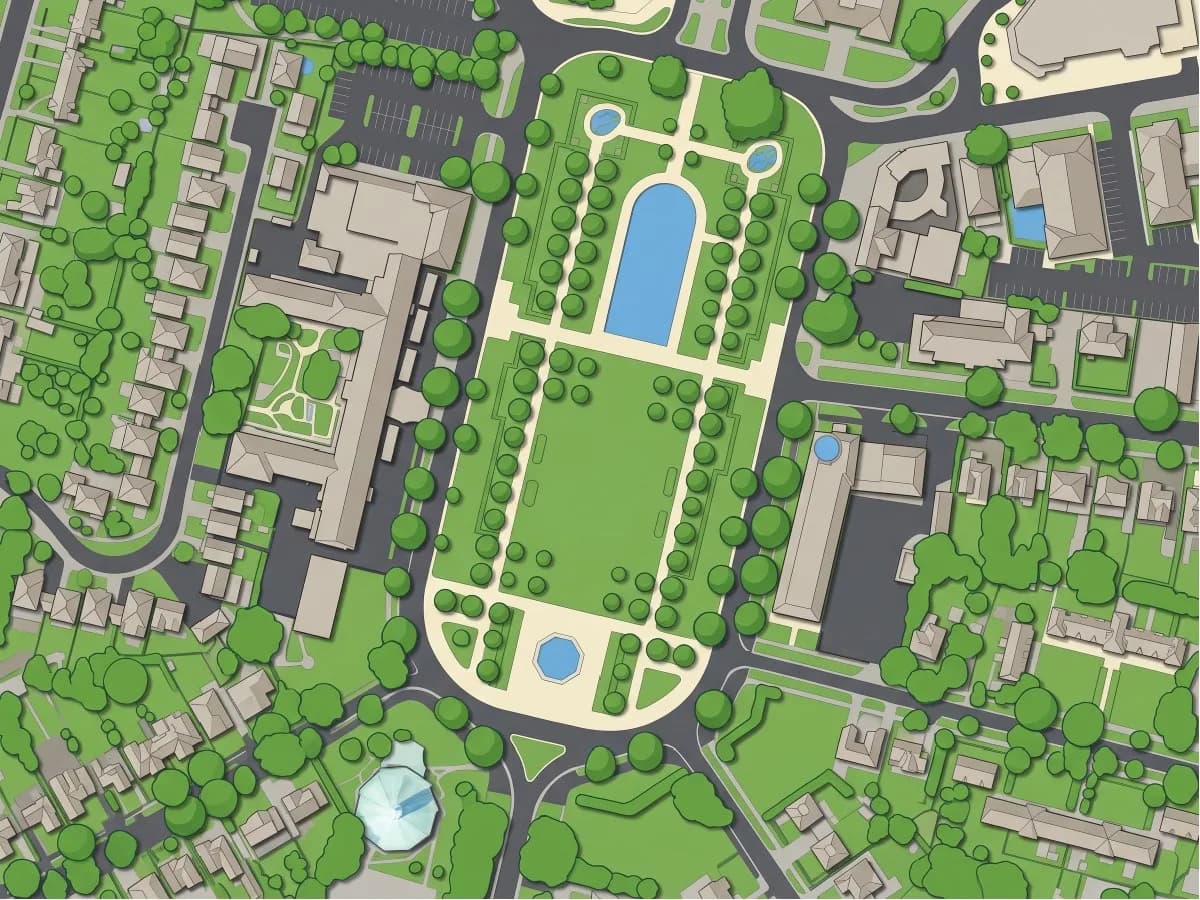
Colored site plan: the same block four ways
Flat, watercolor, pencil and glossy, all rendered from one aerial image of Letchworth Garden City. Every prompt in full, and where the model invented water.
Lilien Auger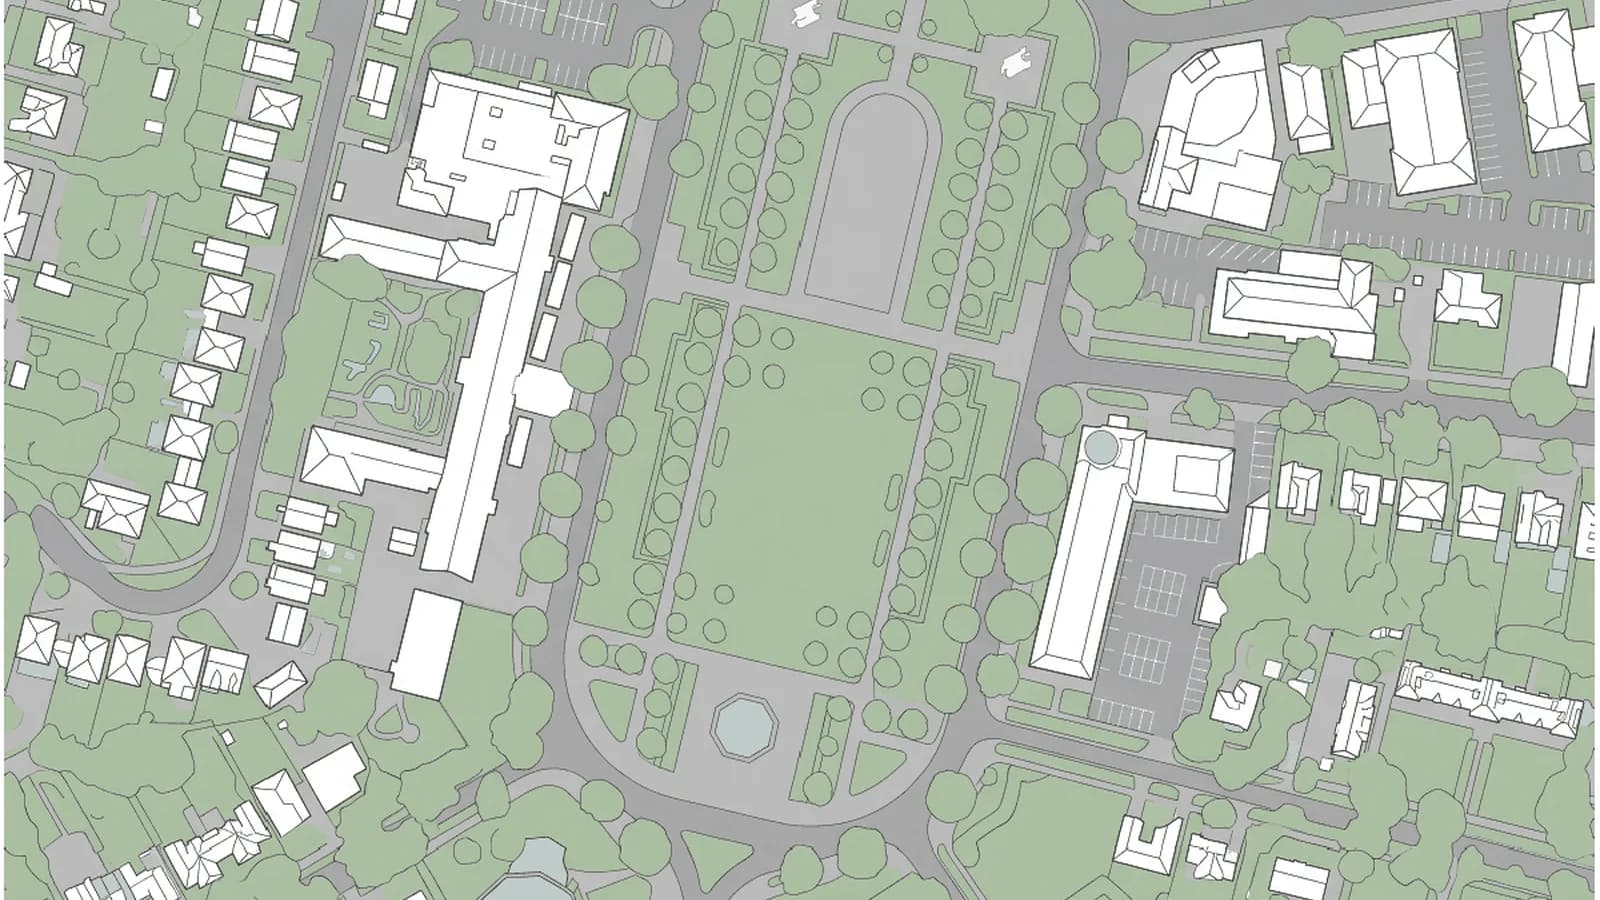
Turn a Satellite Image into a Site Plan in QGIS
Load imagery in QGIS, draw a zone, and get a georeferenced four-class site plan back in under a minute. The manual route, the AI route, and where each breaks.
Lilien Auger
How to Simulate a Flood in QGIS: 5 Methods
From the official hazard map to a generated aerial view of the water. Which method gives a number, which gives a picture, why an elevation model changes both.
Lilien Auger
Google Earth AI Alternative for QGIS
Google pulled image generation from Google Earth after one day. AI Edit runs the same Nano Banana model inside QGIS and returns a map layer, not a screenshot.
Lilien Auger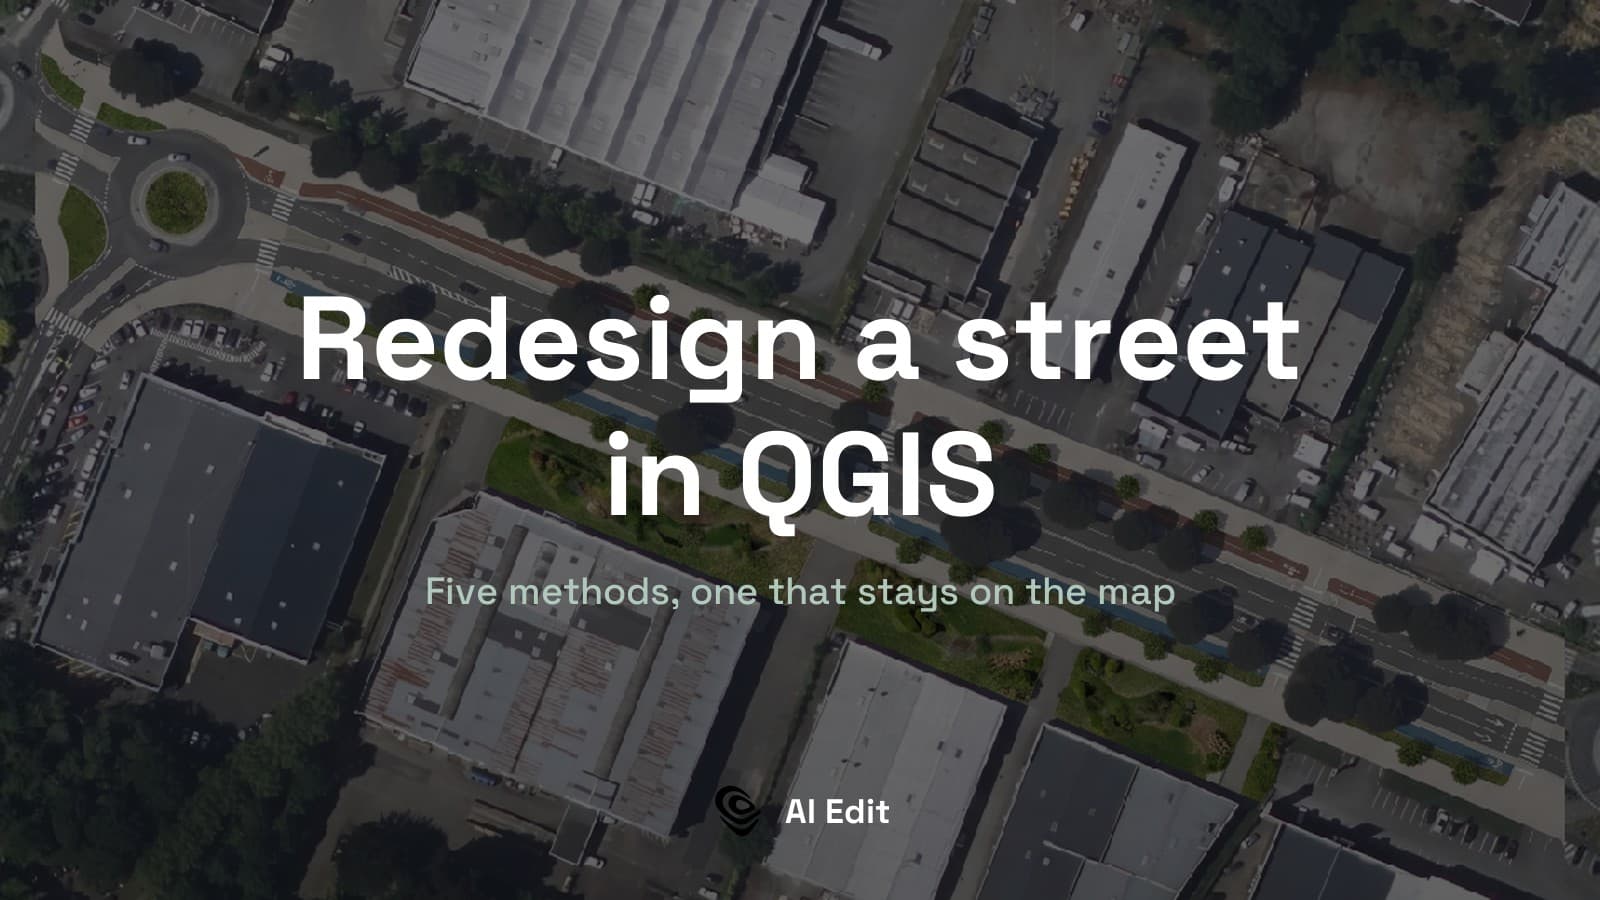
How to Redesign a Street in QGIS: 5 Methods
Five ways to show a street rebuilt, from hand-drawn vector layers to a generated aerial view. Only one gives back a picture that stays on the map.
Lilien Auger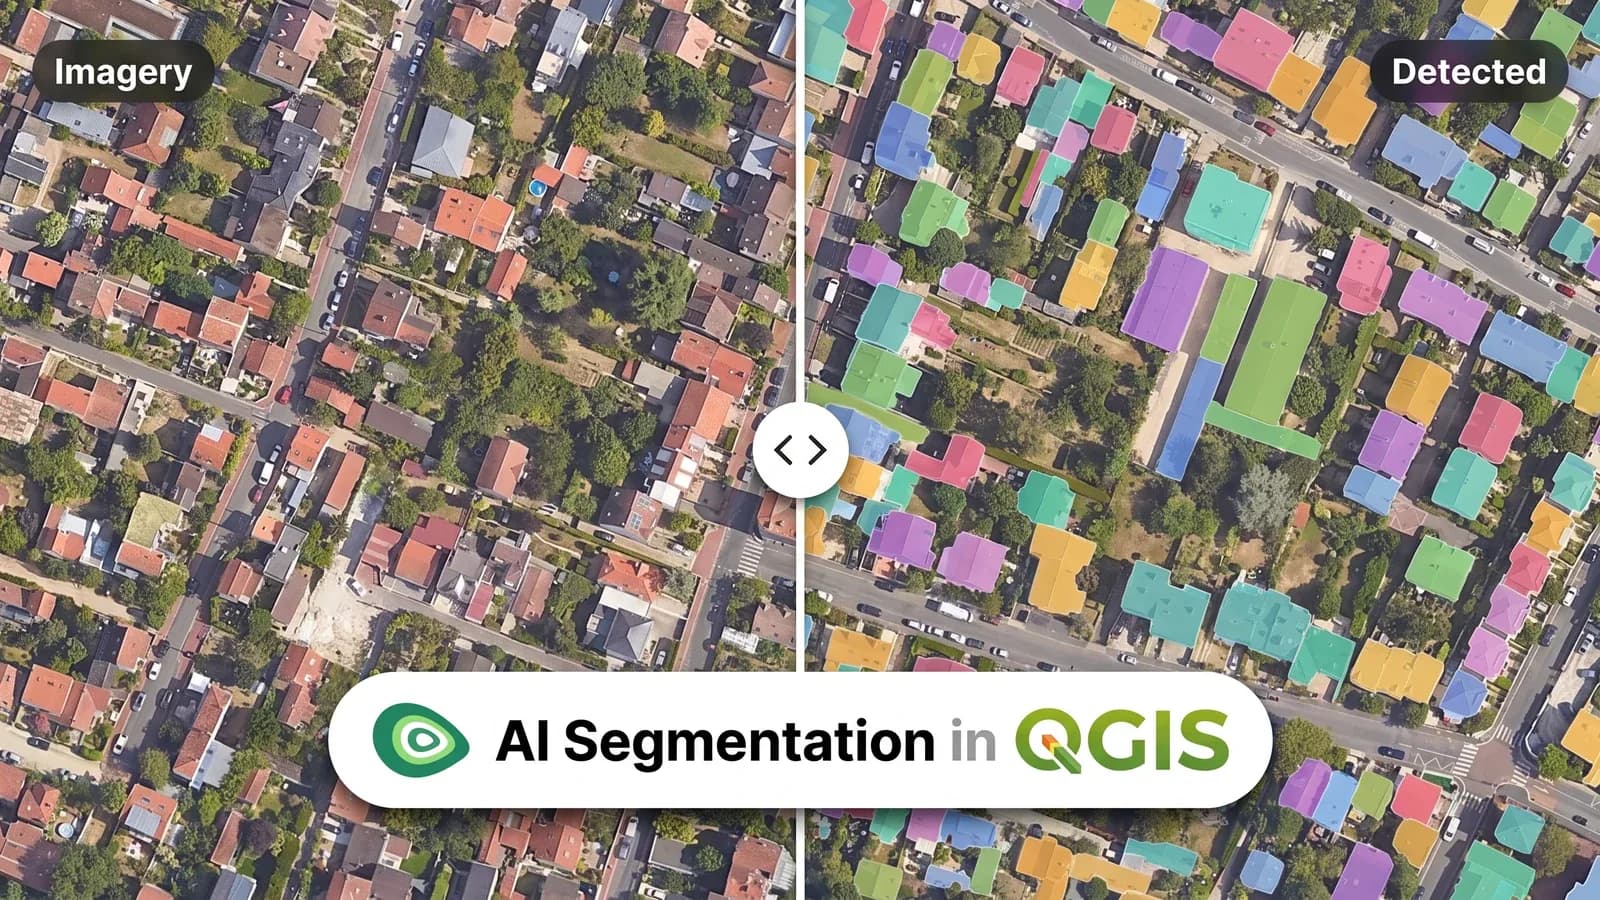
AI Segmentation for QGIS: The Complete Guide
Draw a zone, name the object, get every polygon as a clean vector layer. The full run in QGIS, the three-step review in any order, and Semi-Auto mode.
Lilien Auger