QGIS Raster Calculator: Tested Formulas and 4 Silent Traps
Published
Open the QGIS Raster Calculator from Raster > Raster Calculator (or from the Processing Toolbox). For Sentinel-2 NDVI, use ("B08@1" - "B04@1") / ("B08@1" + "B04@1"): the menu calculator computes in Float32 automatically. Watch out for the GDAL calculator wrapping unsigned integers, * masks writing 0 instead of nodata, and slope tools breaking on degree grids.
 Raster Calculator from Raster > Raster Calculator (or from the Processing Toolbox). For Sentinel-2 NDVI, use
I tested all of those on 7 November 2026 in QGIS 3.44.15 on a 5 km by 5 km window of hilly farmland south of Machado, Minas Gerais, Brazil (2,500 ha, 250,000 pixels at 10 m in UTM 23S, EPSG:32723). I used a Sentinel-2 L2A scene from 3 November 2026 and a 30 m Copernicus GLO-30 DEM, and checked every output against a 64-bit floating-point numpy reference outside QGIS.
What is the QGIS Raster Calculator, and which one are you opening?
A raster calculator evaluates a math or boolean expression pixel by pixel across one or more raster bands and writes a new grid. In QGIS, you refer to a band as "layername@band" (for example "B08@1" for band 1 of layer B08), combine bands with +, -, *, /, <, >, AND, OR or if(condition, true, false), and write the output to a GeoTIFF or a virtual layer in memory.
What trips people up is that QGIS ships five tools named "Raster calculator", and they don't all run the same engine. Four use the native QGIS expression parser and compute in floating point. The GDAL one (gdal_calc.py under the hood) uses A/B/C letter variables and evaluates numpy expressions in the input band's own data type.
| Tool in QGIS 3.44 | Band syntax | Output type | Pixels off by > 0.01 on uint16 NDVI (of 250,000) |
|---|---|---|---|
Raster > Raster Calculator (QgsRasterCalculator) | "B08@1" | Float32 | 0 |
Processing: Raster calculator (native:rastercalc) | "B08@1" | Float32 | 0 |
Processing: Raster calculator (virtual) (native:virtualrastercalc) | "B08@1" | Float64 (in memory) | 0 |
Processing: Raster calculator (legacy) (qgis:rastercalculator) | "B08@1" | Float32 | 0 |
Processing: GDAL Raster calculator (gdal:rastercalculator) | A, B | Float32 file, math in the input type | 703 (0.28%, values up to 126.7) |
If you just want a formula that works without casting types, use Raster > Raster Calculator from the top menu, or the first Raster calculator under the native QGIS group in Processing.
Step by step: calculate NDVI in the QGIS Raster Calculator
If you need Sentinel-2 bands first, our guide on how to download Sentinel-2 imagery in QGIS covers the STAC catalog path. Once bands B04 (red, 10 m) and B08 (near-infrared, 10 m) are in your Layers panel, calculating what NDVI measures takes four steps.
Select the layer that sets your output grid
Click B08 in the Layers panel before opening the dialog. When Raster > Raster Calculator opens, it reads the output extent, coordinate system (CRS), width and height from whichever raster layer is currently selected in the Layers panel. Confirm the header says Extent (current: B08).
Enter the NDVI expression
In Raster > Raster Calculator, double-click B08@1 and B04@1 in the Raster Bands list (or type them with double quotes) to build:
("B08@1" - "B04@1") / ("B08@1" + "B04@1")
Check that the note directly under the expression box reads Expression valid. You don't need to cast the unsigned 16-bit Sentinel-2 bands to float in this dialog.
Pick an output file or virtual layer
Set Output layer to a .tif path and leave Output format on GeoTIFF. If you only want a quick preview and don't want a file on disk, tick Create on-the-fly raster instead of writing layer to disk (it stores a formula URI in the project file with absolute paths to the inputs, and matches the written file to 3e-8).
Run and style the result
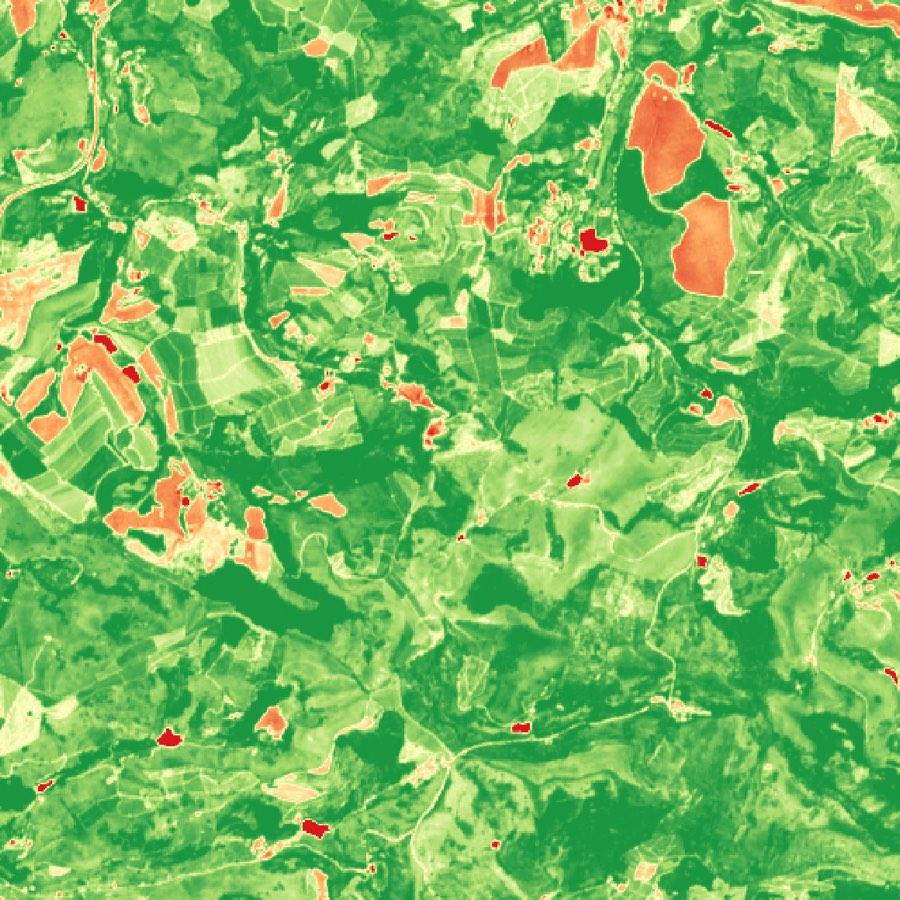
Click OK. On our 500 by 500 pixel window, the calculation finished in 0.12 seconds, with values from -0.5507 to 0.9547 and a maximum difference of 2.98e-8 against 64-bit numpy. Open Layer Properties > Symbology, switch to Singleband pseudocolor, pick the RdYlGn ramp, and set min to 0 and max to 0.9.
Here is the dialog right before clicking OK, with the extent taken from B08:
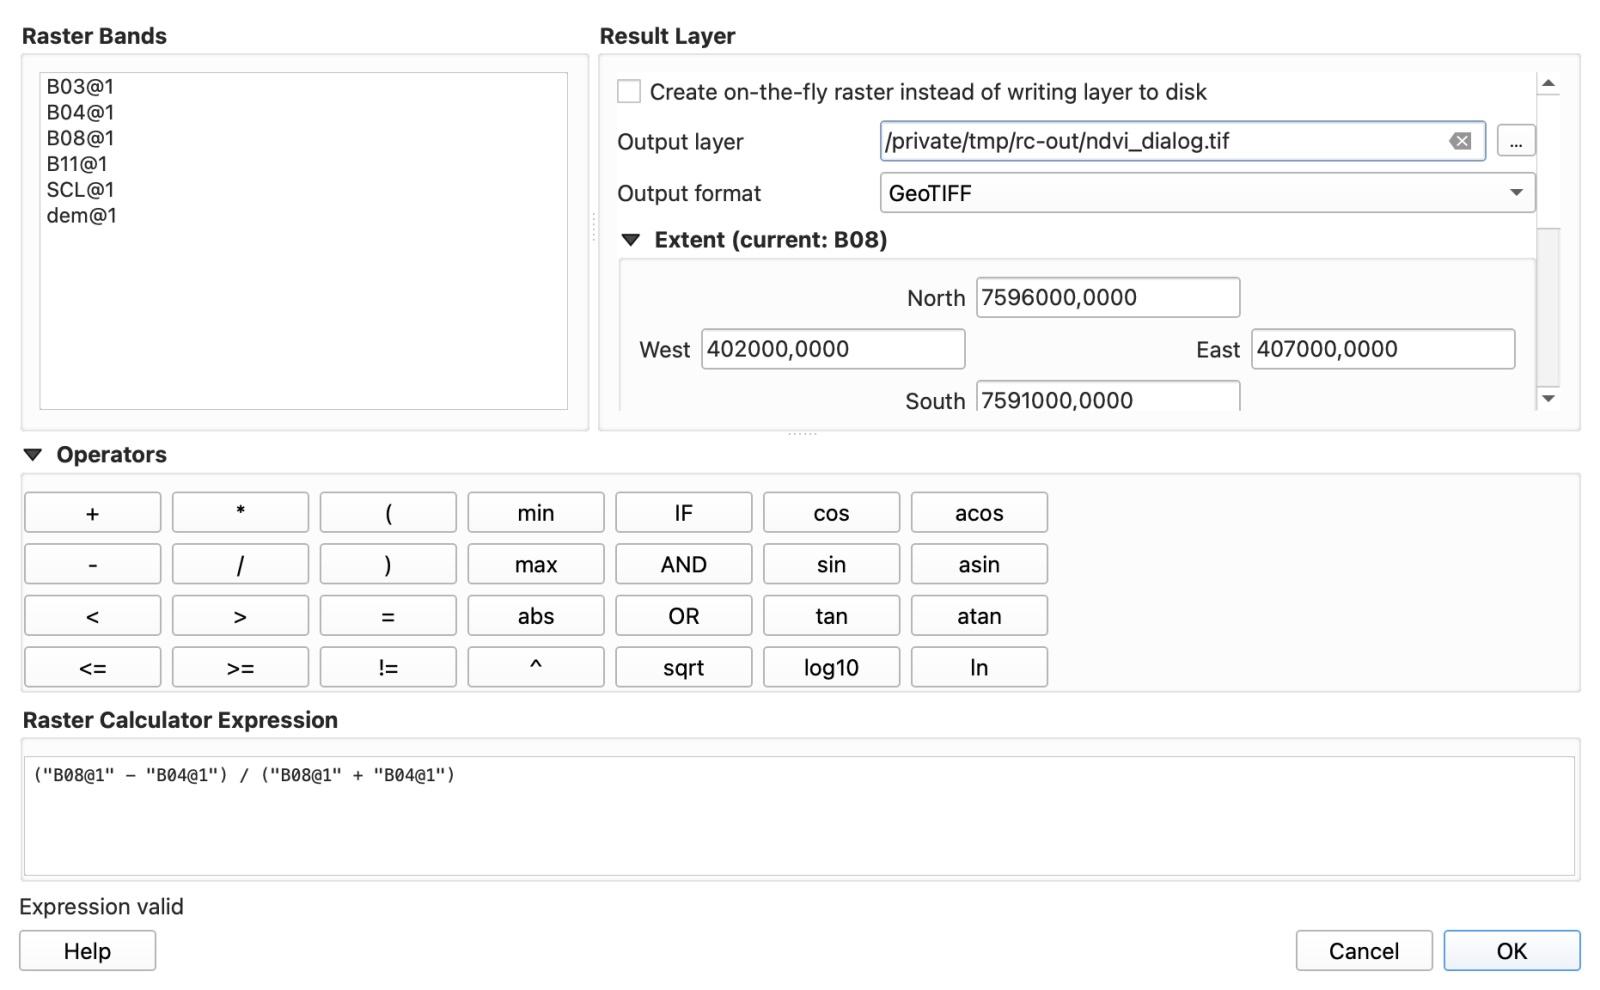
Once styled with RdYlGn, dense vegetation around Machado shows up in dark green, bare soil and roads in red, and the 703 pixels where red beats near-infrared (water and dark spots) go negative. The mean NDVI over the whole window is 0.727. If your canopy is dense enough to saturate NDVI or leaves bare soil exposed between rows, see how the formula changes in our comparison of NDVI vs EVI, SAVI and NDRE.
QGIS Raster Calculator formula cookbook
Every expression below was run in QGIS 3.44.15 (QgsRasterCalculator) on the Machado dataset and checked pixel by pixel against numpy. Copy the syntax with double quotes around "layer@band".
| Task | Tested expression (Raster > Raster Calculator) | What it produced on the Machado test window |
|---|---|---|
| NDVI (Sentinel-2 10 m) | ("B08@1" - "B04@1") / ("B08@1" + "B04@1") | Float32 from -0.5507 to 0.9547 across 250,000 pixels; max error 2.98e-8. |
| NDWI (McFeeters water index) | ("B03@1" - "B08@1") / ("B03@1" + "B08@1") | Float32; "ndwi@1" > 0 isolated 637 water pixels (6.4 ha of ponds and streams). |
| Mask below threshold to nodata | "ndvi@1" / ("ndvi@1" > 0.3) | Divides by 0 where false, writing true nodata (11,343 pixels excluded; mean 0.753). |
Conditional replace (if) | if("ndvi@1" > 0.3, "ndvi@1", 0) | Parses and keeps values above 0.3, but writes 0 elsewhere, like the * mask. |
| Reclass DEM into 5 classes (boolean sum) | ("dem@1" < 800) * 1 + ("dem@1" >= 800 AND "dem@1" < 850) * 2 + ("dem@1" >= 850 AND "dem@1" < 900) * 3 + ("dem@1" >= 900 AND "dem@1" < 1000) * 4 + ("dem@1" >= 1000) * 5 | Codes 1 to 5 across 54,901 DEM pixels; identical on every pixel to native:reclassifybytable. |
Reclass DEM into 5 classes (nested if) | if("dem@1" < 800, 1, if("dem@1" < 850, 2, if("dem@1" < 900, 3, if("dem@1" < 1000, 4, 5)))) | Same 5 classes (96.9 ha, 1,089.4 ha, 1,323.1 ha, 1,759.7 ha, 582.7 ha). |
| Slope threshold | "slope@1" > 15 | Writes 1 above 15 degrees and 0 at or below (17,327 of 52,979 valid UTM DEM pixels, 32.61%). |
| Elevation metres to feet | "dem@1" * 3.28084 | Max error 0.98 ft (0.026% at 1,168 m) if you use the QGIS manual's 3.28 instead of 3.28084. |
Four silent traps that give wrong numbers (and how to spot them)
None of the four failures below raises a warning in QGIS. Each one finishes, adds a layer to your project, and hands you numbers that look plausible until you check them.
1. The GDAL Raster Calculator wraps unsigned integers on negative NDVI
The native QGIS Raster Calculator never hits an integer-division bug on Sentinel-2 bands, but the Processing GDAL Raster calculator (gdal:rastercalculator) evaluates (A-B)/(A+B) in the input file's own numpy data type and corrupts every pixel where Red is higher than NIR.
Sentinel-2 Level-2A bands ship as unsigned 16-bit integers (uint16). In our 250,000-pixel window, 703 pixels (0.28%, water and dark spots) have B04 larger than B08. When gdal:rastercalculator subtracts B04 from B08 in uint16, the negative result wraps around 65,536, and the tool writes those 703 pixels into a Float32 file with values between 0 and 126.7 instead of negative NDVI.
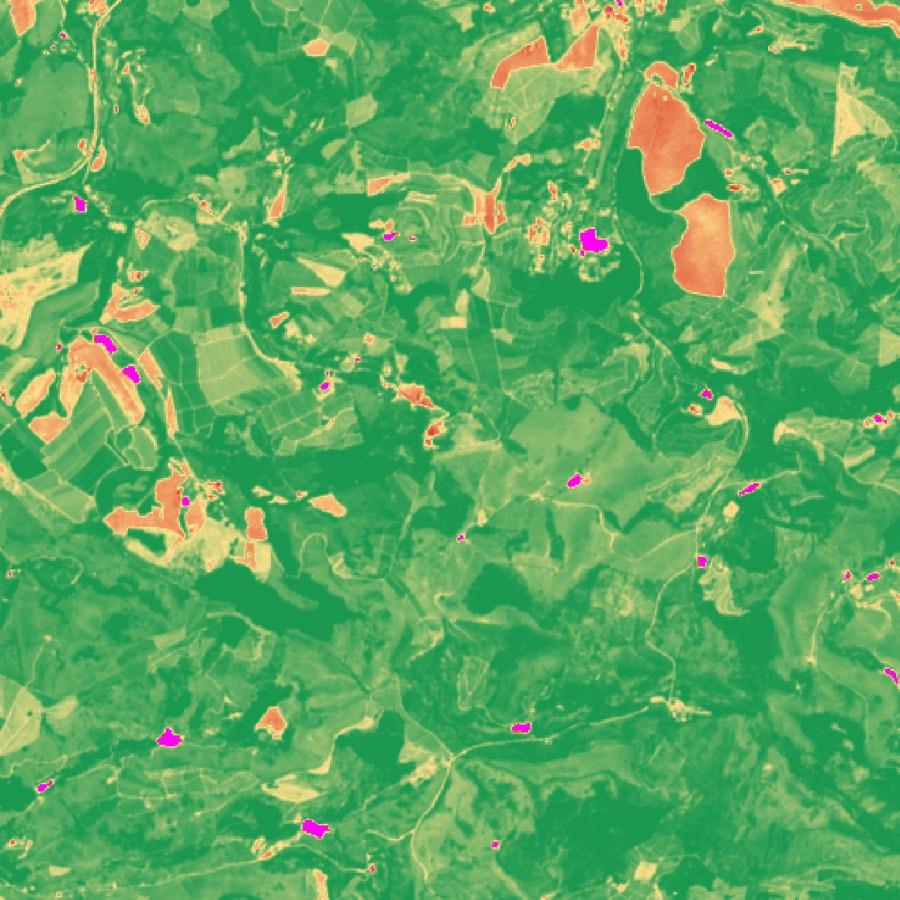
If you use the GDAL calculator, either cast in the expression with (A.astype(numpy.float32)-B)/(A+B) (which brought wrong pixels down to 0 in our test), or use the native QGIS Raster Calculator instead. And never set the GDAL output type to Int16 or Byte on an index: forcing Int16 rounded 249,973 of our 250,000 pixels (99.99%) into just -1, 0 or 1.
2. Multiplying by a condition (*) writes 0, not nodata, and drags your mean down
Multiplying a raster by a boolean condition like ("ndvi@1" > 0.3) * "ndvi@1" sets every excluded pixel to 0 instead of nodata, which pulled the mean NDVI of the kept area down from 0.753 to 0.719.
The official QGIS manual teaches ("elevation@1" >= 0) * "elevation@1" as the standard way to mask a raster. On our Machado NDVI layer, 11,343 pixels sit at or below 0.3. When you multiply by ("ndvi@1" > 0.3), all 11,343 pixels are written as the valid number 0.0, so the layer statistics still count all 250,000 pixels and include 11,343 zeros in every mean, histogram and zonal statistic you run next.
| Mask expression | What excluded pixels become | Pixels counted in layer stats | Mean NDVI of kept area |
|---|---|---|---|
("ndvi@1" > 0.3) * "ndvi@1" | 0.0 (counted as data) | 250,000 | 0.719 (-0.034 error) |
"ndvi@1" / ("ndvi@1" > 0.3) | nodata (-3.40282e+38) | 238,657 | 0.753 (exact) |
To write true nodata in a single step, divide by the condition instead of multiplying: "ndvi@1" / ("ndvi@1" > 0.3). Where the condition is true (1), the value is unchanged; where it is false (0), division by zero produces nodata.
3. Running Slope on a degree DEM before the calculator marks 100% of your map as steep
Running the QGIS Slope tool with default settings on a geographic DEM (such as Copernicus GLO-30 in EPSG:4326) before thresholding "slope@1" > 15 marked 100% of our hilly farmland as steeper than 15 degrees, with a mean slope of 89.99 degrees, whereas the true figure after warping to UTM is 32.61%.
Copernicus GLO-30 and other free global DEMs (see our guide to free DEM downloads in QGIS) arrive in geographic degrees (EPSG:4326) with elevations in metres. With the default Z factor, the Slope tool reads a rise in metres against a horizontal step of 0.000278 (a pixel width in degrees), so every hillside looks like a vertical cliff.
How Slope was computed before "slope@1" > 15 | Pixels > 15 degrees | Mean slope |
|---|---|---|
Native Slope on EPSG:4326 DEM, default Z factor 1 | 100.00% | 89.99° |
GDAL Slope on EPSG:4326 DEM, scale 1 | 100.00% | 89.99° |
GDAL Slope on EPSG:4326 DEM, scale 111120 | 31.61% | 12.54° |
| Native Slope after warping DEM to UTM 23S 30 m (reference) | 32.61% | 12.68° |
| GDAL Slope after warping DEM to UTM 23S 30 m | 32.71% | 12.71° |
Even the 111120 metres-per-degree scale shortcut lands a full percentage point low (31.61% vs 32.61%), because at 22°S a degree of longitude is about 7% shorter than a degree of latitude (cos 22° = 0.93). Always warp your DEM to its local UTM zone (Raster > Projections > Warp (Reproject), bilinear resampling, and set a -9999 nodata value so the edge doesn't ring with fake 87° slopes) before running Slope and the Raster Calculator.
4. Subtracting the Sentinel-2 +1000 offset without checking the scene breaks 90.6% of pixels
Subtracting 1000 from our Sentinel-2 L2A bands before computing NDVI pushed 226,413 of 250,000 pixels (90.6%) outside the valid [-1, 1] range, with values from -1273 to 1217 and a mean of 1.39 instead of 0.727.
ESA's Sentinel-2 processing baseline 04.00 and later added a +1000 digital-number offset so dark pixels don't clip at zero, and STAC metadata lists scale: 0.0001 and offset: -0.1. But when you pull Cloud-Optimized GeoTIFFs from the Earth Search STAC API (as we did for scene S2A_23KLR_20261103_0_L2A, baseline 05.13), the provider has already shifted the values and sets earthsearch:boa_offset_applied: true in the item metadata.
In our B04 file, 226,773 of 250,000 pixels (90.7%) had raw digital numbers below 1000 (minimum 59, median 491). Check the minimum value of B04 in Layer Properties > Information before you touch the formula: if dark pixels sit around 50 to 300, the offset is already removed and raw (B08 - B04) / (B08 + B04) is exact (dividing by the 10,000 scale factor cancels out in the ratio). Only subtract 1000 if your darkest clear-sky pixels sit above 1000.
Bonus: what "Expression valid" and the generic red error bar actually mean
Two other behaviours in Raster > Raster Calculator waste a lot of debugging time:
- Mixed resolutions on a coarse grid do not average. When you combine a 10 m band (
B08) and a 20 m band (B11), the native calculator resamples on the fly using nearest neighbour (the GDAL calculator stops immediately withError! Dimensions of file ... (250, 250) are different from other files (500, 500). Cannot proceed). On a 10 m output grid, repeating each 20 m pixel 2 by 2 works cleanly. On a 20 m output grid, the calculator does not average the four 10 m pixels: in62,250of62,500cells it simply picked the top-right 10 m pixel of each 2 by 2 block, differing from a 4-pixel mean by up to0.71in(B08 - B11) / (B08 + B11). - "Expression valid" only checks syntax, not band names. If you leave a trailing operator like
"B08@1" /, the dialog catches it (Expression invalid, OK greyed out).
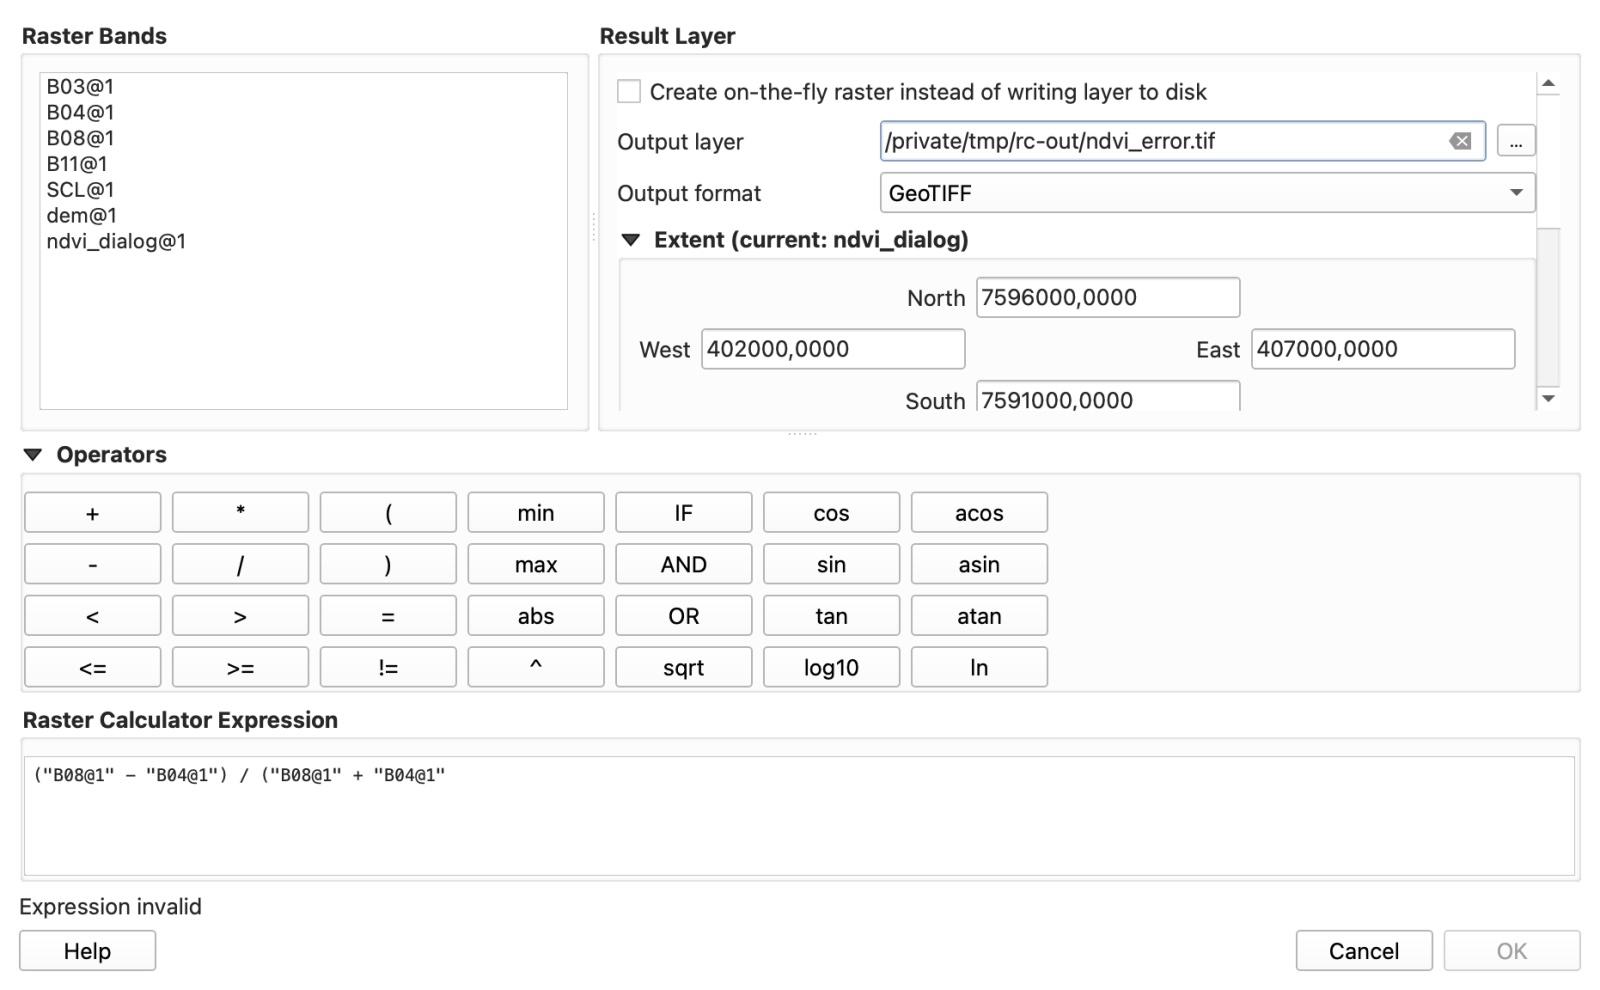
But if you type a layer or band that isn't in the project (such as "B04@2" or "B02@1" when B02 isn't loaded), the label still says Expression valid. When you click OK, QGIS writes a 500 by 500 GeoTIFF filled 100% with nodata, adds nothing to the map, and shows one red banner: Raster calculator: An error occurred while performing the calculation. Whenever you see that banner, check every "layer@band" name against the Raster Bands list.

Skipping the dialog: running raster math by asking an AI agent in QGIS
We build AI Agent, so this section is about our own plugin. It docks a chat panel inside QGIS that can search STAC catalogues, warp DEMs, run raster math in Python or Processing, and style the output on your map.
To see whether it avoids the traps above on the exact same Machado data, I drew a 120.07 ha farm polygon (E 405300-406300, N 7594400-7595600 in UTM 23S) over an empty OpenStreetMap project and sent three single-message prompts on Medium effort, Balanced permissions, one fresh chat per task.
Test 1: NDVI in 5 classes with hectares per class
I typed:
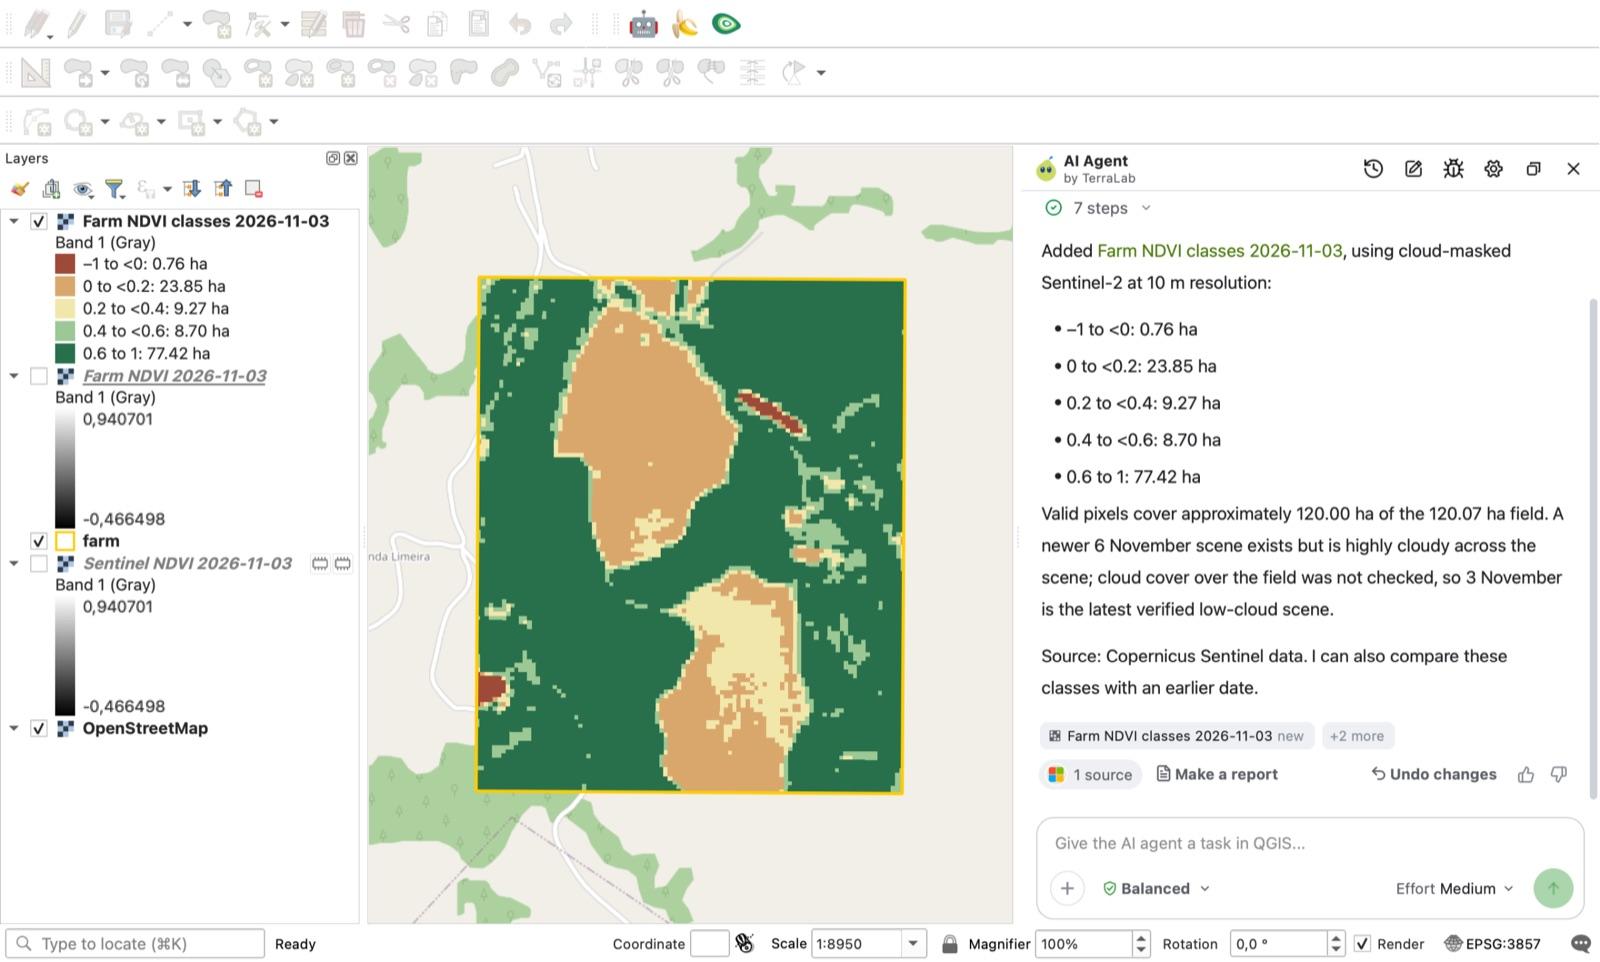
Compute NDVI for this field from the latest cloud-free Sentinel-2 and class it in 5 classes with hectares per class
The agent checked the STAC catalogue, noted that a 6 November 2026 scene existed but was heavily cloudy, and picked the same 3 November 2026 scene (1.65% tile cloud cover) I used for the manual test. It fetched B08 and B04 at 10 m, computed NDVI, classed it into five intervals, styled the layer, and reported the area per class on the 10 m metric grid.
| NDVI class | AI Agent report | My independent numpy check (same 12,000 pixels) | Difference |
|---|---|---|---|
-1 to < 0 | 0.76 ha | 0.76 ha | 0.0% |
0 to < 0.2 | 23.85 ha | 23.84 ha | < 0.1% |
0.2 to < 0.4 | 9.27 ha | 9.27 ha | 0.0% |
0.4 to < 0.6 | 8.70 ha | 8.69 ha | 0.1% |
0.6 to 1 | 77.42 ha | 77.44 ha | < 0.1% |
| Total valid area | 120.00 ha | 120.00 ha (of 120.07 ha polygon) | 0.0% |
Pixel by pixel on its exported NDVI raster, the mean absolute difference against my reference was 5e-5, and its class raster differed from mine on 4 pixels out of 12,000.
Test 2: Slope above 15 degrees (without a DEM in the project)
In a new chat with only the farm polygon loaded, I typed:
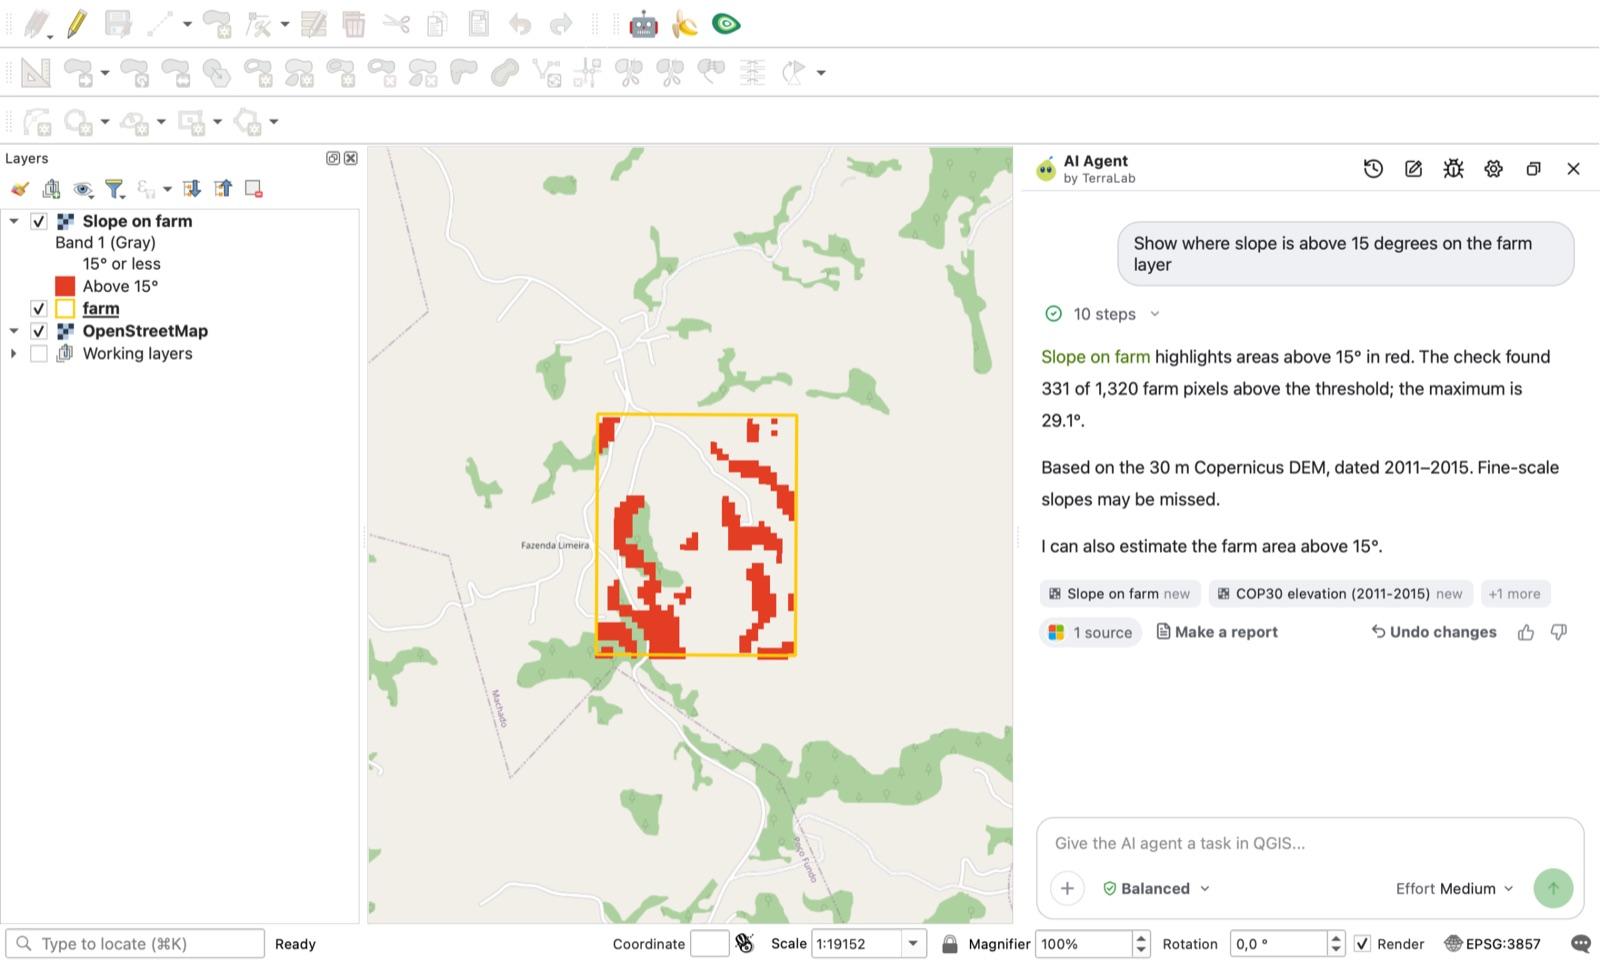
Show where slope is above 15 degrees on the farm layer
The agent fetched the Copernicus 30 m DEM, reprojected to a metric grid rather than running slope in degrees, and styled a two-class layer (15 degrees or less in pale yellow, above 15 degrees in red). It reported 331 of 1,320 farm pixels above 15 degrees (25.08%, max 29.15°). My own UTM-warped native Slope reference on the same rectangle gave 341 of 1,360 pixels (25.07%, max 29.29°), a 0.01 percentage-point difference.
Test 3: Where you still have to check the agent
In a third chat, I asked:
Mask out everything with NDVI below 0.3 on the farm layer and tell me the mean NDVI of what is left
Note that I didn't write "cloud-free" or "latest" in this prompt. The agent avoided the 0 mask trap: it wrote -9999 nodata for every masked pixel and returned a mean NDVI of 0.552 across 2,277 retained pixels. The mean of its output file was 0.5515; mine on the same scene and rule was 0.5513.
However, it pulled the Sentinel-2 scene from 27 October 2026, and on that date 80.5% of the farm (9,656 of 12,000 pixels in the Scene Classification band) was covered by cloud, shadow or cirrus. It named the date in its answer, but it never mentioned that 0.552 described only the clear fifth of the field. On the clear 3 November scene, the same rule gives a mean of 0.766 over 8,785 pixels.
My rule of thumb: whether you run the Raster Calculator by hand or ask an agent in the QGIS AI ecosystem, always inspect the scene date and load the true-colour or SCL cloud band before trusting a summary number.
How we measured this. All tests ran on 7 November 2026 in QGIS 3.44.15-Solothurn on macOS (GDAL 3.13.3, numpy 2.5.2) over a 5 km by 5 km window south of Machado, Minas Gerais, Brazil (EPSG:32723, E 402000-407000, N 7591000-7596000), using Sentinel-2 L2A scene S2A_23KLR_20261103_0_L2A (and the 27 October 2026 scene for test 3) from Earth Search and Copernicus GLO-30 tile S22_00_W046_00. Success criteria for the manual tests and agent tests 1 and 2 were written before any raster calculation ran; the criteria for test 3 were written after seeing tests 1 and 2. Reference grids were computed in 64-bit float numpy outside QGIS. AI Agent 1.9.4 ran on Medium effort and Balanced permissions, one message per chat. One scene and one site is a single-case benchmark, not a statistical survey across baselines.
Frequently asked questions
Why is my NDVI all 0, -1 or 1 in QGIS?
You forced an integer output type (Int16 or Byte) in the GDAL raster calculator, which rounds every decimal between -1 and 1 to -1, 0 or 1 (99.99% of pixels in our test). Leave the output type on Float32, or use Raster > Raster Calculator from the top menu, which outputs Float32 automatically.
Why does the QGIS Raster Calculator fail with 'An error occurred while performing the calculation' and output nodata?
A "layer@band" name in your formula does not match a loaded layer or band number (for example typing "B04@2" on a single-band file, or referring to a layer you removed). The Expression valid message under the formula box only checks syntax, not whether the bands exist. Re-insert each band by double-clicking it in the Raster Bands list.
What is the difference between Raster > Raster Calculator and the GDAL Raster Calculator in Processing?
Raster > Raster Calculator (and the native Processing Raster calculator) uses QGIS's own parser with "layer@band" names and always computes in floating point. The GDAL Raster calculator (gdal_calc.py) uses letter variables (A, B) and evaluates numpy math in the input band's data type, so subtracting unsigned 16-bit integer bands wraps negative numbers around 65,536 unless you cast with A.astype(numpy.float32).
How do I write an IF condition or set values to nodata in the QGIS Raster Calculator?
You can write if("ndvi@1" > 0.3, "ndvi@1", 0) to replace values below 0.3 with 0. If you want excluded pixels to become true nodata so they don't drag down your layer mean, divide by the condition instead: "ndvi@1" / ("ndvi@1" > 0.3). Where the condition is false (0), dividing by zero writes nodata.
Read nextWhat Is NDVI? Formula, Value Chart and the Sentinel-2 Trap
Do it in QGIS by asking for it
AI Agent carries out the task you describe, in your own QGIS project. Free, no card.