What Is a Building Footprint? Meaning & Calculation
Published Updated
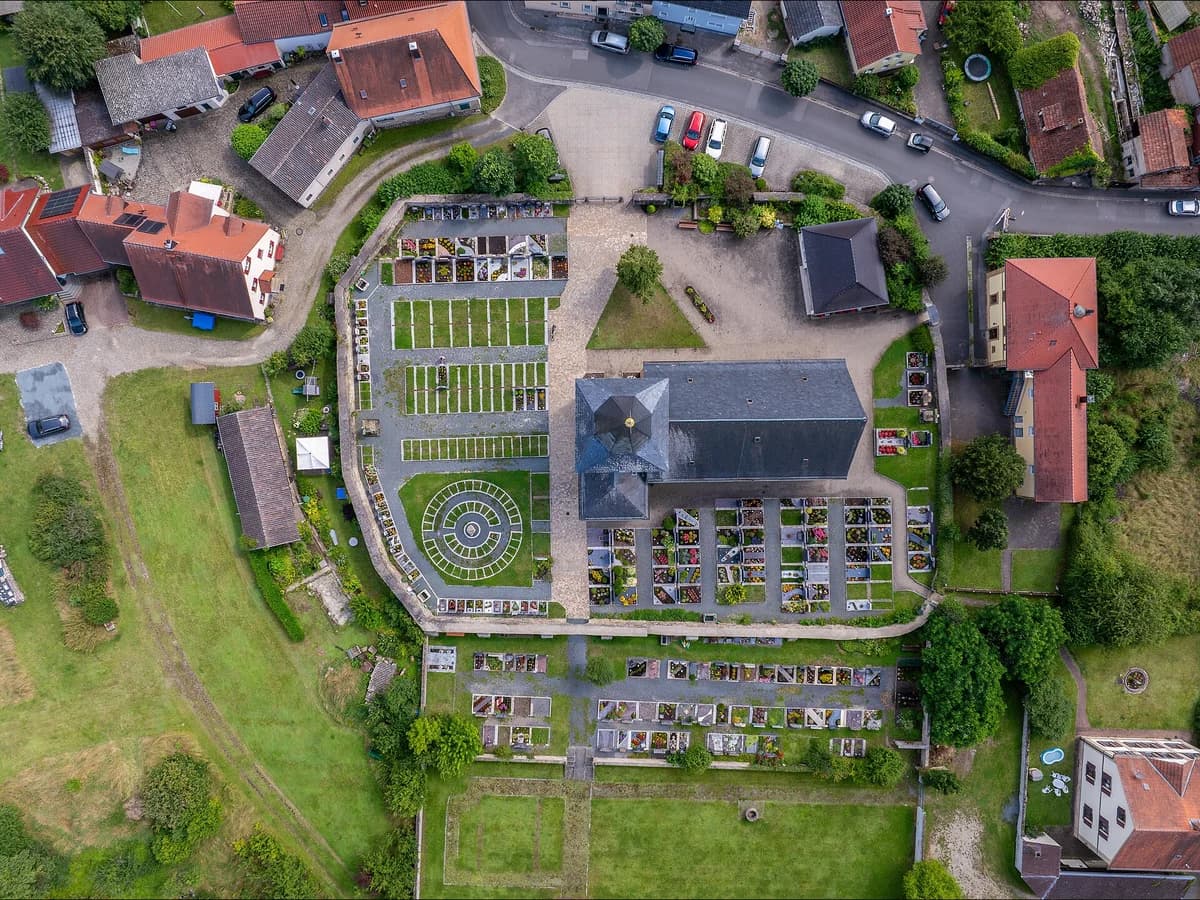
A building footprint is the area of ground covered by a building, measured along the outside face of its outer walls at ground level. It includes attached garages, leaves out roof overhangs and cantilevered balconies, and is given in square metres or square feet.
It is a flat outline seen from above, with no height and no floors in it. Floor area is a different number: it adds up every storey, so a two-storey house with a 90 m² footprint has about 180 m² of floor area. Planners, insurers, architects and GIS teams use the footprint to measure lot coverage, flood exposure and solar potential.
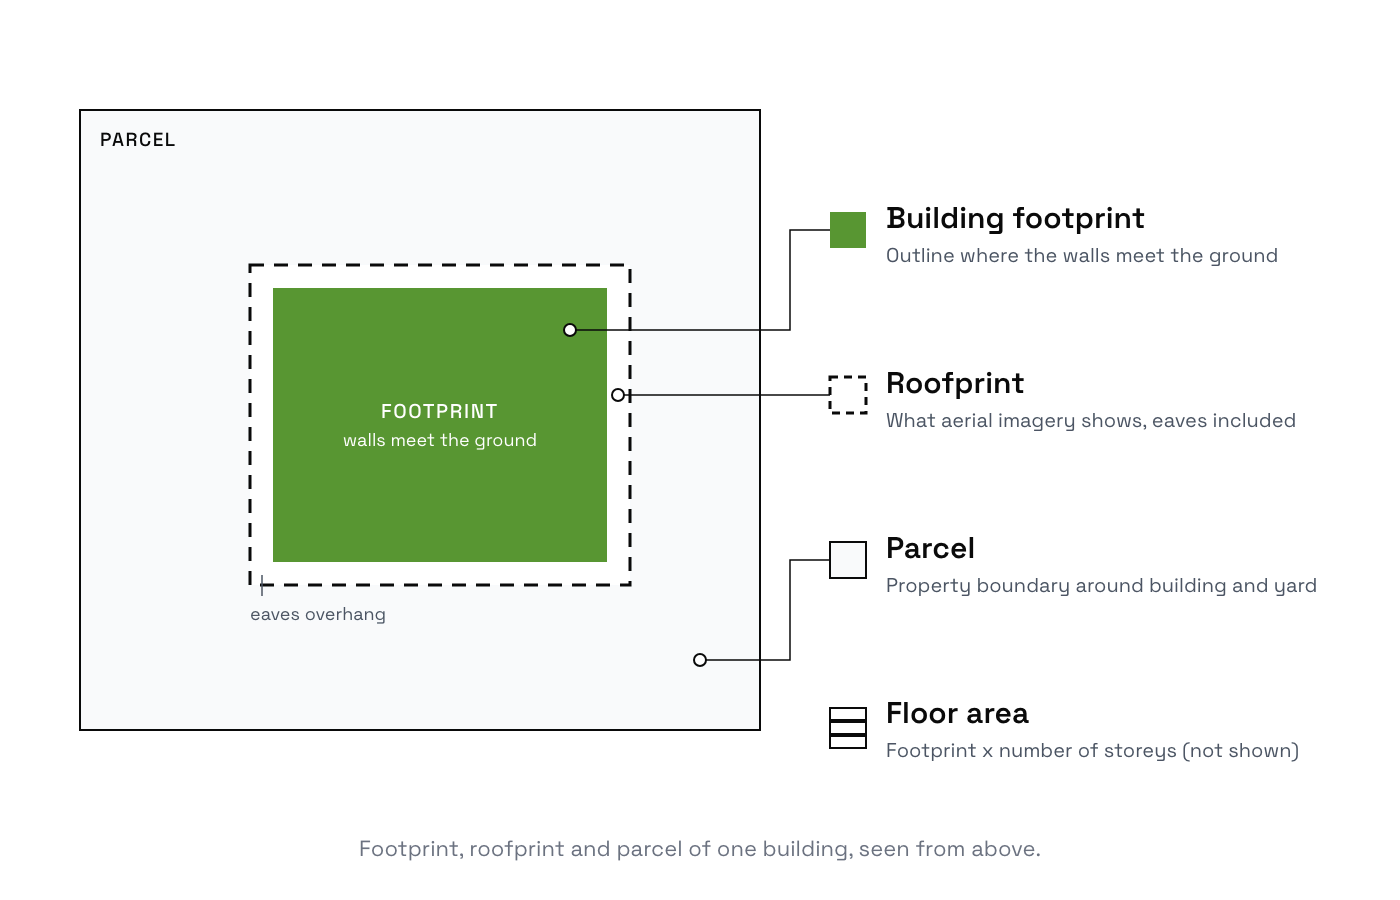
The word means the same thing on a site plan, in a zoning code and in a GIS layer. Two buildings with the same footprint can be a bungalow and a tower, because the number carries no height. And almost every footprint you can download is not measured at the walls at all, which is the second half of this page.
Building footprint vs floor area vs building area
Four numbers get asked for at four different desks, and none of them stands in for another.
| Term | What it measures | Typical unit | Where it appears |
|---|---|---|---|
| Building footprint | Ground area the building covers, at the wall base | m² or ft² | Site plan, GIS layer, cadastral or imagery-derived dataset |
| Building area, or building coverage | The same ground area, expressed against the lot | % of lot, or m² | Zoning code, setback and coverage rules |
| Gross floor area | Every enclosed level added up, roughly the footprint times the number of storeys | m² or ft² | Zoning code (floor area ratio), real-estate listing |
| Parcel, or lot area | The land the building sits on | m² or ft² | Cadastre, real-estate listing |
Take a two-storey house with a footprint of 90 m² on a 300 m² lot. Its gross floor area is roughly 90 × 2 = 180 m², before subtracting stairwells and wall thickness. Its building coverage ratio is 90 / 300, so 30%. Its floor area ratio is 180 / 300, so 0.6. Three different numbers, one building, and a zoning code will cap the second and the third separately. Wikipedia's entry on floor area ratio sets out the two ratio definitions this table follows.
What counts as part of the footprint
The footprint is a projection at ground level, so the test for any element is simple: does it stand on the ground, and is it inside the outer wall line? That settles the most common question at once: a roof overhang is not part of the footprint, because the outline follows the wall base and the eaves sit outside it.
| Element | In the footprint | Why |
|---|---|---|
| Outer walls, measured at the base | Yes | The outline is drawn round them |
| Attached garage | Yes | Enclosed and standing on the ground |
| Covered porch, veranda or carport | Usually yes | It has a roof and posts that reach the ground |
| Cantilevered balcony or overhanging upper floor | Usually no | Nothing stands on the ground beneath it |
| Eaves and roof overhang | No | The roof edge is not the wall base |
| Enclosed courtyard | No, it is subtracted | The polygon carries an interior ring |
| Basement wider than the storey above | No | The projection is taken at grade |
| Detached shed or garage | No, it is a footprint of its own | One outline per building |
Three rows move between jurisdictions, so check them rather than assume: covered porches and carports, cantilevered upper floors, and whether an eaves projection under a set distance is ignored. The code definitions Law Insider collects include one that excludes "cantilevered covers, porches or projections" and another that counts "cantilevered portions of a building". Your local zoning code is the authority, and it is the document a permit is judged against. Everything else on that list follows from the definition and holds anywhere.
How to calculate a building footprint area
Three starting points get you there, and the arithmetic changes with each one.
From a plan or a survey
Multiply the outer length by the outer width of each rectangular section, add the sections together, then subtract any courtyard or internal void. An L-shaped house splits into two rectangles. Measure to the outside face of the wall, not to the inside and not to the eaves.
From a GIS polygon
Reproject the layer to a projected, metric CRS suited to the area, never EPSG:4326. Open the field calculator, add a new field, and enter the expression $area. QGIS returns the value in the CRS's linear unit squared, usually square metres. An area computed in degrees still looks like a number, which is why this step is the one people skip and regret.
From imagery, with no polygon yet
Digitize the outline by hand, or detect it first. Detecting building footprints in QGIS covers that step. Once you have a polygon, measure it with the GIS method above.
Here is a worked example. An L-shaped house has a main block of 12 m × 8 m and a wing of 5 m × 4 m, both measured to the outside of the walls. Split it into those two rectangles: 12 × 8 = 96 m² and 5 × 4 = 20 m². Add them: the footprint is 116 m². If the same house had a 2 m × 3 m open courtyard inside its walls, you would subtract 6 m² and get 110 m². In feet, the method is identical and the answer comes out in square feet.
For lot coverage, divide by the parcel area and multiply by 100: a 90 m² footprint on a 300 m² lot is 30% coverage. When a code sets a maximum building footprint, it is almost always written as that percentage rather than as an absolute area, so you need the parcel polygon as well as the building one.
How big a house footprint is, measured on 8,511 houses
A house footprint is the same measurement applied to a home: the ground its outer walls enclose, attached garage included, not the garden or the plot around it.
A detached house in a French suburb covers a median of 113 to 123 m² of ground and about a quarter of its plot, and only a little over half of these houses have a second storey. We measured every single-dwelling house in two communes on 23 September 2026: Olivet, south of Orléans, and Saint-Jean, north-east of Toulouse.
| Olivet (Loiret) | Saint-Jean (Haute-Garonne) | |
|---|---|---|
| Houses measured | 5,377 | 3,134 |
| Median footprint | 113 m² | 123 m² |
| Middle half of houses | 89 to 140 m² | 84 to 150 m² |
| One storey / two storeys | 40% / 58% | 43% / 56% |
| Median floor area, footprint × storeys | 173 m² | 162 m² |
| Median plot holding one house | 567 m² | 571 m² |
| Median share of that plot covered by buildings | 23% | 25% |
| Plots more than 30% covered | 26% | 27% |
Two things follow for your own arithmetic. Floor area averages 1.6 times the footprint here, not 2, because four houses in ten have a single storey. And the 30% coverage in the example above already puts a house among the most built-over quarter of these plots.
How we measured this
Footprints are IGN BD TOPO building polygons (June 2026 edition), kept when the use is residential with exactly one dwelling, leaving out light structures and anything under 20 m², with area computed in Lambert-93. Storeys are BD TOPO's nombre_d_etages, which IGN takes from the tax files and which counts the ground floor but not a basement. Plots are the Etalab cadastre parcels of June 2026. We kept the 4,903 and 2,946 parcels holding exactly one house and counted every building inside them, sheds and garages included. Two suburbs of two French cities are not France, and a tax-file storey count misses converted attics.
Footprint or roofprint: what you actually downloaded
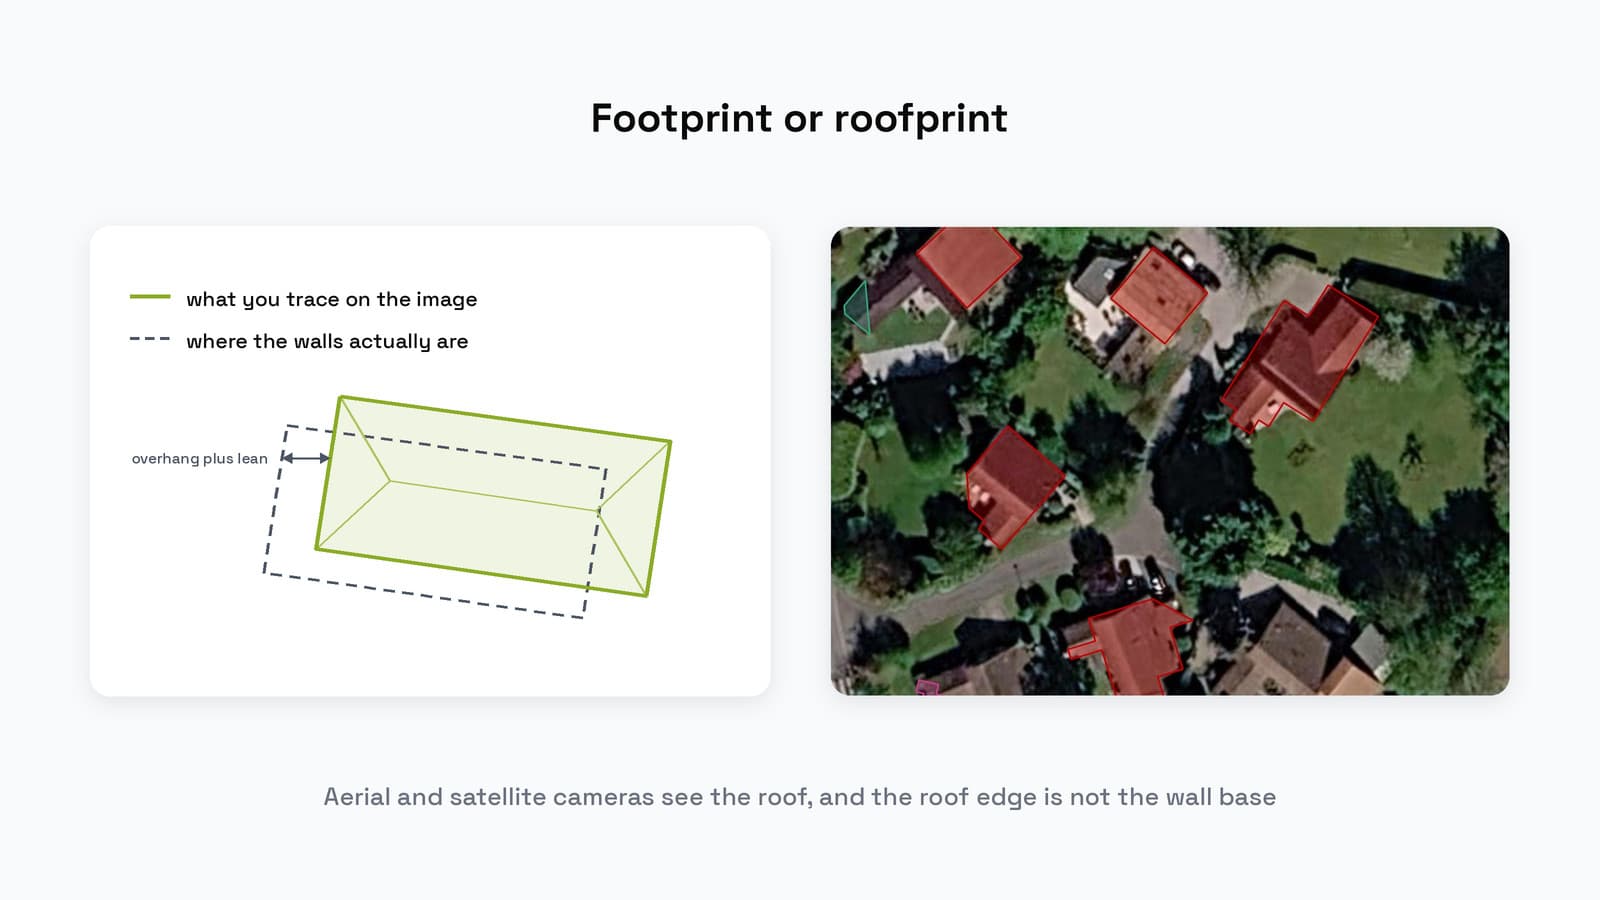
On the same detached houses, Microsoft's machine-learning polygons cover a median 19% more ground than the cadastre's wall outline in Olivet and 31% more in Saint-Jean, while OpenStreetMap matches the cadastre almost exactly. The difference is what each one traced. Aerial and satellite cameras see the roof. A model or a person tracing that image draws the roof edge, and the roof edge is not the wall base. Most open building datasets are built that way, so most polygons labelled footprint are really roofprints.
Three things pull the two apart. Eaves and overhangs push the roof outward: 30 to 80 cm all round a 10 × 12 m house adds 11 to 32% to its area, the size of the gap we measured. Lean, the sideways displacement of anything tall in an off-nadir image, moves a whole tower sideways by metres. And a carport, a veranda or a petrol station canopy is a roof with no walls under it at all.
The publishers say so themselves. Overture's buildings guide writes the geometry as "expected to be the most outer footprint, roofprint if traced from satellite/aerial imagery". Google's FAQ says its model "is trained to detect building rooftop rather than base", so on high-rises the polygon sits where the roof appears, not where the building stands. The OpenStreetMap wiki defines a building by its roof too, and allows one to be mapped as a single node.
France is the exception worth knowing. In both communes we measured, 97% and 98% of OpenStreetMap buildings carry a cadastre source tag: they were imported from the land registry, not traced, so they follow the walls. Microsoft's model traced the roof, and on more than a third of Saint-Jean's detached houses it drew one polygon more than one and a half times the house, from which the house's own area cannot be read at all.
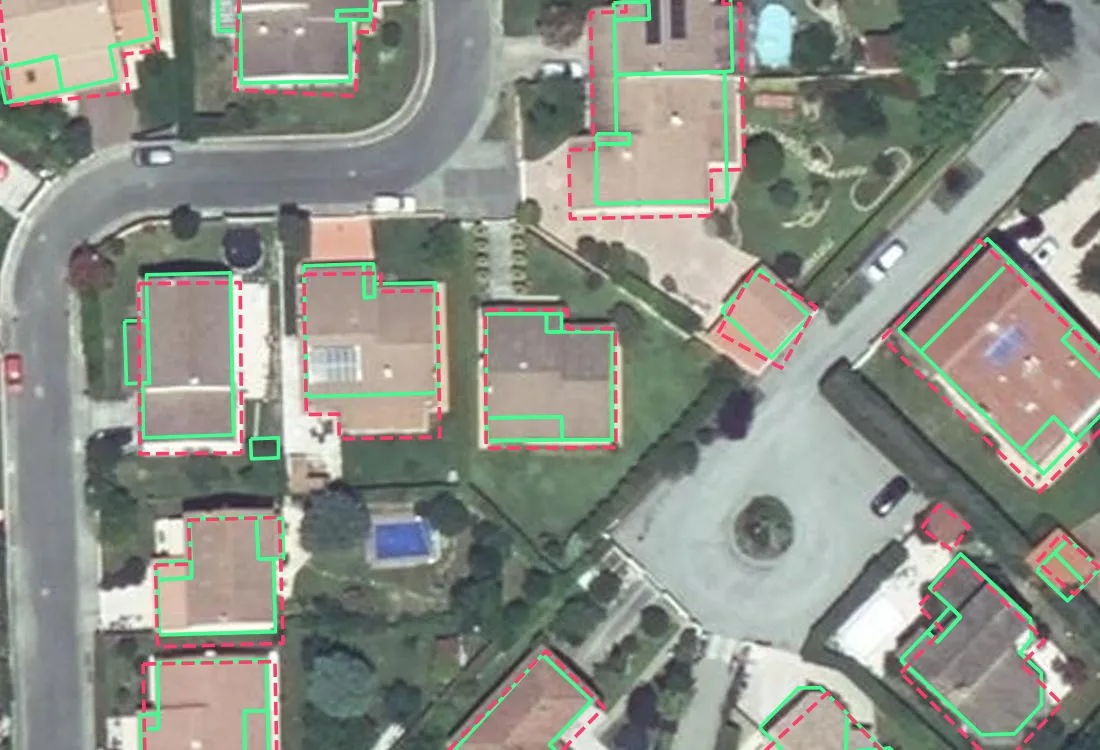
The table puts both communes side by side, counting only houses with no other building within 1 m, so an attached garage the cadastre draws separately cannot widen the gap.
| Detached houses, compared with the cadastre wall outline | Olivet | Saint-Jean |
|---|---|---|
| Houses compared | 3,974 | 2,678 |
| OpenStreetMap within 5% of the cadastre area | 93% | 99% |
| Microsoft within 5% of the cadastre area | 5% | 2% |
| Microsoft one-to-one match, median extra area | +19%, or 21 m² | +31%, or 43 m² |
| Microsoft polygon over 1.5 times the house | 23% | 36% |
How we measured this. The reference is every BD TOPO house whose outline IGN took from the cadastre, which IGN's own documentation says is drawn at the ground. Against each, we took the OpenStreetMap polygon (Overpass) and the Microsoft polygon (its France files) with the largest overlap on 23 September 2026, a match when the overlap covers half of both. Microsoft's imagery can be years older than the cadastre, and a gap on one house does not say which of the two is wrong there.
Two more distinctions cost me an afternoon each. A parcel is a legal object, the land somebody owns, and confusing it with a footprint counts a garden as a roof. And terraced housing breaks more pipelines than anything else here: eight houses share walls, so a detector returns one polygon and a cadastre returns eight. Neither is wrong, so decide which one your analysis needs before you count anything.
Why the difference matters
Solar potential wants the roof, so a roofprint is the right shape there. Ground sealing, flood exposure, lot coverage and setback compliance want the base, and on the houses above a roofprint overstates them by a fifth to a third. That error does not average out: it is on nearly every building, in the same direction.
Where to get building footprint data
Building footprints, in the plural, usually means a dataset: one polygon per building for a whole town, country or continent. Six free sources cover most needs. Everything in this table was read from the publisher's own page, first on 23 August 2026 and again on 27 September 2026.
| Source | Coverage | Licence | Vintage | Geometry | Format and access |
|---|---|---|---|---|---|
| OpenStreetMap | Global, and as complete as the local mapping community made it | ODbL 1.0 | Live, whatever the map says at the moment you query it | Hand-drawn, so squared corners and real attributes, but traced from imagery in most places | Loaded straight into QGIS with QuickOSM, or an Overpass query |
| Microsoft Global ML Building Footprints | Global. 1.4B buildings from Bing Maps imagery flown between 2014 and 2024, across 30,340 tiles in 225 regions | CDLA Permissive 2.0 | Refreshed 13 August 2026 | Model output. Height on a subset, confidence score on the newer footprints | Line-delimited GeoJSON in .csv.gz files, listed in dataset-links.csv per country and quadkey, or the Planetary Computer |
| Google Open Buildings v3 | Africa, South Asia, South East Asia, Latin America and the Caribbean. 1.8B detections over 58M km². Not Europe, not North America, not Australia | CC BY 4.0 or ODbL 1.0, your choice | Inference run in May 2023 | Model output, with a confidence score and a per-region precision threshold table | CSV with WKT polygons, one file per S2 cell (178 GB in all), Earth Engine, or 20 curated country files on HDX |
| Overture Maps buildings | Global, merged from the sources above plus Esri Community Maps and national data | ODbL | Monthly. Current release 2026-09-23.0 | Conflated. OpenStreetMap wins where it exists, model output fills the rest, matched at 50% overlap | GeoParquet on AWS or Azure, or the overturemaps CLI |
| IGN BD TOPO (France) | France and the overseas departments, the bâti theme | Licence Ouverte 2.0 | Quarterly, last published 31 July 2026 | Mixed: cadastre outlines drawn at the ground, plus outlines traced round the roof from aerial photos, flagged per building in origine_du_batiment. 3D, with a height per building | Shapefile on data.gouv.fr, by department |
| USA Structures (United States) | All US states and territories, structures larger than 450 sq ft | Open access from FEMA. The page sends you to each layer's own terms of use | Updated once a year, released in batches of states | Model output, extracted from satellite imagery by FEMA and Oak Ridge National Laboratory | File Geodatabase per state, or a feature service on Esri's Living Atlas |
For another country, start with its national mapping agency or land registry. That is where a cadastre outline drawn at the walls usually lives, as BD TOPO shows for France.
Read the licences before you pick. ODbL is share-alike, so a derived database goes back out on the same terms, and that clause has killed more than one client deliverable. CDLA Permissive 2.0 and CC BY 4.0 only ask for credit. Google publishes under both CC BY 4.0 and ODbL and lets you choose.
IGN BD TOPO is the only one drawn mostly at the walls, and even it mixes the two. In Olivet, 86% of its buildings come from the cadastre and are drawn at the ground, while 14%, a quarter of the built area, were traced round the roof from aerial photos. Filter on origine_du_batiment before you measure coverage. It is also the only one that ships a height per building. If you need floor area, a storey count or a height is what you are missing, and Microsoft carries height on a subset.
The three global sources disagree about the same ground, and the disagreement is the useful part.
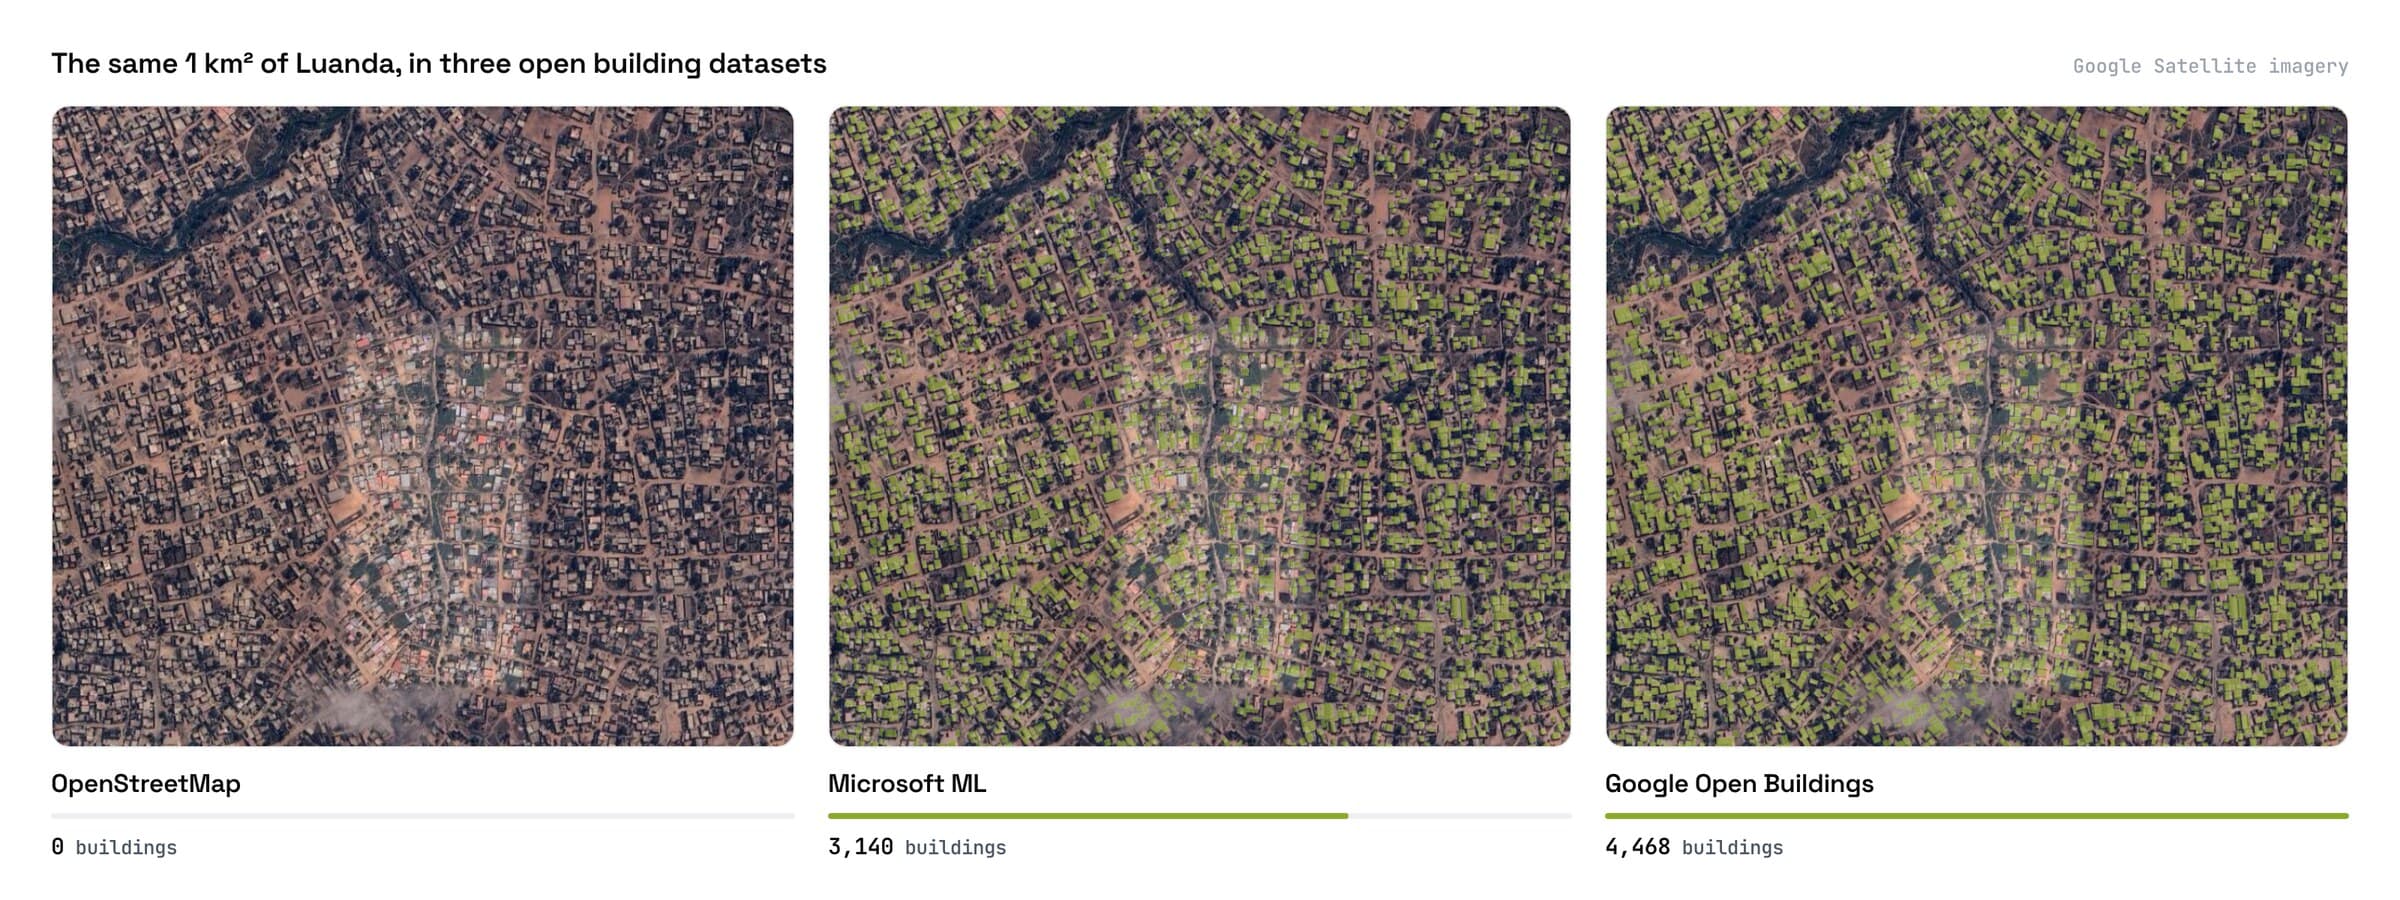
If you only want a file for one area, our free building footprint downloader reads all three global sources for a box you draw and hands you GeoJSON with the attribution written inside it. No account, and the box caps at 25 km². If none of these sources covers your area, or you need footprints from your own drone or aerial imagery, AI Segmentation extracts them in QGIS, and detecting building footprints in QGIS walks through every method.
How to extract footprints for your own area
Four situations send you past all six sources, and I hit all four in a normal year. Your area is not covered, because Google stops at the edge of the Global South, Microsoft goes where Bing imagery went, and OpenStreetMap goes where somebody bothered. The data is older than the question, since Google Open Buildings ran its inference in May 2023, so a subdivision finished in 2025 is not in it. Damage assessment and construction monitoring need two dates, and open data gives you one. Or you need a shape nobody publishes, such as roof planes for a solar study, or buildings out of your own 5 cm drone flight where a 30 cm global model has nothing useful to say.
Then you extract your own. Four of the five options below run inside QGIS, and the step-by-step version covers each one in full.
 , and the
 | Option | Runs on | Imagery leaves your machine | Price | The catch |
|---|---|---|---|---|
| Our downloader | Your browser, no account | No, only the bounding box | Free | Returns only what publishers already mapped |
| Hand digitizing in QGIS | Your machine | No | Free, your time | Minutes per building |
| A cloud segmentation model (ours) | Our servers in Europe | Yes for Automatic, no for the local Semi-Auto model | Free for 1.5 km² a month, then €39 a month for 100 km² | Returns vents and skylights too, filtered out by confidence and area |
| Deepness with your own ONNX model | Your machine, CPU or your CUDA setup | No | Free, Apache 2.0 | Ships no model, and one trained on 25 cm imagery reads a 5 cm drone flight as noise |
| Mapflow by Geoalert | Their servers in the cloud service, enterprise on-premise offered | Yes in the cloud service | 10 credits per km² at $0.10 a credit, rounded up to whole km² | Priced in credits, not a flat plan |
The cloud option
We build the third row, AI Segmentation, so weigh it against the other four accordingly.
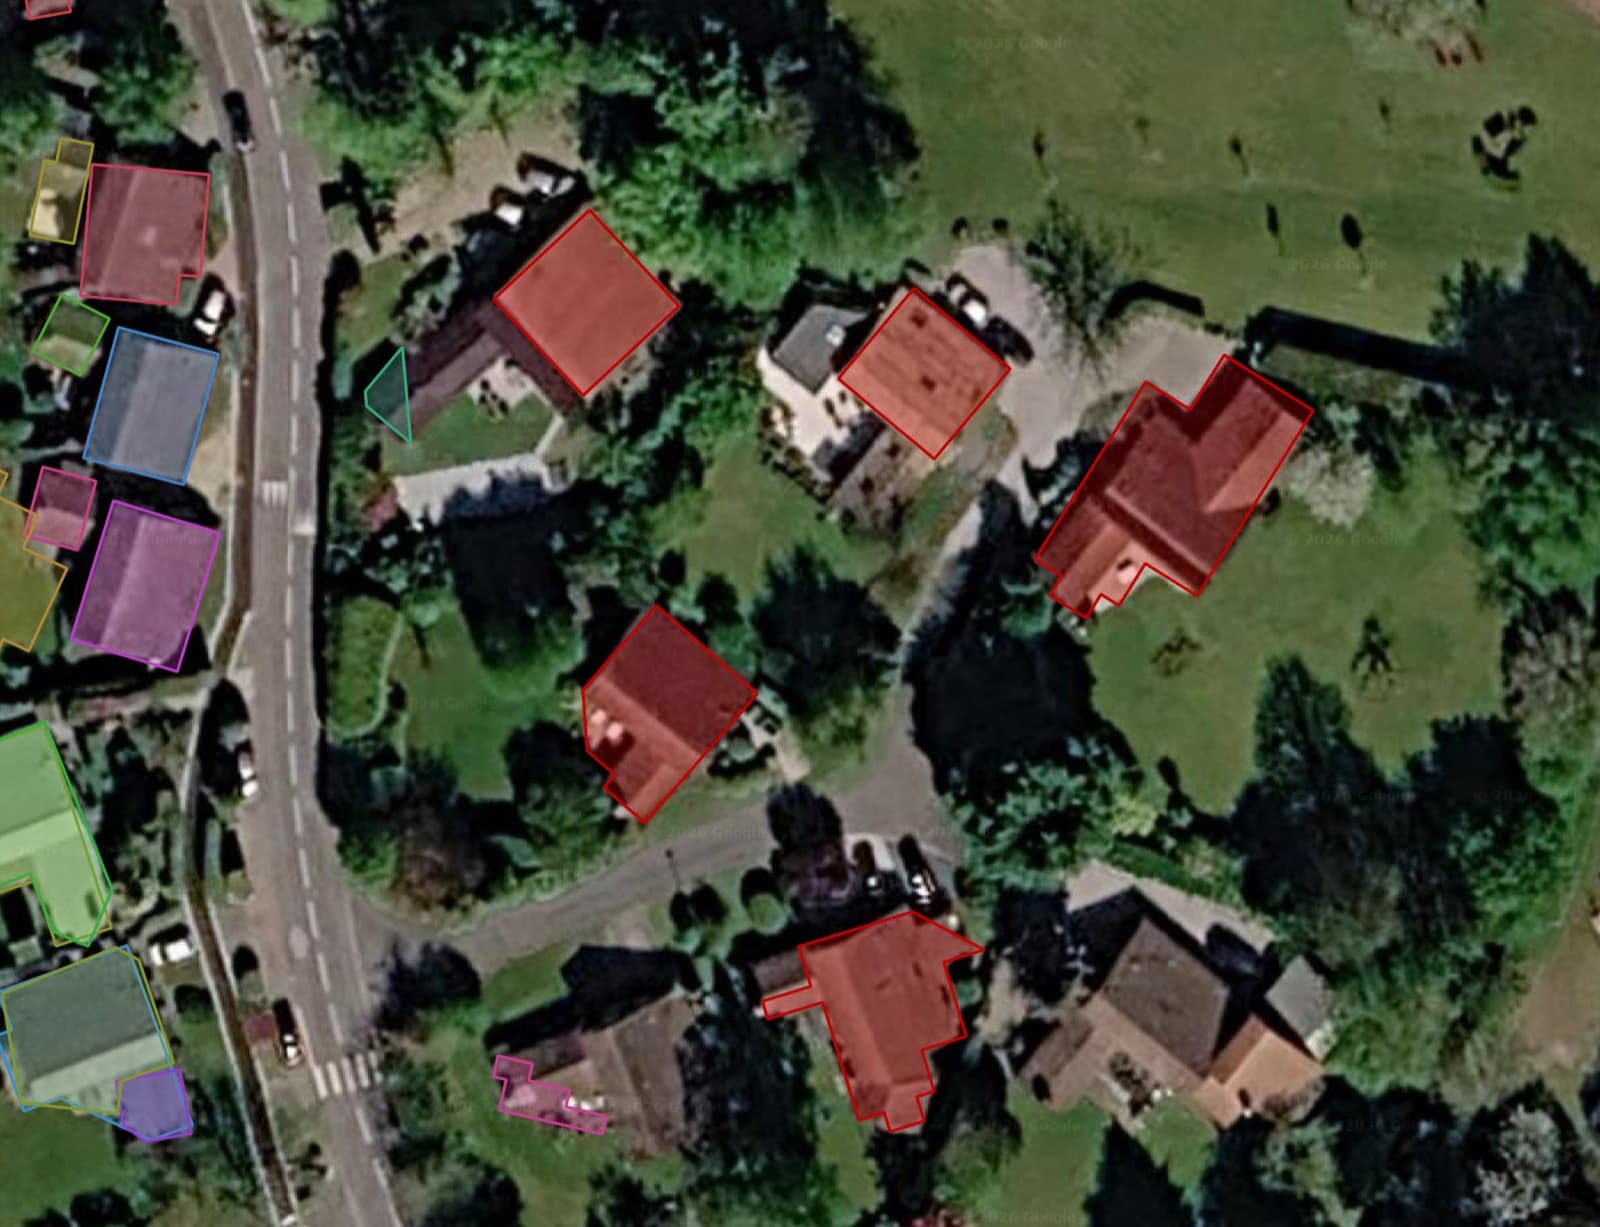
It installs from the QGIS plugin manager and needs a free account, no GPU, no weights download and no Python environment. In goes a zone over any raster or basemap plus a word such as building. Out comes a styled GeoPackage, one polygon per object, each carrying a class, a confidence score and an area you can read straight into a coverage ratio.
Check the layer before you trust it
Four checks, in the order I run them. They take about fifteen minutes and they have saved me from shipping a wrong number more than once.
Count against a sample you digitise yourself
Pick one square kilometre and digitise every building in it by hand. Compare the count to the layer. A ratio under 0.9 or over 1.1 means the layer answers a different question than you think, and you want to know that before the analysis rather than after.
Look hard at the terraced rows
Zoom to the densest terraced street in your area of interest and count the polygons against the front doors. This one check tells you whether the dataset splits shared walls, and it decides every per-building statistic you are about to compute.
Find the newest construction
Open the most recent development you know of. If it is absent, you have just measured the real vintage of the data, which is more honest than the date on the download page.
Compare a roof to its walls
Pick one tall building. If the polygon sits off the base of the walls, you have roofprints with lean, and any ground-sealing or setback work needs a correction or a different source.
What to remember
A building footprint is the ground area a building covers, measured at the outside of the walls where they meet the ground.
An attached garage and a covered porch on posts are usually in it. An eaves overhang, a cantilevered balcony and an enclosed courtyard are not, and your local zoning code settles the porch.
Lot coverage is the footprint divided by the parcel area. In the two French suburbs we measured, the median house covers 113 to 123 m², about a quarter of a 570 m² plot, and floor area averages 1.6 times the footprint.
Most footprints you can download were traced from a photograph taken above, so they follow the roof: on detached houses, Microsoft's polygons came out a median 19 to 31% larger than the cadastre's wall outline.
An area computed in EPSG:4326 comes back in degrees and still looks like a number, so reproject to a metric CRS before you read $area.
Try it free in QGIS, no card needed
Questions people ask
What does footprint mean in construction and architecture?
The same thing it means in GIS: the ground area the building covers, drawn round the outside of the walls at ground level. On a site plan it is the shape the building occupies on the lot, and it is what a zoning code caps as a percentage of the parcel. Architects also use "footprint" loosely for the overall size of a design, but the measured number is always the ground projection.
Does a building footprint include the roof overhang?
No. The footprint is measured at the base of the outer walls, and an eaves overhang sits above the ground rather than on it. A covered porch or a carport usually does count, because its posts reach the ground. Some codes ignore an eaves projection under a set distance and some do not, so check the local rule for anything near a setback limit.
Is a building footprint the same as a roofprint?
No. The footprint is the outline where the walls meet the ground, and the roofprint is the outline of the roof above it. Eaves push the roof outward by 30 to 80 cm on a house, and lean in an off-nadir image can move a tall building's roof sideways by metres. Almost every downloadable dataset traced from imagery gives you the roofprint.
How big is a typical house footprint?
In two French suburbs we measured in September 2026, the median single-dwelling house covers 113 m² in Olivet (5,377 houses) and 123 m² in Saint-Jean (3,134 houses), and half of them fall between about 85 and 150 m². About 57% have two storeys, so the median floor area is 162 to 173 m².
What is the difference between building footprint and floor area?
A footprint is the ground area a building covers, counted once. Floor area adds up every enclosed level, roughly the footprint times the number of storeys. Building area, or building coverage, usually means the same ground area as the footprint, expressed against the lot as a percentage.
How do you calculate a building footprint area?
From a plan, multiply the outer dimensions of each section, add them and subtract courtyards. From a GIS polygon, reproject to a metric CRS and read the $area expression. From imagery with no polygon yet, digitize or detect the outline first, then measure it the same way. For lot coverage, divide the result by the parcel area and multiply by 100.
Where can I download building footprints for free?
OpenStreetMap, Microsoft Global ML Building Footprints, Google Open Buildings v3 and Overture Maps are all free, IGN BD TOPO covers France under Licence Ouverte 2.0, and FEMA's USA Structures covers the United States. Each has its own licence and its own vintage, both in the table above. For one area you can also draw a box in our downloader and get GeoJSON from the three global sources at once.
Two pages take this further. GeoAI is the wider family these detection models belong to, and detecting building footprints in QGIS automatically is the step-by-step version of this page, with the filtering step that decides whether the layer is usable. For the tools themselves, including the local SAM-based options, see the AI plugin roundup and the QGIS AI hub.