How to Redesign a Street in QGIS: 5 Methods
Published
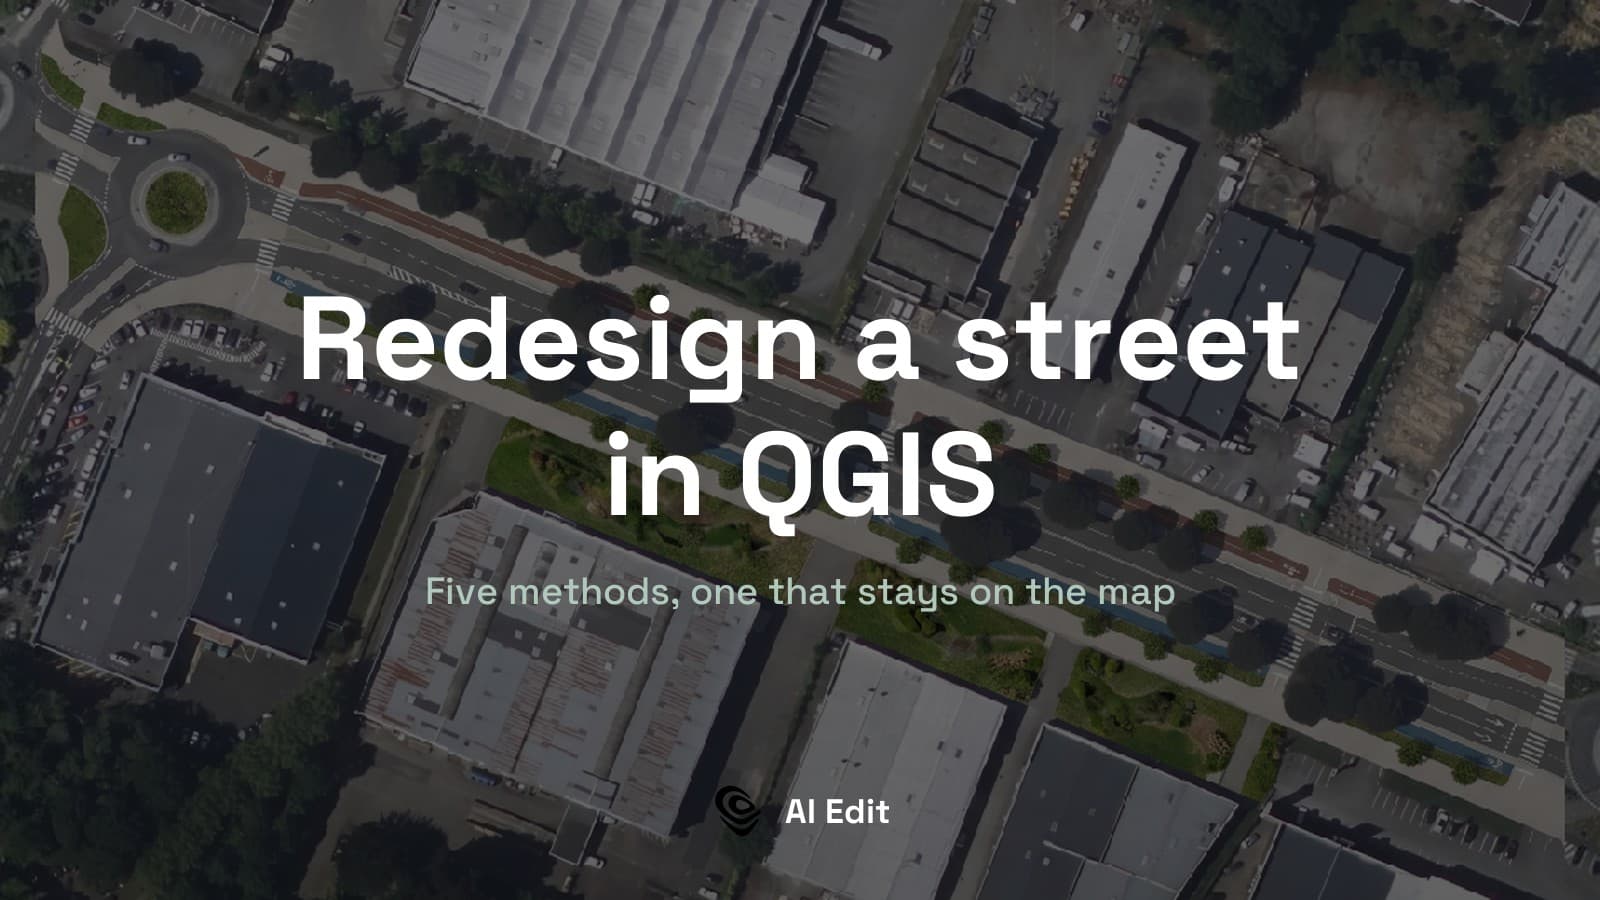
The fastest way to show a street rebuilt is to redraw the aerial photograph itself: outline the stretch of road in QGIS, describe the new layout in writing, and get the same view back with that layout in it. Four other methods get you there. What separates them is not how good the picture looks, but whether it still knows where it belongs on the ground once you have made it.
 , describe the new layout in writing, and get the same view back with that layout in it. Four other methods get you there. What separates them is not how good the picture looks, but whether it still knows where it belongs on the ground once you have made it.
| What you have | Method | Time or cost |
|---|---|---|
| A cross-section to explain, no site | Streetmix | Free, about 10 minutes |
| A site, and it has to stay on the map | AI Edit, our QGIS plugin | Free tier |
| A site, and time to draw it properly | Vector layers in QGIS | Free, half a day and up |
| A site, and a graphic designer | Export the map, paint it | Free tools, several hours |
| A screenshot and a deadline tomorrow | A general image generator | Free to cheap, minutes |
Method 1: Streetmix, for the cross-section
A free, open-source page in your browser. You drag lanes, pavements, cycle tracks, parking and trees into a strip and it draws the section with each width shown. The quickest way to settle an argument about what fits inside 18 m. It is not a map: no site, no coordinates, nothing you can put under your own layers.
Use it when: you are agreeing the section with colleagues. Skip it when: the question is about one specific place.
Method 2: A generative model inside QGIS
Aerial photography of your street. In France, IGN publishes BD ORTHO under the Licence Ouverte, loadable into QGIS as a WMS layer from https://data.geopf.fr/wms-r/wms. Everything below uses one stretch of the Route de Vannes at Orvault, near Nantes: a commercial strip with two carriageways, twin roundabouts and very large retail car parks.
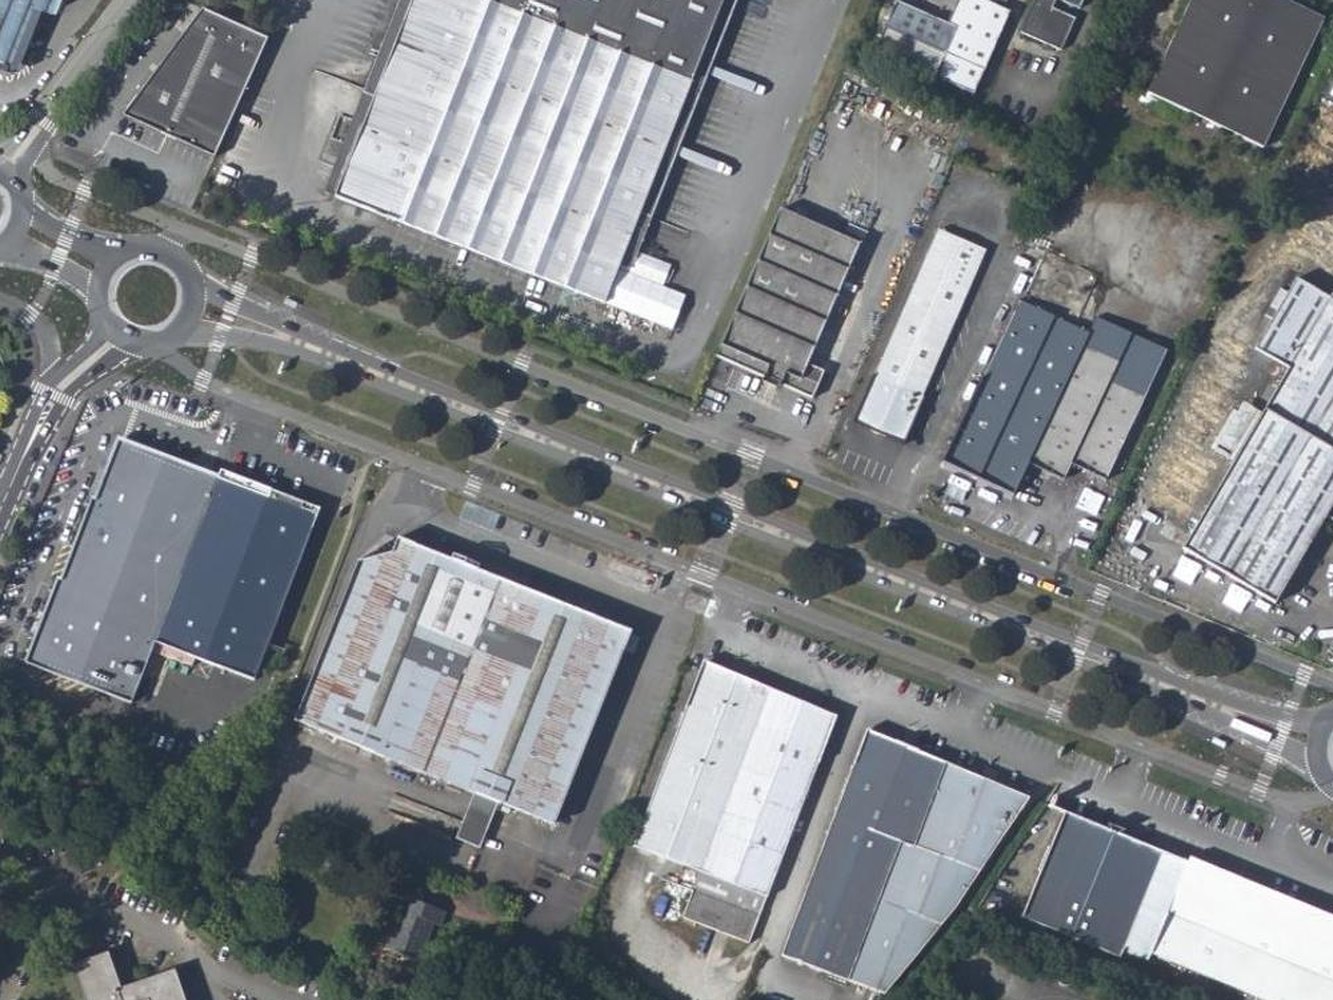
The dimensions you actually want. This matters more than the tool. A redesign described in adjectives comes out as a mood. One described in metres comes out as a design. The Global Street Design Guide, free from the Global Designing Cities Initiative, is where I take mine: a 3 m maximum travel lane, and worked examples such as the Boulevard de Magenta in Paris, where the pavement went from 4 m to 8 m and the crossing distance from 20 m to 12.8 m.
A precedent. Find two or three streets that already look like the one you want, and describe what they have. Nothing sharpens an instruction faster than a real example in front of you.
A generative model inside QGIS redraws the aerial photography on your screen from a written instruction. We build one of these, AI Edit. This section is about our own tool.
You outline the road, describe the new layout, and the result comes back as a map layer sitting exactly on the photograph it was built from, so your parcels, your network layers and your own drawings still line up with it.
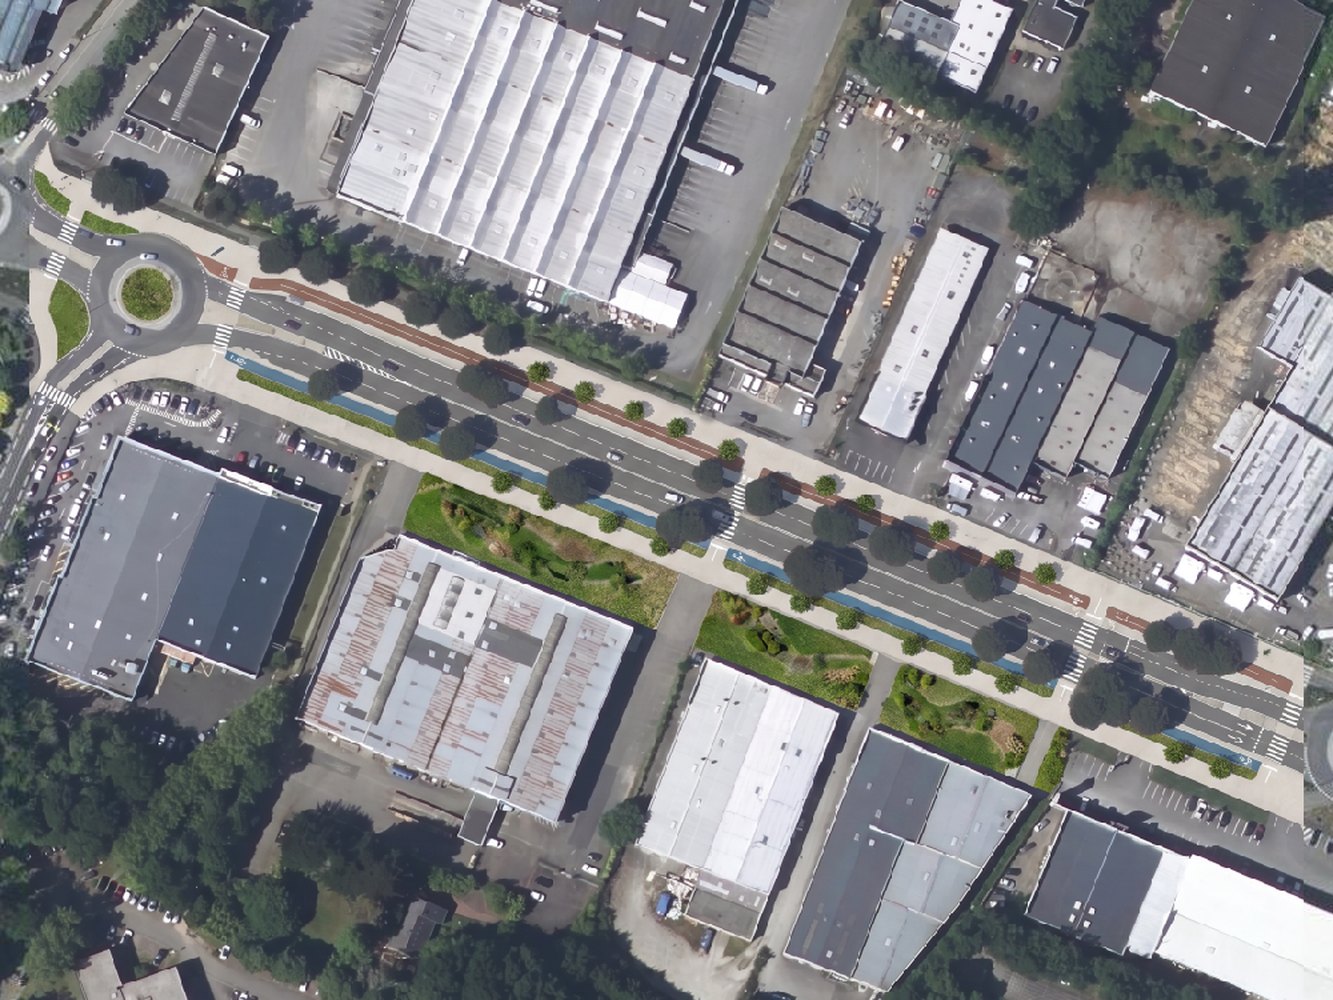
Here is the strip above as a complete street: carriageways narrowed to two 3 m lanes, the reclaimed asphalt turned into a protected cycle track each side, trees every 8 m, and the front row of each car park rebuilt as a planted forecourt with rain gardens.
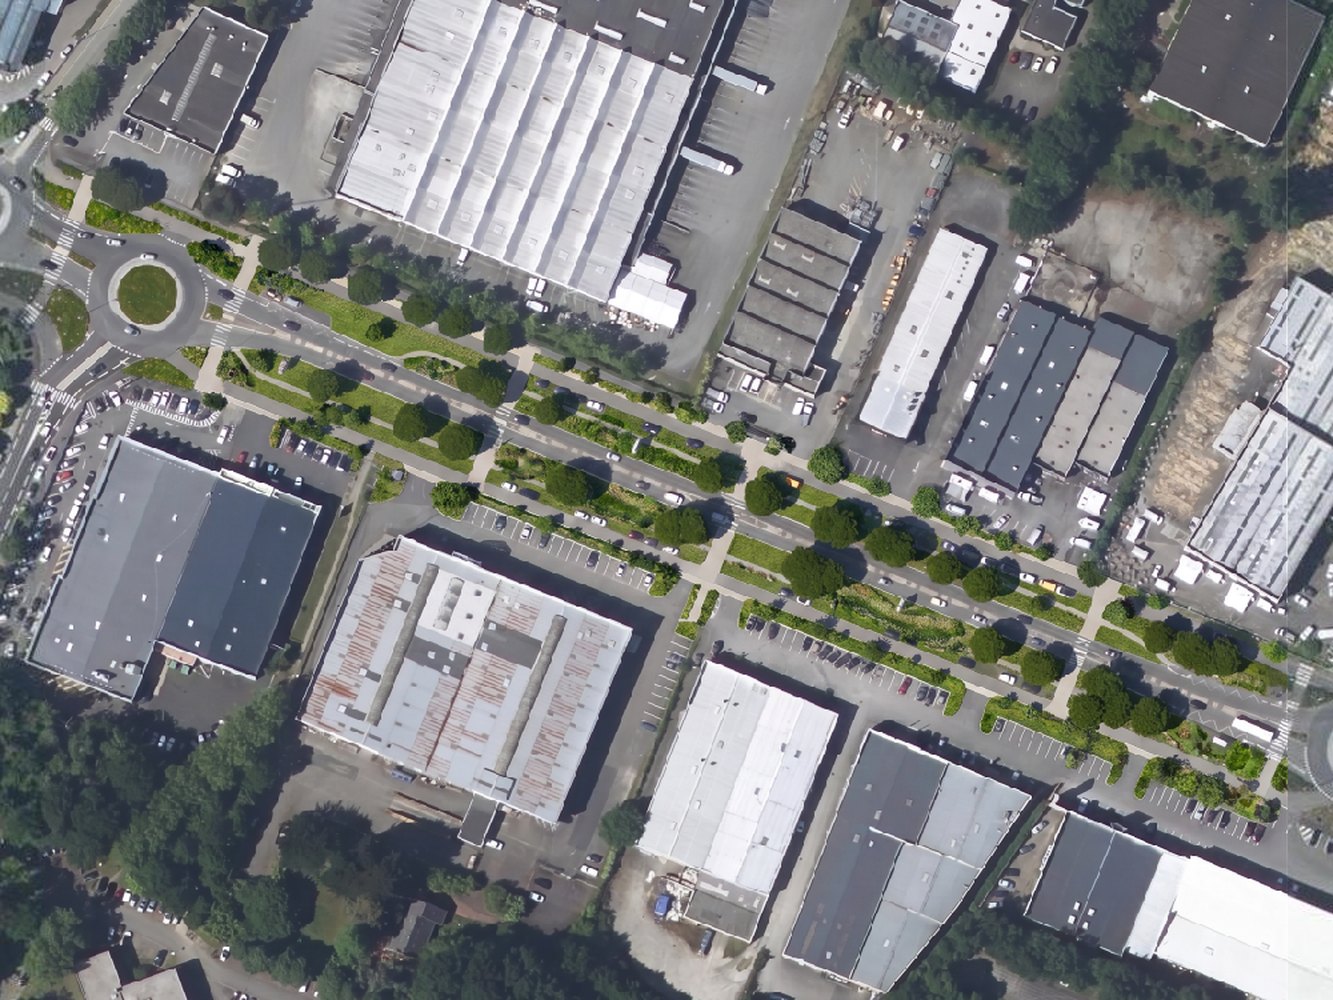
Same photograph, narrower question: leave the road alone, and turn only the front 8 m of every car park into public space.
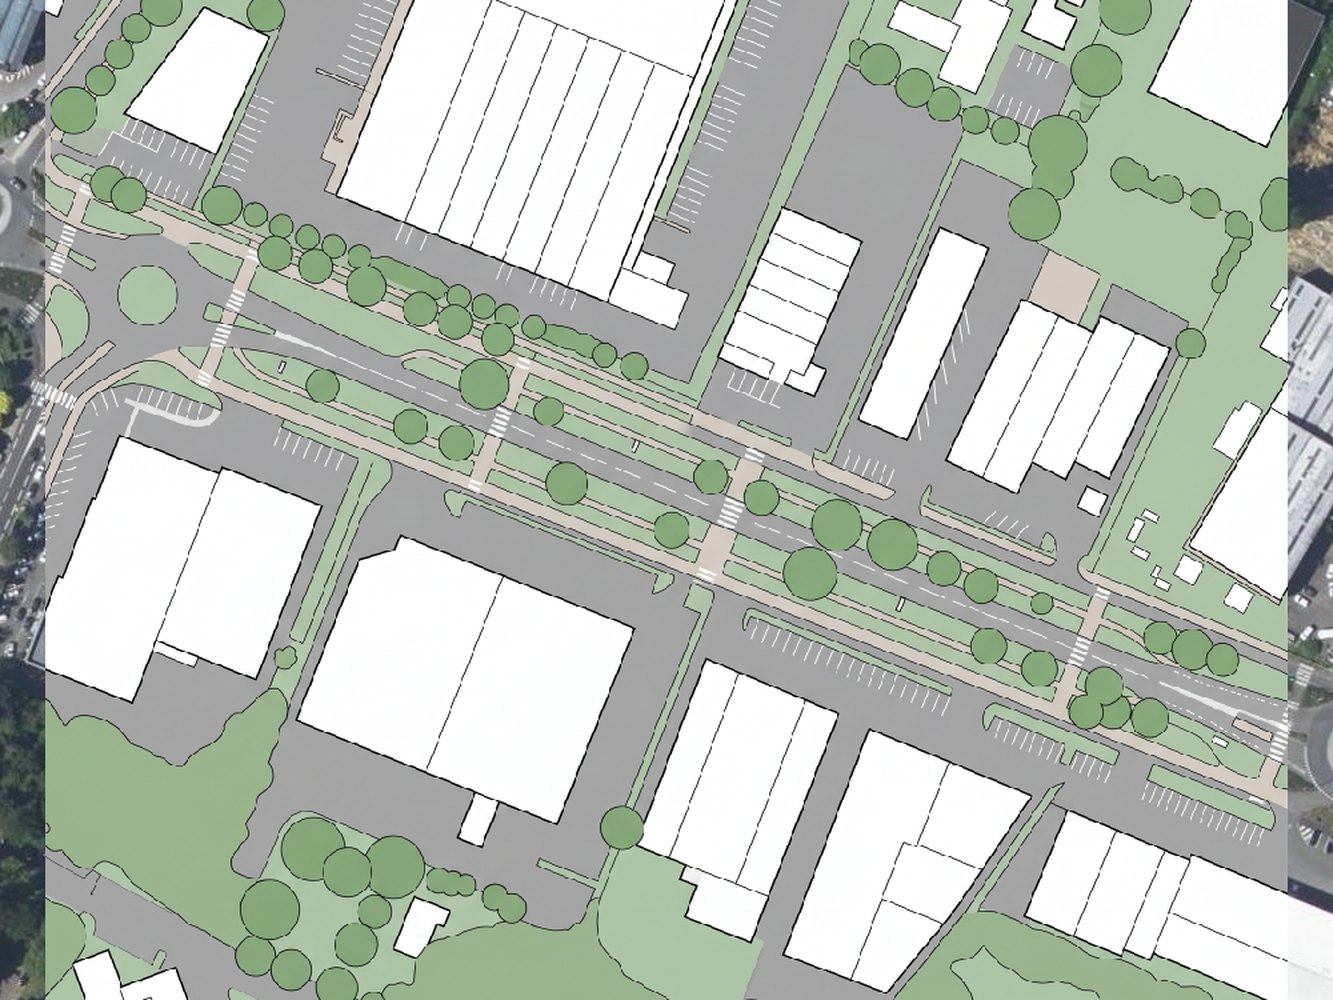
Same photograph again, asked for a drawing instead of a photograph.
Junctions
The junction is where a redesign is usually won or lost, and where written dimensions pay off most. Below, the twin roundabouts at the west end of the same strip, 136 m across. I asked for a single 5 m circulating lane around each island, every kerb brought inwards, each crossing cut to a straight run of 6 m at most, planted refuges instead of splitter islands, and the leftover asphalt turned to grass.
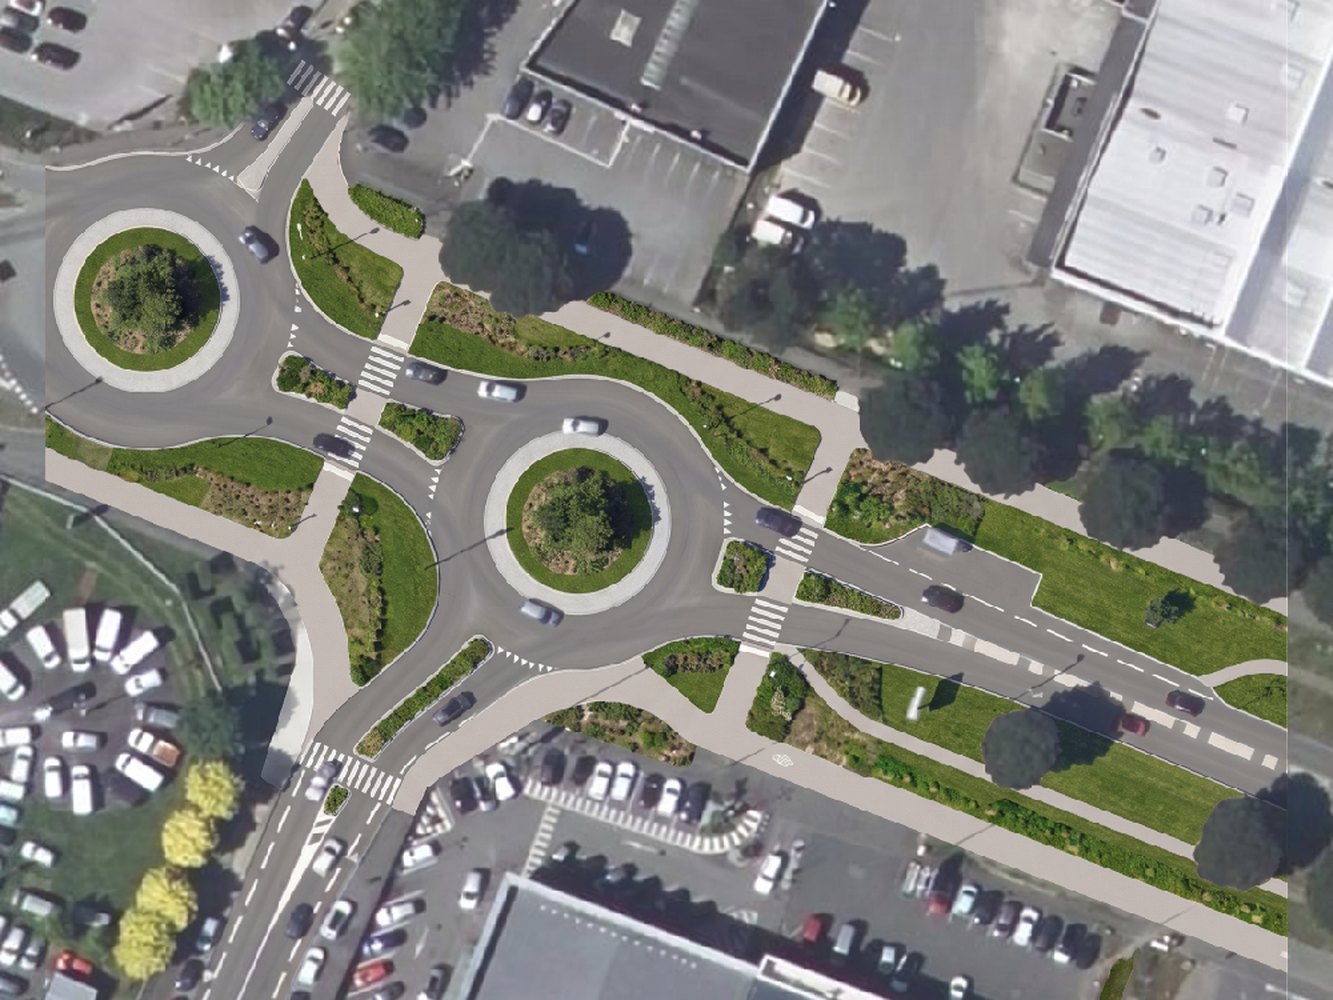
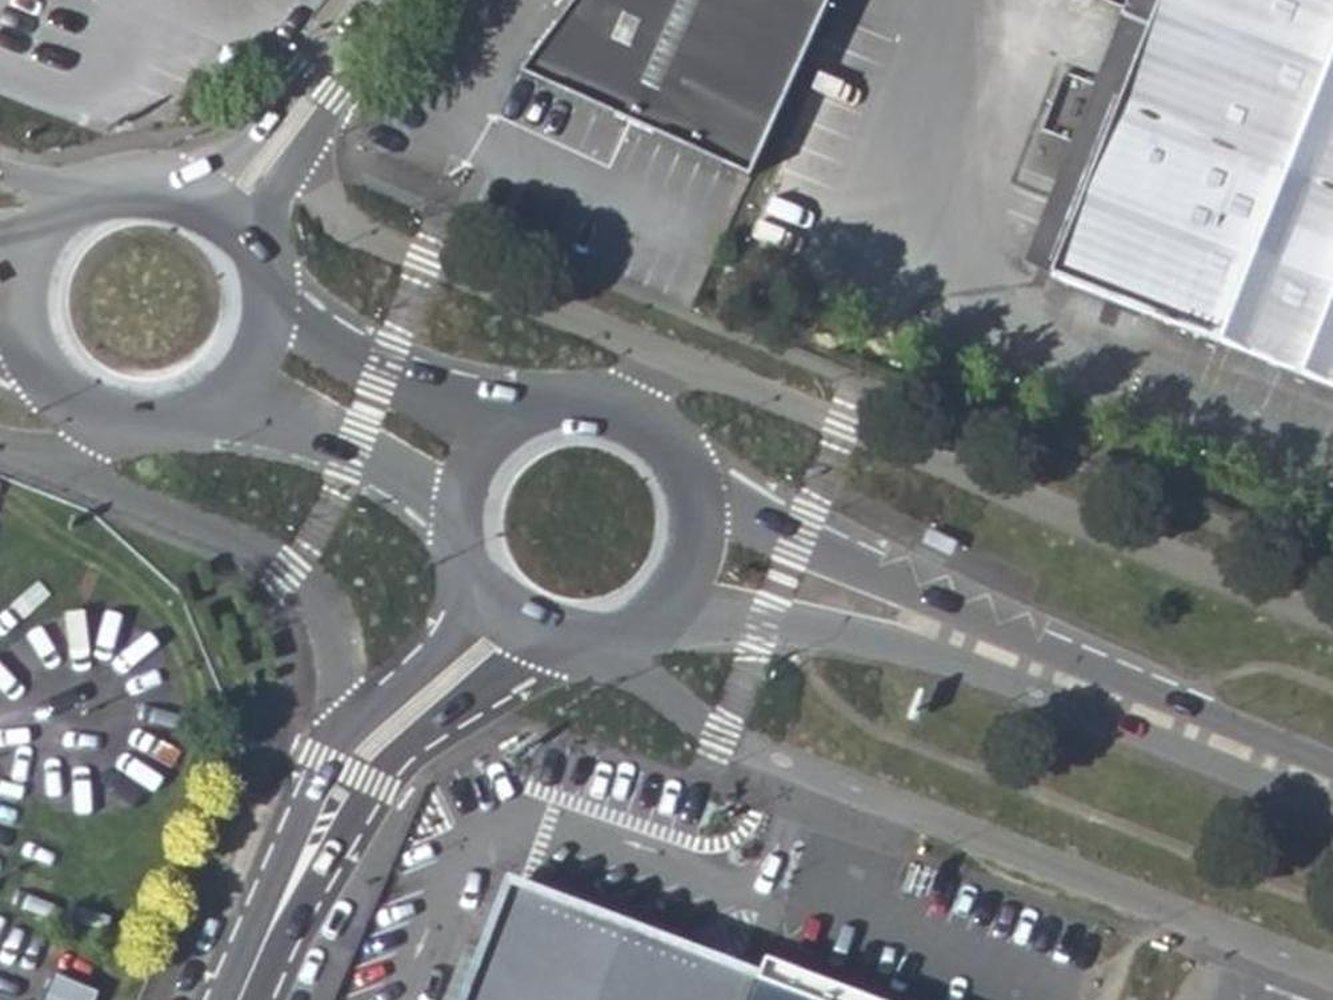
Look at the top left and right edges of that result: you can see where the generated rectangle stops and the untouched photograph resumes. That is the practical limit. Either generate the whole area you intend to show, or crop to the rectangle.
Use it when: you need several arguable options on a real site quickly, and the picture goes back on the map next to your own data.
Skip it when: the deliverable is a number, or a file an engineer will build from. The result is a picture, and nothing in it can be counted until you convert it into shapes. Skip it too if you need a view from the pavement: this works straight down, in 2D, and a 3D view is something we are building rather than something you can use today.
Two habits decide whether your result is usable. Name what must not move, with a sentence like "keeping every building, plot boundary, roundabout and mature tree exactly where they are". And give it metres: "narrow each carriageway to two 3 m lanes, build a 2 m protected cycle track each side, plant trees every 8 m" produces something you can put in front of a road engineer. "Make this street nicer" does not.
Method 3: Draw the proposal as vector layers in QGIS
The traditional answer, and still the only one that gives you a design rather than a picture of one. Create a polygon layer per element, digitise the new kerb lines, cycle track, planted strips and crossings over the photograph, style them, print through a layout. Everything it produces is real geometry: measurable, countable, and safe to hand an engineer.
Use it when: the drawing has to be measured or built from. Skip it when: you need four options for a steering group on Thursday. One careful option is half a day.
Method 4: Export the map and paint over it
Print the extent from the QGIS layout, open it in Photoshop, GIMP or Illustrator, paint the new street on top. Designers are fast at this and the results can be beautiful. What comes back is a flat picture: nothing measurable, and placing it back over the map means doing it by hand and living with the fact that it will not quite line up.
Use it when: the deliverable is a board or a brochure. Skip it when: it has to sit in a report next to a plan at a stated scale.
Method 5: A general image generator on a screenshot
Screenshot the map, drop it into an image generator, describe the change. Two minutes, often good on texture. But the generator has no reason to respect your geometry, so buildings drift and roads bend to make a nicer composition, and the file it returns has no idea where on Earth it belongs.
Use it when: you want a mood, fast, for something informal. Skip it when: anyone will compare the picture against the real site.
What to remember
If the answer has to be a design, draw it as vector layers and accept the days.
If it has to be a picture that persuades, generate it, and label it as a simulation.
The one reason to generate inside QGIS rather than in a browser is that the picture keeps its place on the map, next to the cadastre, the flood zone or the network you already have loaded.
Write the instruction in metres and name what must not move, or the result comes back as a mood.
Generate the whole area you intend to show, or crop to the rectangle, because the edge where the generated tile stops is visible.
Questions people ask
Can I put a generated street redesign in a public consultation document?
Yes, labelled as a simulation, never as a photograph. Our output is marked as AI-generated for that reason. Say in the caption which parts are proposed and which are existing, because on a good result the two are hard to tell apart, which is the point and also the risk.
Can I measure the new cycle track or count the new trees?
Not from the picture. A generated image is pixels, so nothing in it is an object the software can measure. Digitise the result by hand, or run a detection tool over it.
How large an area can I do at once?
Work at the scale of the thing you are showing. The strip figures here are 339 m across and the junction figures 136 m, and both hold their detail. Ask for a whole district and the markings, trees and parking bays all become approximations.
Sources
-
Global Designing Cities Initiative and NACTO, Global Street Design Guide, free download, read 31 August 2026. Built with experts from 72 cities in 42 countries. Source of the 3 m travel-lane maximum and the Boulevard de Magenta figures.
-
Streetmix, free and open source, checked live 31 August 2026.
-
Every figure was generated in QGIS on 31 August 2026 over IGN BD ORTHO, Licence Ouverte.
The complete AI Edit guide covers the plugin end to end, and the Google Earth AI alternative covers what changed when Google removed image generation from Earth. The QGIS AI hub links every guide we have.