How to Simulate a Flood in QGIS: 5 Methods
Published Updated
The quickest way to show a flood in QGIS is a digital elevation model and a threshold in the raster calculator: about five minutes, and an extent you can measure. Four other options exist, and the five split cleanly: two give you a measurable extent, one gives you an engineering answer, and two give you a picture that persuades. The most convincing picture is a generated aerial view, which takes about one minute. Neither is a substitute for the other, and this page is mostly about not confusing them.
 is a digital elevation model and a threshold in the raster calculator: about five minutes, and an extent you can measure. Four other options exist, and the five split cleanly: two give you a measurable extent, one gives you an engineering answer, and two give you a picture that persuades. The most convincing picture is a generated aerial view, which takes about one minute. Neither is a substitute for the other, and this page is mostly about not confusing them.
Three of these give you a map of the flood, which you can measure. Two give you a picture of it, which you cannot.
| What you need | Method | You get |
|---|---|---|
| The legally recognised flood zone | Géorisques PPRI or TRI layer | A map, free, minutes |
| Something to show, on your own site | AI Edit, our QGIS plugin | A picture that stays on the map |
| A rough extent you can measure | Elevation model plus a threshold | A map, free, 5 minutes |
| Depths and speeds for a real study | A hydraulic model | A map, days, a specialist |
| Something to show, any place will do | ChatGPT, Gemini or Midjourney | A picture, with no coordinates |
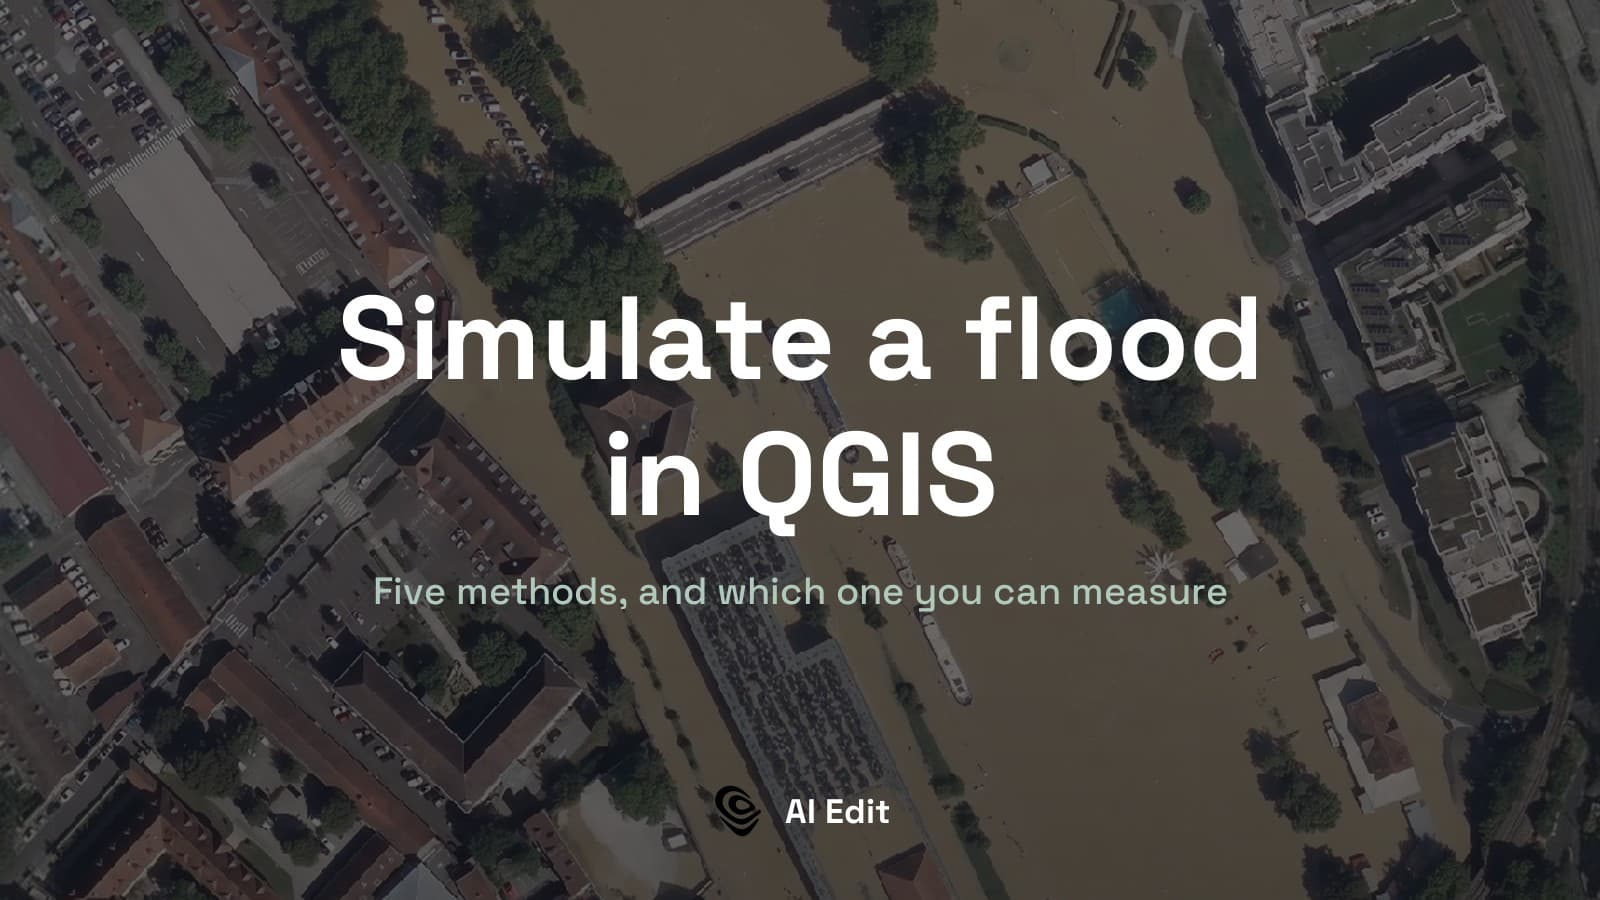
Everything below runs on one frame: 600 m of the Doubs through central Besançon, with the old town on its terrace to the left and the quays, the open-air pool and a riverside park on the right bank.
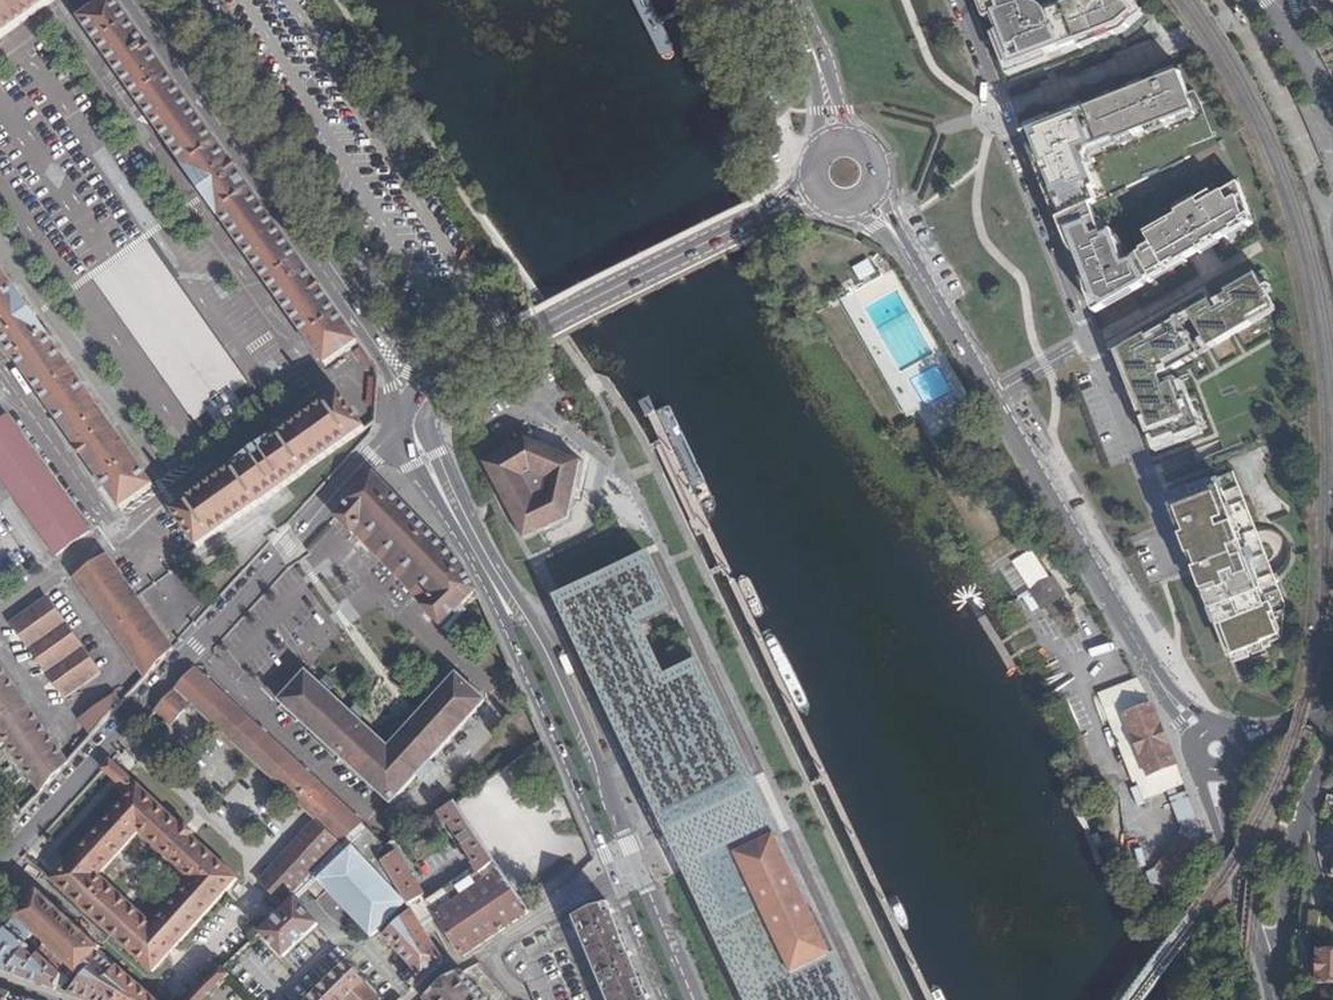
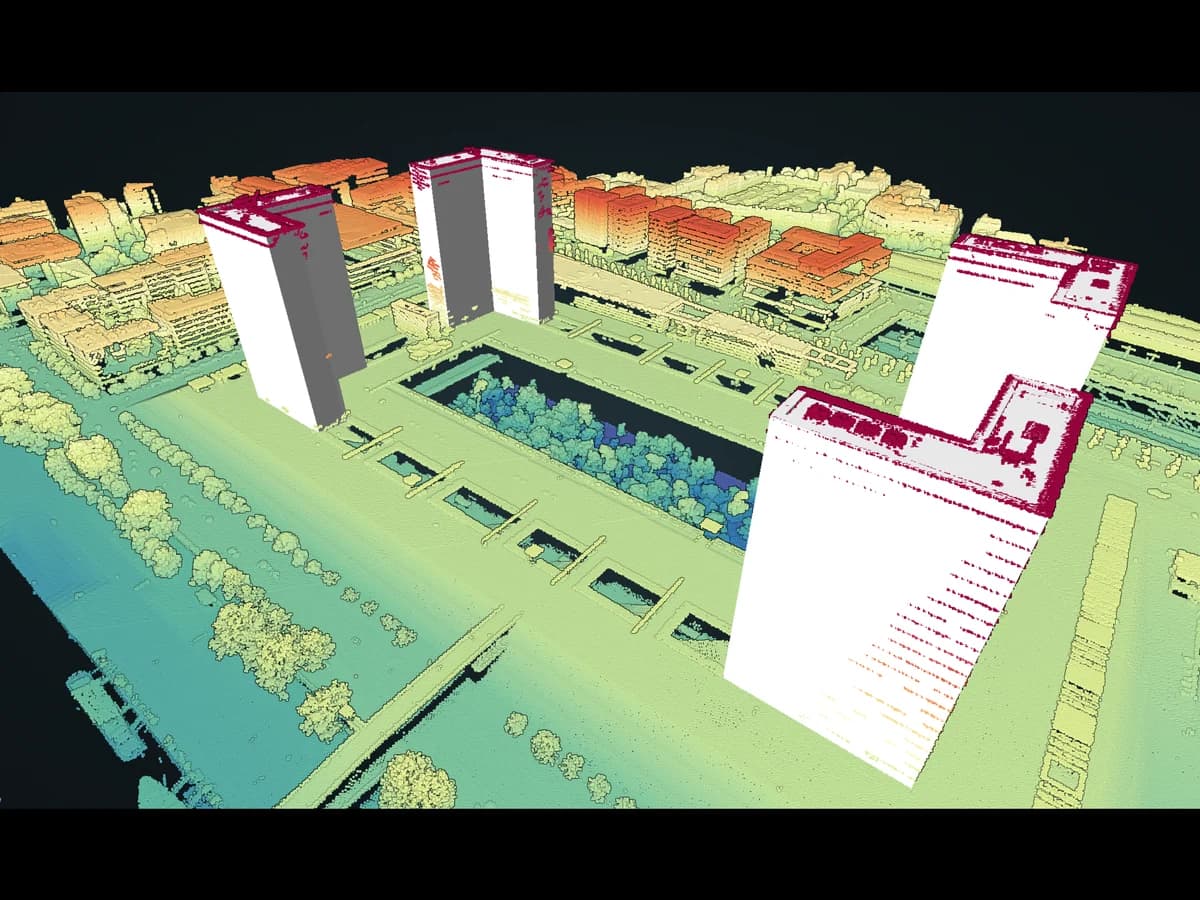
You also need ground heights. In France, IGN's RGE ALTI is served through the Géoplateforme, and asking for it in the image/x-bil;bits=32 format gives you real elevation values rather than a picture of them.
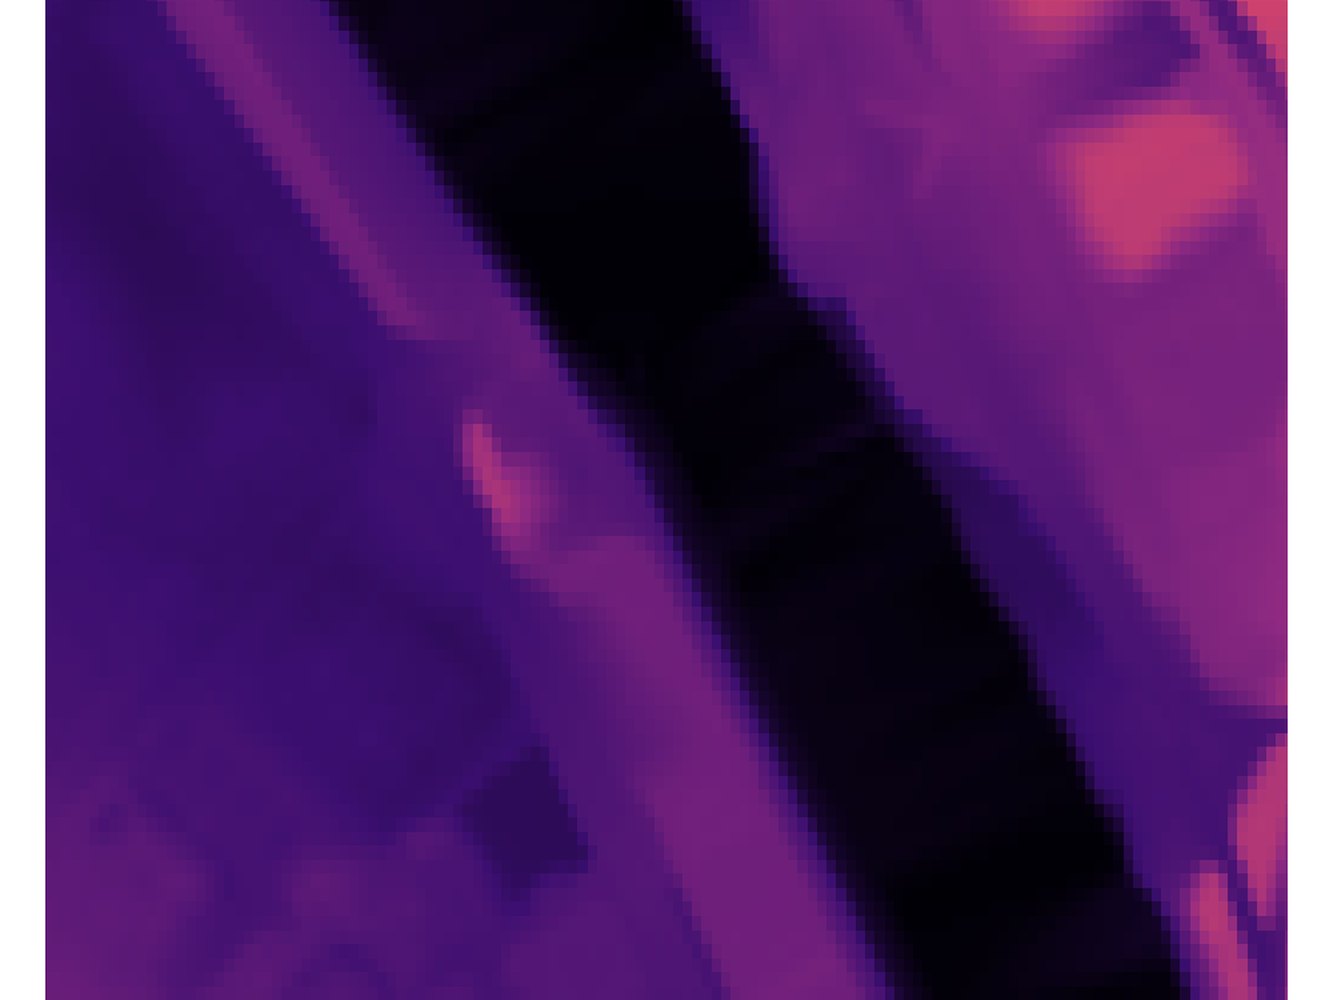
Measure the relief before anything else, because it decides whether any of this is worth doing. Over this frame the ground runs from 240.9 m in the channel to 260.1 m on the wooded slope: 19 m of relief. I framed the same exercise on Nemours before this one and got 6.3 m across an identical square, which is too flat for any of these methods to show anything.
Note how little of that 19 m is in the town. The quays sit at 242 m and the terrace the old town stands on at 245 m, so the historic centre is three metres above the river, not twenty. Everything below turns on that.
Method 1: The official flood map from Géorisques
Before modelling anything, check whether the answer already exists. Géorisques, run by the Ministry and the BRGM, publishes the PPRI hazard zones and the flood-directive mapping for the 124 French territories at high flood risk, in three hazard levels, as shapefiles and as WMS and WFS services under the open licence. Load the WFS straight into QGIS.
Use it when: the question is regulatory, or anyone will ask what the state considers flood-prone. Skip it when: your site is not covered, or you need a scenario nobody has mapped.
Method 2: A generative model inside QGIS
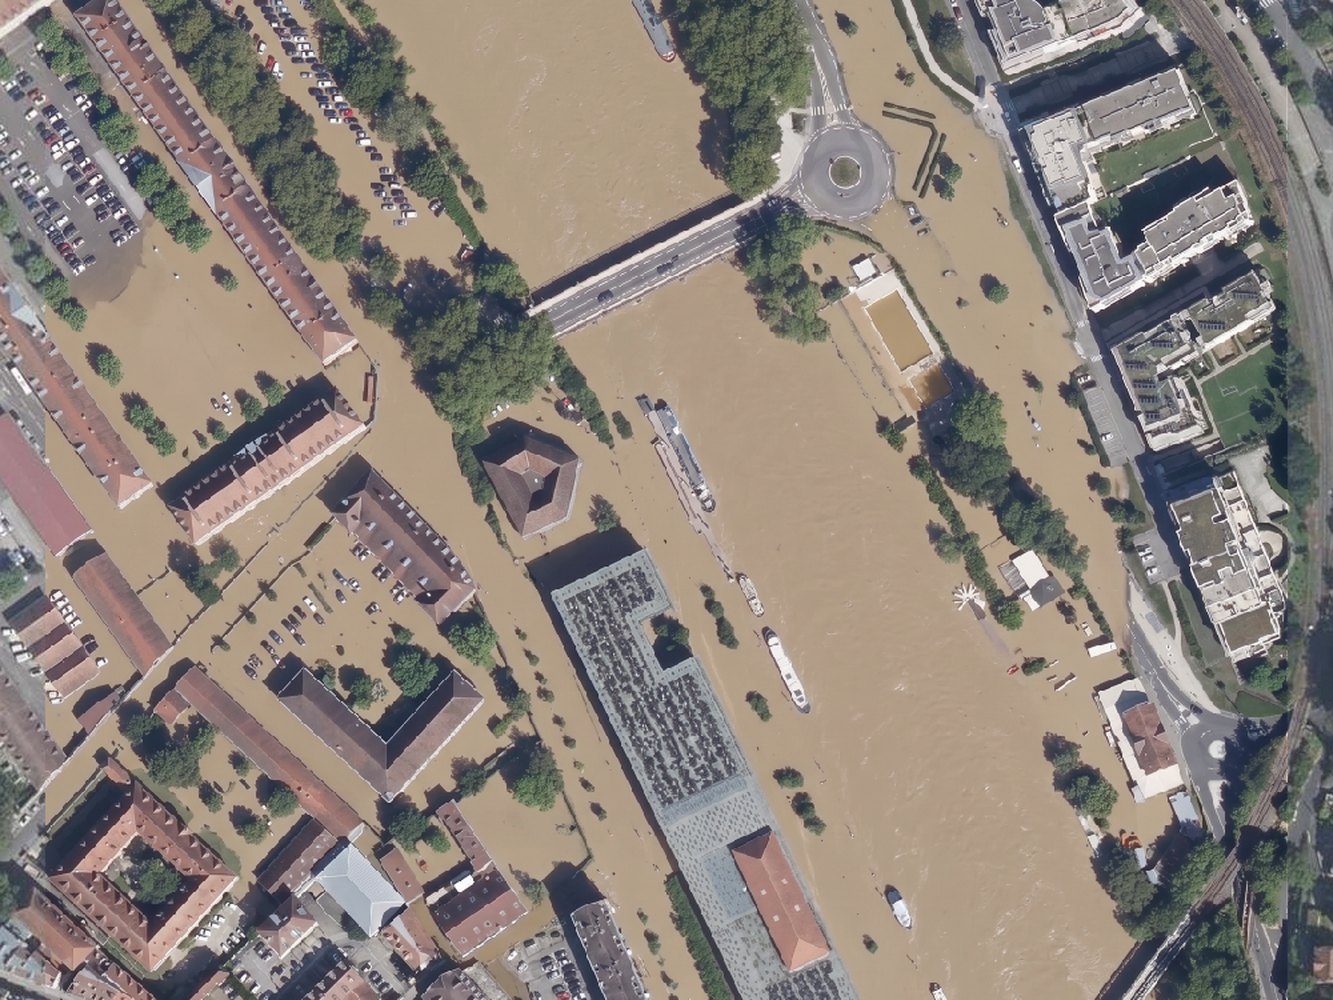
A generative model inside QGIS redraws the aerial photography on your screen from a written instruction, and gives it back as a map layer sitting exactly on the photograph it came from. We build one of these, AI Edit. This section is about our own tool.
Here is the same frame, asked for a major flood, with nothing else attached.
Now the same prompt with the elevation model from the top of this page attached as a reference, and a sentence telling the model to read it: dark is low, bright is high, stop where the ground rises.
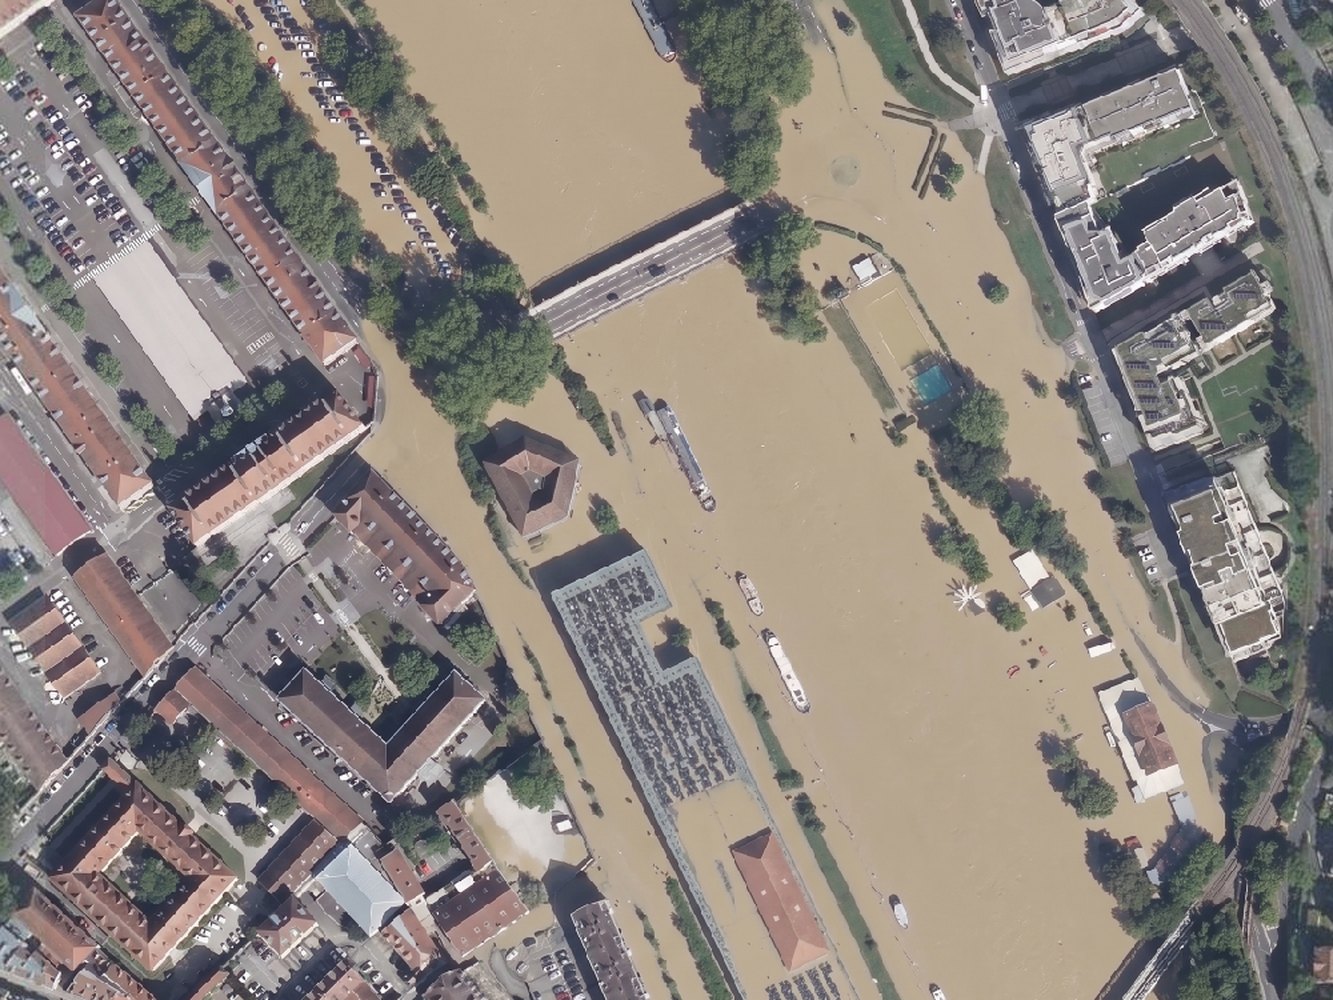
That is the whole argument for doing this inside QGIS rather than in a browser: any layer already open in your project can be handed to the model as guidance. An elevation model here, but equally the Géorisques hazard zone from Method 1, or the output of Method 3.
Write the instruction as a description of the water, not as a list of ground to spare. The run that tried the second way came back as the original photograph, unchanged.
Use it when: you have to make a real flood legible to people who do not read hazard maps. Skip it when: the deliverable is a number. The result is a picture, and nothing in it can be measured until you convert it into shapes.
Try it free in QGIS, no card needed
Method 3: An elevation model and a threshold
The five-minute answer. Load the elevation model, open the raster calculator, and keep every cell below your water level. Here, ("dem@1" <= 244) / ("dem@1" <= 244) gives a layer of ones over the flooded ground and nothing elsewhere. Style it blue over the aerial photograph. No elevation model yet? See where to download a free DEM.
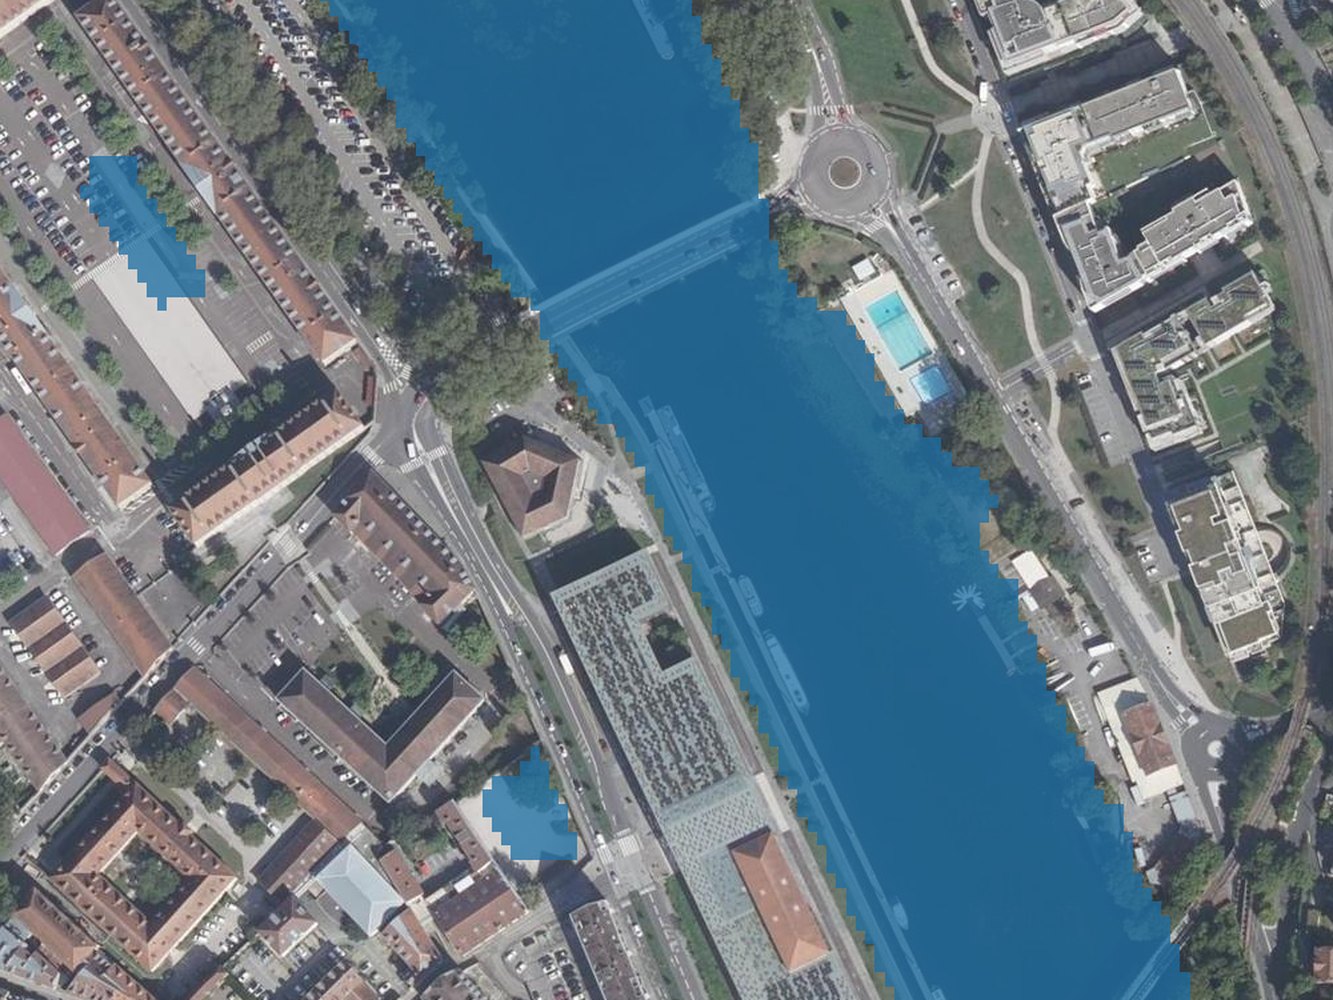
It is measurable: the layer has an area, and you can count what falls inside it. It is also crude, in two ways worth knowing before you show it to anyone.
First, it is a bathtub. It fills every cell below the line, whether or not water could reach it. Those two isolated blue patches, a car park at the top and a courtyard at the bottom, are not a bug: I sampled them at 244.1 m and 243.9 m, genuinely below the water level. But the ground between each of them and the river stands at 245 m, so a real flood would have to climb a metre of dry ground to get in. The threshold cannot know that. It has no idea which cells are connected to anything.
Second, push the level up and the crudeness stops being subtle.
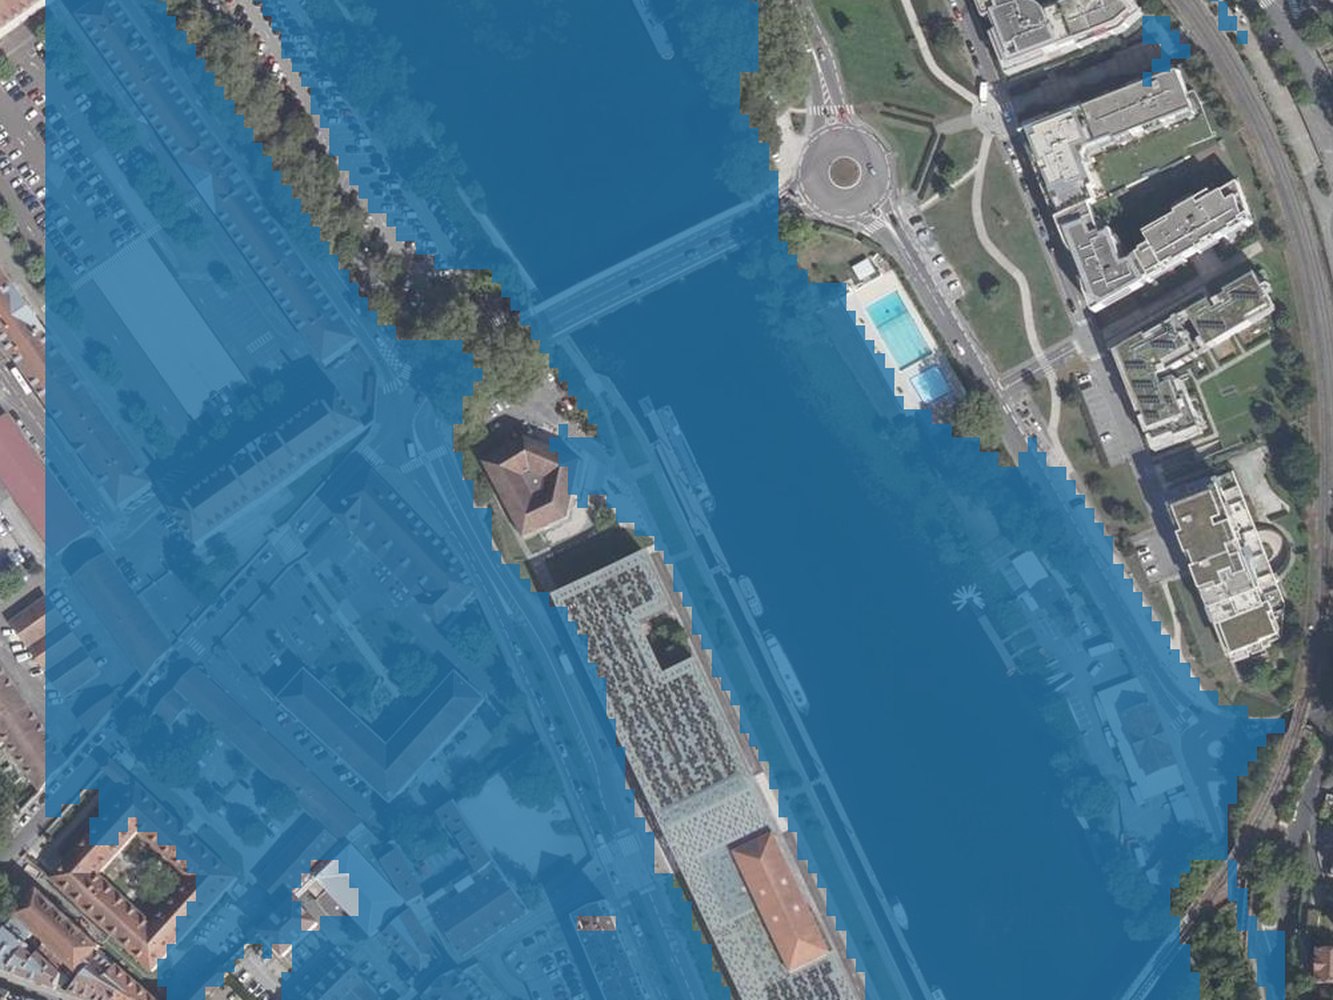
Use it when: you need a fast, measurable, honestly-labelled first pass. Skip it when: the number will be quoted to anyone who matters.
Method 4: A hydraulic model
HEC-RAS, TELEMAC or Iber take a channel geometry, a roughness and a discharge, and return depths and velocities that vary across the site. This is what a flood study actually is, and there are QGIS bridges to several of them.
Use it when: the deliverable is a study. Skip it when: you have three days and no hydraulic engineer, which is most of the time.
Method 5: Ask ChatGPT, Gemini or Midjourney
Take a screenshot of your map, paste it into any of them, describe the flood, get a picture back. Fast, and often convincing on the look of the water. Two problems. They have no idea where your ground is high or low, so the water goes wherever it makes a better picture. And what comes back is a plain image file with no coordinates, so it can never go back on the map next to anything else.
Use it when: you want a mood, for something informal. Skip it when: anyone knows the site.
What to remember
Three of these five methods give you a map you can measure, and two give you a picture you cannot.
Pair them. Method 1 or Method 3 gives the extent you can defend, and Method 2 gives the image people understand.
A generated flood is only trustworthy because you fed it a measured layer, so never publish one without the measured extent beside it.
Label every generated flood as a simulation, never as a photograph or a forecast.
Read the channel elevation off your own elevation model before picking a water level. A round absolute number picked without looking floods a whole town by accident.
Questions people ask
Can a generated flood image go in a public document?
Yes, labelled as a simulation, never as a photograph or a forecast. Our output is marked as AI-generated for that reason. Put the measured extent next to it so people can see where the number came from.
Can I measure the flooded area from the generated image?
No. It is pixels. Measure Method 1 or Method 3, which are real geometry, and use the generated image for what it is good at.
What water level should I use for the threshold?
Read the channel elevation off your elevation model first, then work upwards from it. Here the channel is at about 241 m, so 244 m is a three-metre rise. Picking a round absolute number without looking is how you end up flooding a whole town by accident.
Does this work outside France?
The method does. The data changes: you need a national elevation model, and any published hazard mapping your country has. The rest is the same raster calculator and the same prompt.
Sources
-
Géorisques, run by the Ministry for the ecological transition and the BRGM, read 31 August 2026. PPRI hazard zones and the flood-directive mapping of the 124 French territories at high flood risk, three hazard levels, shapefile plus WMS and WFS under Licence Ouverte 2.0.
-
IGN RGE ALTI through the Géoplateforme, Licence Ouverte. Elevation values read on 31 August 2026 in
image/x-bil;bits=32. -
Aerial photography: IGN BD ORTHO, Licence Ouverte.
-
Every figure was made in QGIS on 31 August 2026 over the frame described above.
The complete AI Edit guide covers the plugin end to end, and how to redesign a street in QGIS applies the same method to a different job. If you would rather describe the raster calculator and threshold steps than click through them, AI Agent runs that kind of multi-step QGIS workflow from one instruction. The QGIS AI hub links every guide we have.