Microsoft Building Footprints vs Google vs Overture, Tested
Published
Use OpenStreetMap or Overture Maps first wherever people have mapped buildings, Google Open Buildings v3 across Africa, South and Southeast Asia and Latin America, and Microsoft's footprints to fill the gaps. In France, take IGN BD TOPO when you need one polygon per building. I tested all of them on 11 October 2026.
The two test areas were the centre of Vitré, a market town in Brittany, where the French cadastre gives a reference to score against, and Dandora in Nairobi, where no official building layer exists and fresh drone imagery from April 2026 does. Both answers surprised me. In Vitré, Microsoft matched only 25% of the cadastre's buildings, because it draws one polygon around a whole terraced block. In Dandora, the newest and most complete layer was OpenStreetMap, not either model.
This post is the hands-on half. If you want the definitions first (footprint versus roofprint, how to measure an area), what a building footprint is covers them, with a measurement on 8,511 French houses.
Which building footprint dataset to use where
The short version, with the test behind each line.
| Your area | Use first | Why, measured on 11 October 2026 |
|---|---|---|
| France | IGN BD TOPO, or OpenStreetMap | 99% of Vitré's OSM buildings were imported from the cadastre, and both matched 83 to 84% of BD TOPO at IoU above 0.5 |
| Africa, South and Southeast Asia, Latin America | Overture, which puts OpenStreetMap first and fills with Google | Google covers these regions only; in Dandora it holds 19,165 buildings above its 80% precision threshold |
| United States | A county or city layer if one exists, then Microsoft | Microsoft keeps adding US footprints with heights; NYC republishes its layer every week |
| Anywhere else | Overture | One download that already merges OpenStreetMap, Microsoft, Google and Esri Community Maps |
| Built after 2023 | None of them reliably: detect from your own imagery | Google's inference ran in May 2023; see the last section |
My default is Overture for a first look anywhere, then the national cadastre wherever one is published. Microsoft alone is the layer I'd use last for per-building counts, and the Vitré test shows why.
The datasets side by side
Everything in this table was read on the publisher's page on 11 October 2026. "Height" and "Confidence" say whether the polygons carry them, and the counts in brackets come from my two test areas.
| Dataset | Coverage | Newest data | Licence | Height | Confidence | One area into QGIS |
|---|---|---|---|---|---|---|
| Microsoft Global ML Building Footprints | 1.4 billion buildings in 225 regions, 30,340 tiles | Global refresh of 13 August 2026; imagery mostly 2014 to 2024 | CDLA Permissive 2.0 | On a subset (219 of 1,636 in Vitré, none in Dandora) | 0 to 1 on footprints added since December 2023 (none in Dandora) | One .csv.gz per country and zoom-9 quadkey, listed in dataset-links.csv |
| Google Open Buildings v3 | 1.8 billion detections over 58 million km² of Africa, South and Southeast Asia, Latin America and the Caribbean | Inference run in May 2023 | CC BY 4.0 or ODbL 1.0, your choice | No | Yes, plus a per-cell threshold for 80, 85 and 90% precision | One CSV per S2 level-4 cell, Earth Engine, or 20 country files on HDX |
| Google Open Buildings 2.5D Temporal | Same regions as v3 | One layer a year, 2016 to 2023 | CC BY 4.0 or ODbL 1.0 | Yes, a height raster from 0 to 100 m | A presence raster, uncalibrated | Earth Engine, as 4 m effective rasters, not polygons |
| Overture Maps buildings | Global | Release 2026-09-23.1, monthly, next on 21 October | ODbL | Where a source has one (109 of 3,944 in Vitré) | Kept from Google for Google-sourced buildings | overturemaps CLI or the GeoParquet Downloader plugin |
| OpenStreetMap | Global, as complete as local mappers made it | Live | ODbL 1.0 | Only where someone tagged it | No | QuickOSM or an Overpass query |
| IGN BD TOPO (France) | France and overseas departments | Quarterly, last updated 7 October 2026 | Licence Ouverte 2.0 | Yes (3,699 of 3,715 in Vitré) | No, an origin field instead | IGN's WFS, or a shapefile per department |
| A US city or county layer, for example New York City | One city or county | NYC: updated weekly, last on 5 October 2026 | The portal's terms of use | NYC: roof height | No | The portal's download or feature service |
Two rows need a warning. The 2.5D Temporal dataset is not a footprint layer: Google built it from 10 m Sentinel-2 images, so it tells you whether a 4 m cell held a building in a given year, which is useful for growth over time but gives no outlines (the resolution comparison shows what a building looks like at 10 m). And ODbL is share-alike: a database you derive from OpenStreetMap or Overture goes back out under the same licence, while Microsoft's CDLA and Google's CC BY option only ask for credit.
How to download building footprints into QGIS for one area
I ran every route below for the same two boxes on 11 October 2026 and timed it. The times include the download on my connection, which held about 1.5 MB/s at best, so read them as relative. The last method hands the whole comparison to an AI agent in QGIS in one sentence.
| Route | Vitré, 2.2 km² | Dandora | What you download |
|---|---|---|---|
| Our free downloader in the browser | 7 s for three sources | 10 s for a 0.52 km² box; Google comes back as a 1.76 GB file link | GeoJSON per source, only the box |
overturemaps CLI | 19 s, 2.5 MB | 25 s for 5.7 km², 14.9 MB | Overture buildings, only the box |
| Microsoft tile | 17 s for the index, then 78 s for a 20.6 MB tile | 14 min 10 s for a 131.8 MB tile | A whole 52 × 52 km tile |
| Google S2 cell | Not covered | 20 min for 1.76 GB, then 10 min to unzip and filter | A whole cell, here 17.9 million buildings |
| QuickOSM (OpenStreetMap) | 14 to 18 s, when the server answered | 47 to 58 s | OSM buildings with every tag |
| IGN BD TOPO WFS | 12 s for 3,759 buildings | Not available | BD TOPO buildings with height |
The spread is the point. The two routes built for a box answer in seconds, and the two that hand you a whole file make you download a region to get a town: 189,136 Microsoft buildings to keep 1,636, and 17.9 million Google buildings to keep 20,334.
Method 1: a free downloader that reads all four global sources
We build this one, the free building footprint downloader, so weigh it accordingly. You draw a box in the browser, up to 25 km², and it reads Overture, OpenStreetMap, Microsoft and Google Open Buildings for that box and returns one GeoJSON file per source with the licence and attribution written inside. No account.
On Vitré it answered in 7 seconds with 3,986 Overture, 3,827 OpenStreetMap and 1,672 Microsoft buildings, and told me Google does not cover France rather than handing me an empty file. Two limits, both measured. One download carries at most 12,000 buildings across all sources, so in a place as dense as Dandora the box has to stay under about 0.8 km². And when Google's file for the area is too big to slice inside a web request, which in Dandora meant a 1.76 GB cell, it hands you the file link instead of the buildings.
Method 2: Overture, with the CLI or a QGIS plugin
Overture is the quickest single download that holds more than one source. The overturemaps command line tool (version 1.0.2 on PyPI) takes a box and writes GeoJSON or GeoParquet:
pip install overturemaps
overturemaps download --bbox=-1.2200,48.1165,-1.1985,48.1290 -f geojson --type=building -o vitre.geojson
That took 19 seconds for Vitré and 25 seconds for Dandora, from release 2026-09-23.1. Drag the file into QGIS. Each building keeps a sources field naming where it came from, which is how I know Overture's 3,944 Vitré buildings are 3,787 from OpenStreetMap and 157 from Microsoft.
If you would rather stay in QGIS, the GeoParquet Downloader plugin (version 0.8.6, 24,894 downloads) downloads Overture for the current map view. It needs DuckDB in QGIS's Python, and its own README says the automatic install "doesn't work reliably", so expect a setup step. I timed the CLI, not the plugin.
Method 3: Microsoft's quadkey files
Microsoft publishes no box query. You open dataset-links.csv (6.4 MB, 30,341 lines in the 13 August 2026 edition), find the row for your country and the zoom-9 quadkey that holds your area, and download that one file. For Vitré it is quadkey 031331112, a 52 × 52 km tile of 189,136 buildings.
Then comes the step that catches people. The file is named .csv.gz but holds line-delimited GeoJSON. Dragged into QGIS as it is, it opens as a CSV table with no geometry. Rename it to .geojsonl.gz and QGIS reads it straight as polygons, still zipped. I checked both on a small tile in QGIS 3.44.15.
Method 4: Google's S2 cells or Earth Engine
Google publishes one CSV per S2 level-4 cell, with the polygon as WKT text and the confidence score in its own column. Dandora sits in cell 183, which spans southern Kenya from Lake Victoria to the coast: 1.76 GB compressed and 17,871,082 buildings. With eight parallel connections it took me 20 minutes to download, and another 10 minutes to decompress it and keep the 20,334 rows inside my box. A single connection was running at about a third of that speed.
For one town, Earth Engine is the better route if you have an account: filter the polygon collection to your area and export it. Either way, filter on confidence first. Google publishes a threshold per cell, and for cell 183 a score of 0.667 gives 80% precision, 0.716 gives 85% and 0.778 gives 90%. In Dandora, 1,169 of the 20,334 detections sit below 0.667.
Method 5: QuickOSM for OpenStreetMap
QuickOSM queries an Overpass server and loads the answer as layers; downloading OSM data in QGIS walks through it. A successful run took 14 to 18 seconds for Vitré and 47 to 58 seconds for Dandora. The servers were the weak point: of my 10 attempts across three public Overpass servers on 11 October, 6 failed, four with 504 Gateway Timeout and two with 500 Internal Server Error. Retrying, or switching server in QuickOSM's settings, got me through each time.
Method 6: the national cadastre
In France, BD TOPO comes through IGN's WFS. In QGIS, Layer > Add Layer > Add WFS Layer, connect to https://data.geopf.fr/wfs/ows, pick BDTOPO_V3:batiment and tick "Only request features overlapping the view extent". The same request from the command line returned Vitré's 3,759 buildings in 12 seconds, each with a height and an origine_du_batiment field that says whether the outline came from the cadastre or from aerial photos. Elsewhere, look for the national mapping agency or the city's open data portal before you settle for a model.
Method 7: one sentence to an AI agent in QGIS
We build this tool too, AI Agent, a chat panel inside QGIS that runs the steps in your open project. I zoomed a fresh project on Dandora and typed:
Load the OpenStreetMap buildings and the Overture Maps buildings for the current map view of Dandora, Nairobi, and compare the two counts.
It answered in under 30 seconds, with four actions: 3,569 OpenStreetMap buildings and 3,723 Overture buildings over the 0.647 km² view, so Overture held 154 more (4.3%), of which 125 came from Google and 29 from Microsoft. It also said which OpenStreetMap it had used, the OSM part of Overture's 23 September release rather than a live Overpass query, which is the detail I would want to know before quoting the number.
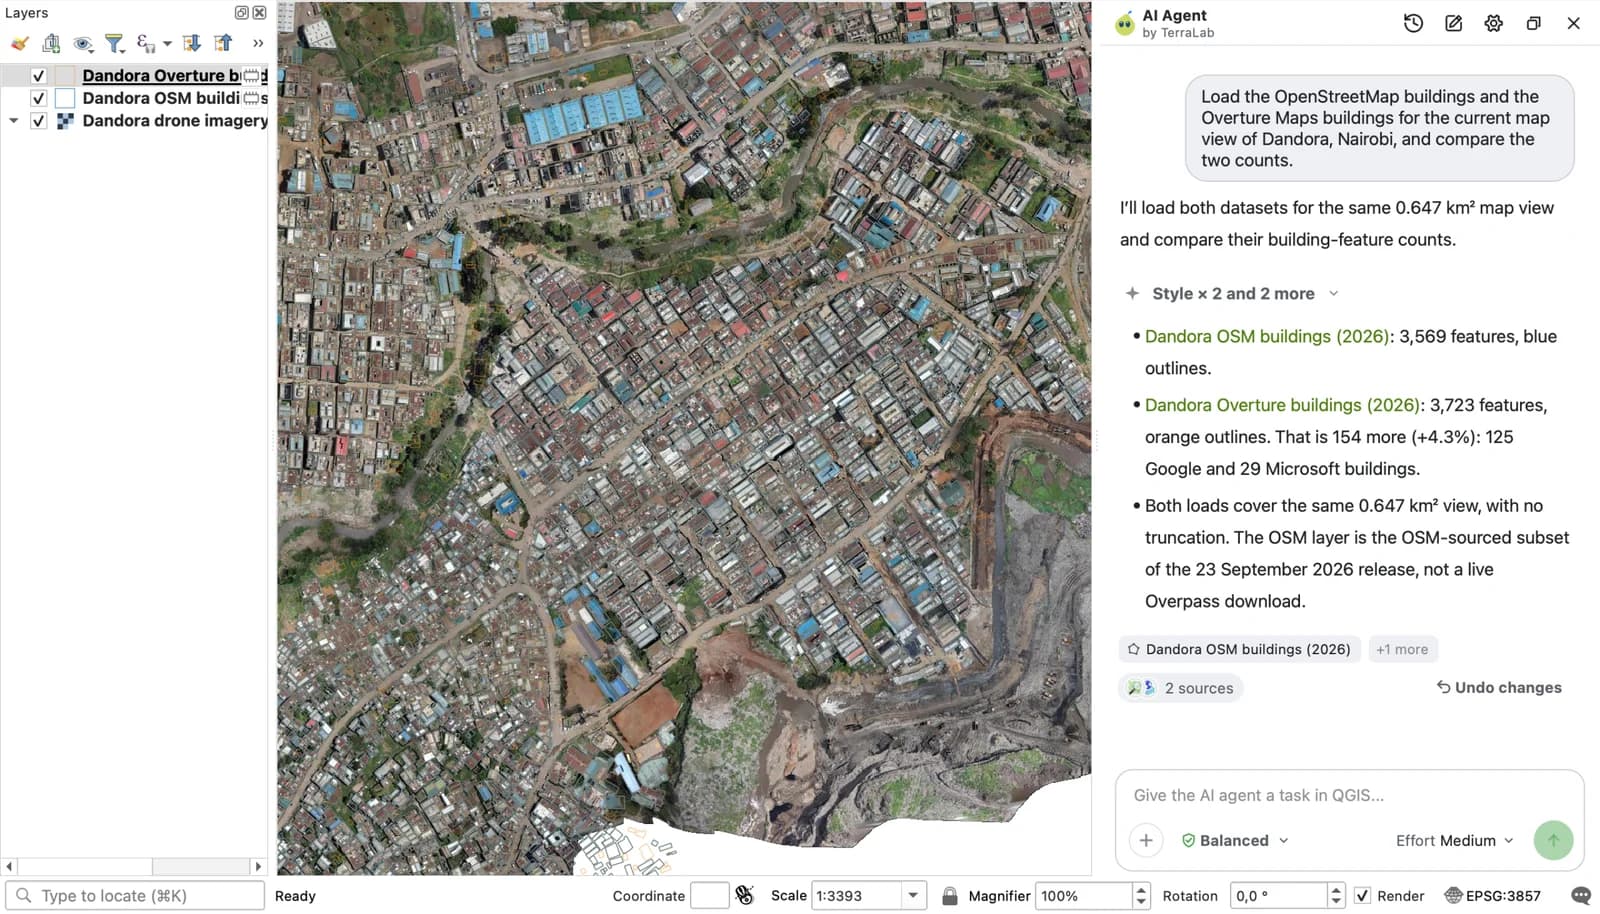
That is the quickest way I found to answer "how much does OpenStreetMap miss here" without writing a query. For a single source in a single view, QuickOSM or the downloader above does the job just as well.
Try it free in QGIS, no card needed
Measured: Vitré against the French cadastre
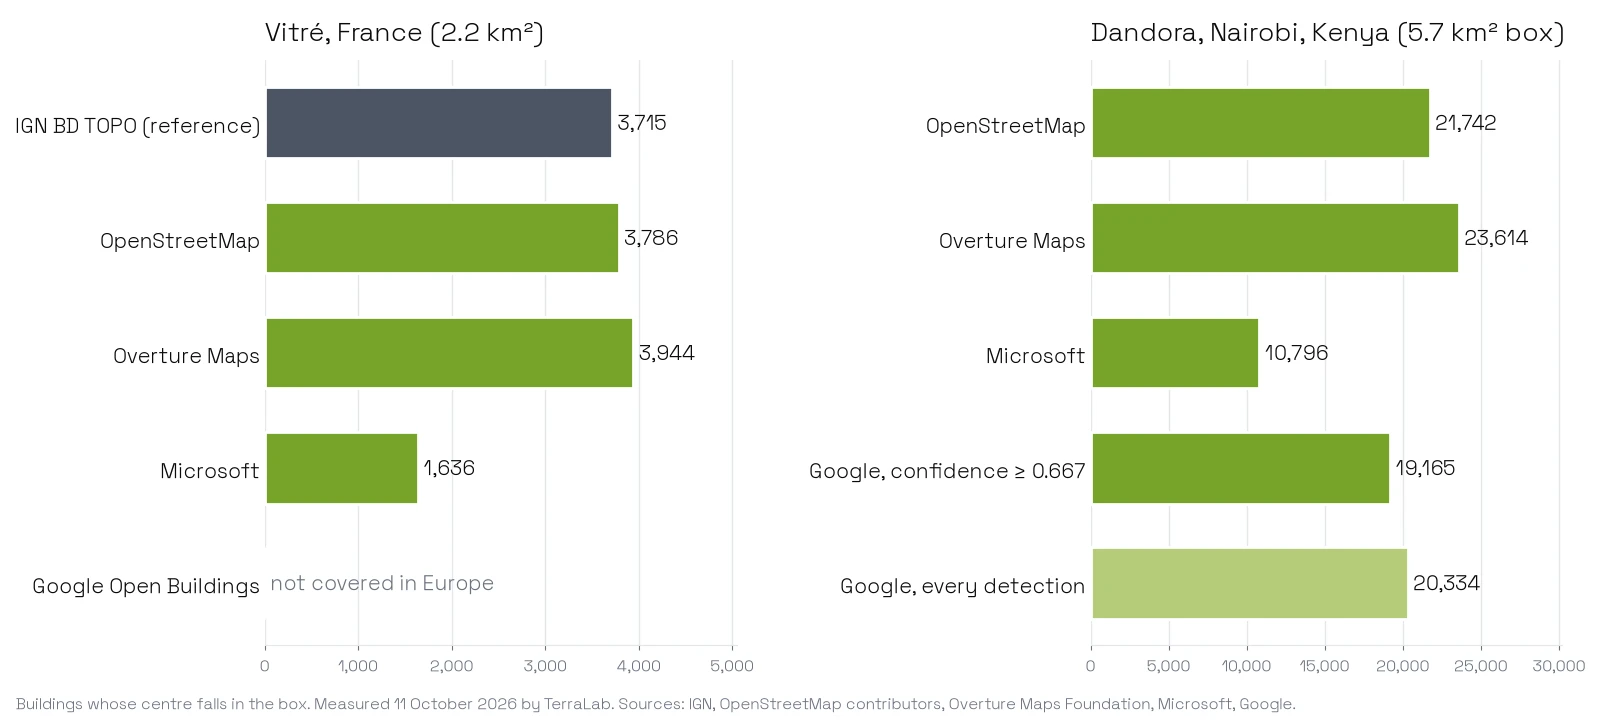
In a French town, OpenStreetMap and Overture match the cadastre-based BD TOPO for 83 to 84% of its buildings at an intersection-over-union above 0.5, and Microsoft for 25%. The gap is not about accuracy at the edges. It is about what each dataset calls one building.
| Vitré centre, 2.2 km² | IGN BD TOPO | OpenStreetMap | Overture | Microsoft |
|---|---|---|---|---|
| Buildings | 3,715 | 3,786 | 3,944 | 1,636 |
| Total footprint area | 41.6 ha | 42.7 ha | 43.7 ha | 44.6 ha |
| Median building | 75 m² | 70 m² | 67 m² | 135 m² |
| BD TOPO buildings matched, IoU above 0.5 | reference | 83% | 84% | 25% |
| Same, buildings of 20 m² and more | reference | 89% | 90% | 31% |
| BD TOPO buildings of 20 m² and more it misses entirely | 71 | 44 | 190 | |
| Its polygons with no BD TOPO building under them | 113 | 242 | 186 | |
| Largest gap between matched outlines, median | 1.0 m | 1.0 m | 2.4 m | |
| Outlines with only right angles | 68% | 69% | 70% | 95% |
Total areas sit within 8% of each other. The counts do not, and the figure below shows why. In the old town, 447 Microsoft polygons each cover two or more BD TOPO buildings, 2,114 buildings in all, and the largest one wraps 66 of them. Microsoft's model sees one continuous roof over a terraced block and draws one regular shape around it, 95% of the time with nothing but right angles.
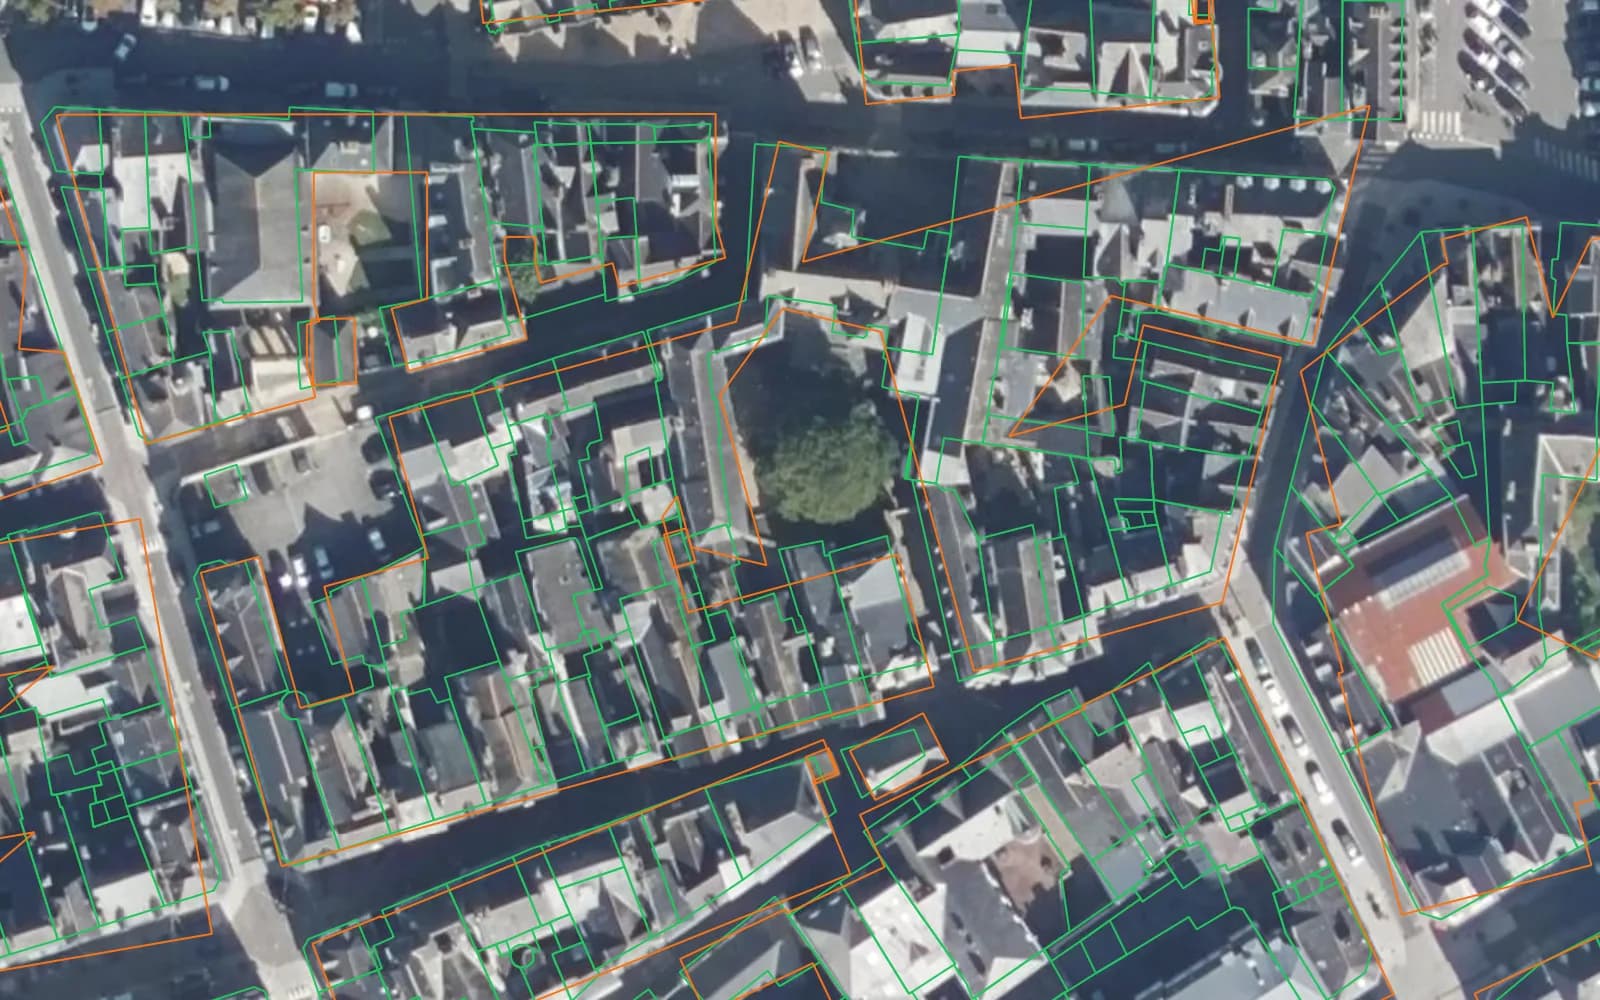
OpenStreetMap matching BD TOPO this well has a simple cause. In this box, 3,794 of the 3,816 OpenStreetMap buildings (99.4%) carry a cadastre source tag: they were imported from the same land registry BD TOPO draws on. So in France the comparison mostly tells you that OpenStreetMap is the cadastre with a map community on top, and Overture is OpenStreetMap plus 157 Microsoft buildings it lacks.
What the misses and the extras look like
Counts against a reference flatter whoever made the reference, so I looked at the disagreements on the IGN orthophoto, 30 random polygons from each set.
Of 30 Microsoft polygons with nothing in BD TOPO under them, 11 were not buildings at all (paved terraces, a car park, a lawn, a pool cover), 17 were sheds and garden outbuildings BD TOPO leaves out, and 2 were full buildings BD TOPO is missing. Of 30 BD TOPO buildings of 20 m² or more that Microsoft misses entirely, 18 are plain to see on the photo, 4 partly, and 8 sit under trees or in deep shadow. Of 30 OpenStreetMap polygons with no BD TOPO match, 21 were real small structures and 7 sat on a car park, a yard, a garden or a road.
How we measured this. The reference is every BD TOPO building whose representative point falls in the box, downloaded from IGN's WFS on 11 October 2026; 3,567 of the 3,715 come from the cadastre and 148 were traced from aerial photos. A building counts as matched when the best overlapping polygon has an intersection-over-union above 0.5, and as missed when less than 10% of its area is covered. Areas are in Lambert-93. Microsoft's polygons were identical in its releases of 3 February and 13 August 2026 here. One town is one town: a commune with fewer terraces will flatter Microsoft more.
Measured: Dandora, Nairobi, where no official layer exists
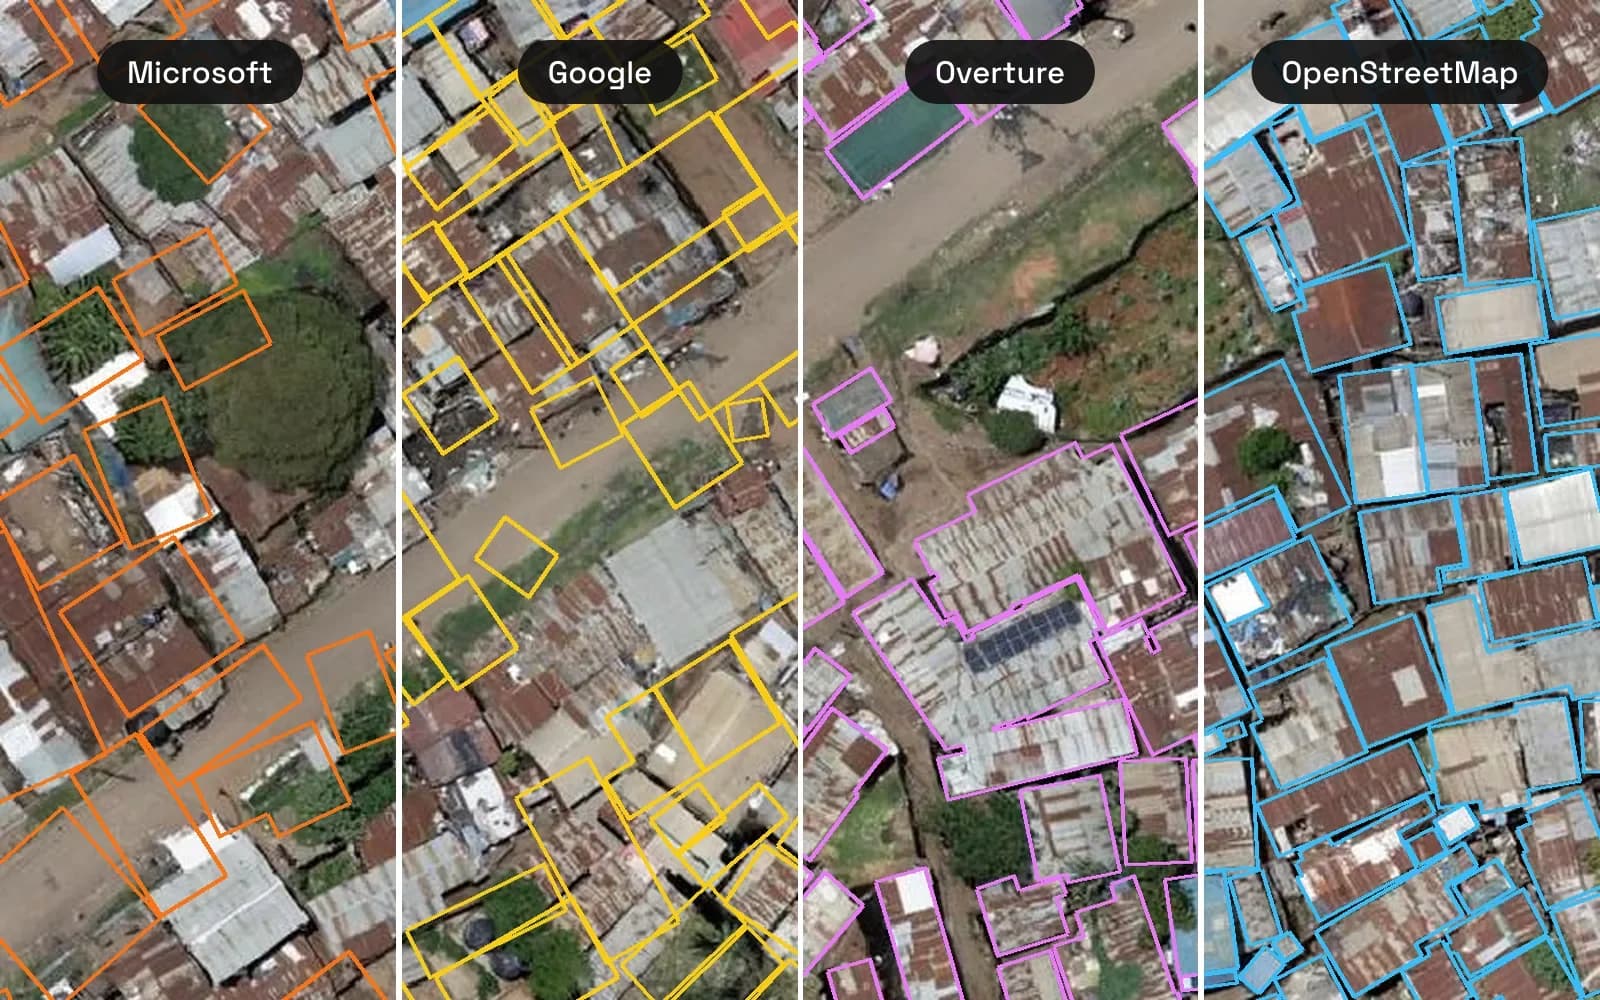
In Dandora the four sources disagree far more, and the 2026 drone imagery shows which one is current: OpenStreetMap, with 21,742 buildings, nearly all edited in summer 2026. Google holds 19,165 above its precision threshold and Microsoft 10,796.
| Dandora, 5.7 km² box | OpenStreetMap | Overture | Google, confidence ≥ 0.667 | Microsoft |
|---|---|---|---|---|
| Buildings | 21,742 | 23,614 | 19,165 | 10,796 |
| Total roof area | 179 ha | 189 ha | 200 ha | 173 ha |
| Median building | 47 m² | 45 m² | 64 m² | 90 m² |
| Its polygons matching an OSM building, IoU above 0.5 | 91% | 16% | 13% | |
| Polygons holding two or more OSM buildings | 2,311 | 2,440 | ||
| On the imagery, with no other source under them | 2,608 | 658 | 149 |
The totals are close and the buildings are not. Only 16% of Google's polygons match an OpenStreetMap building at IoU above 0.5, and the reason is not a shifted layer, since the median offset between the datasets is under 1.3 m. It is the same story as Vitré, at a finer scale. Tin-roofed rooms packed into a plot read as one roof to a model, so 2,311 Google polygons each cover two or more OpenStreetMap buildings, up to 62 in one.
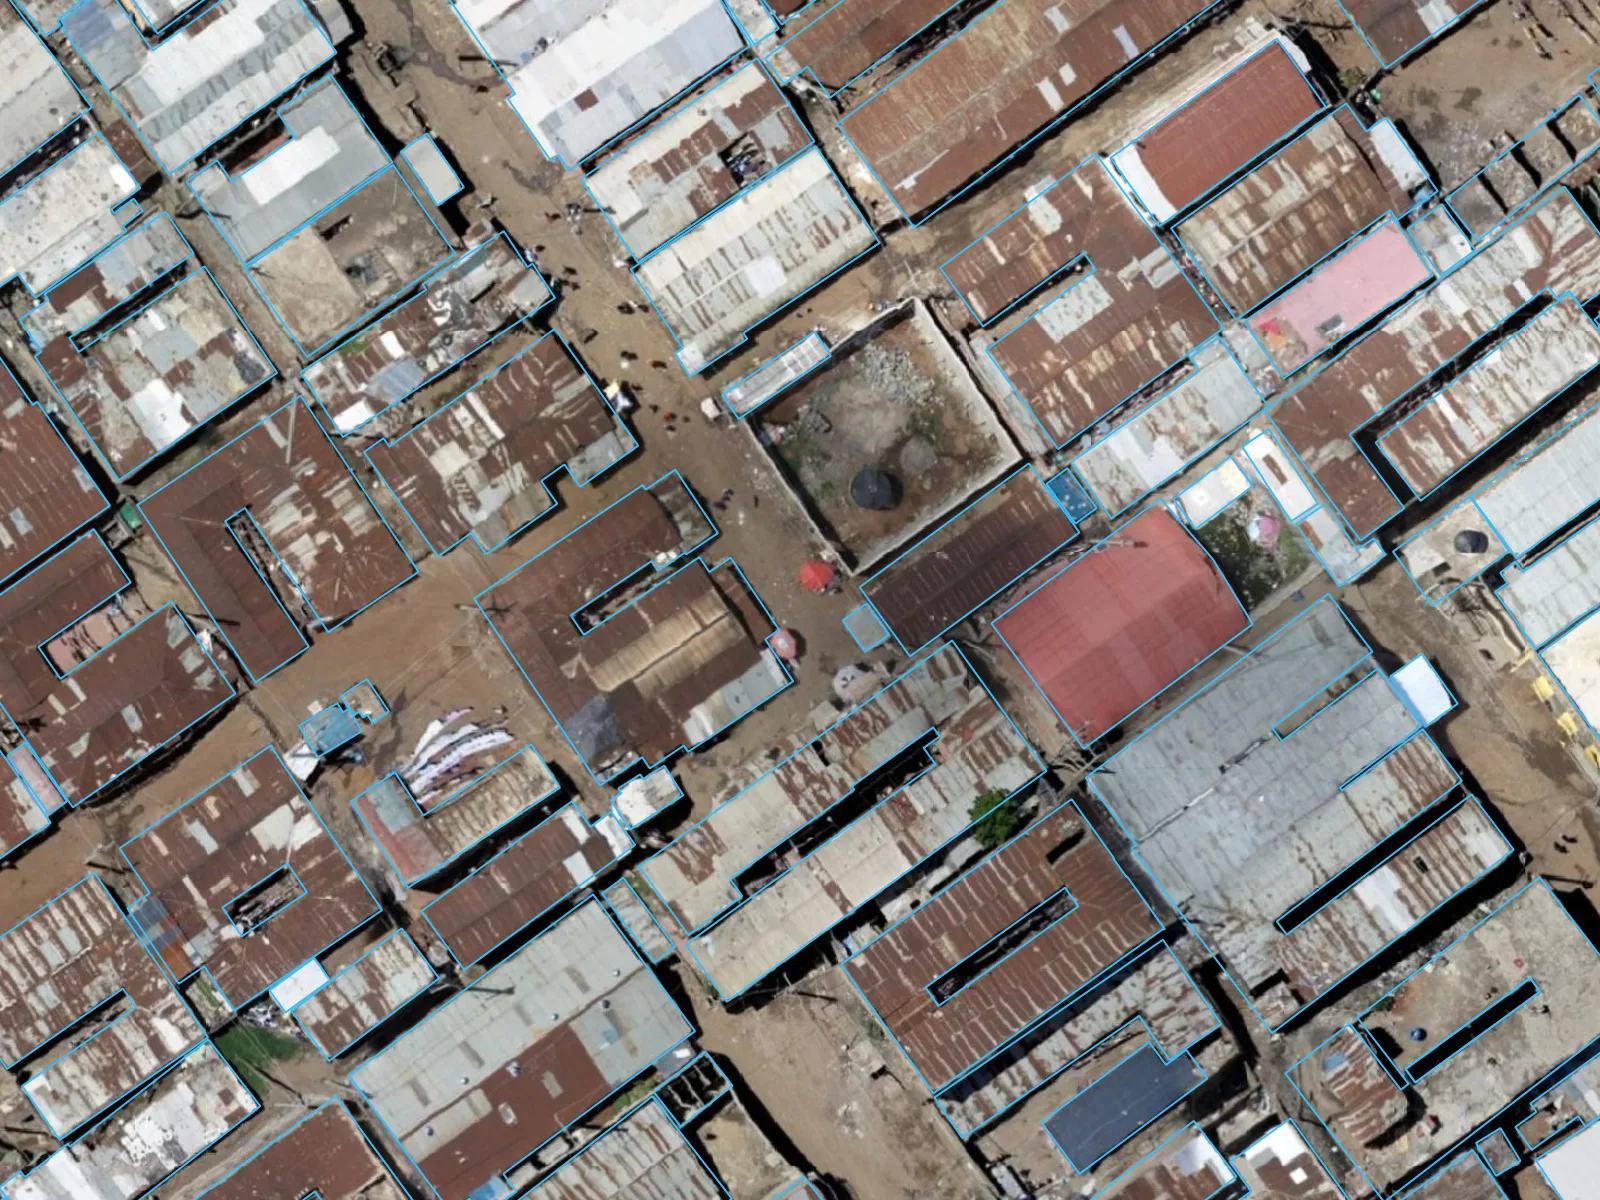
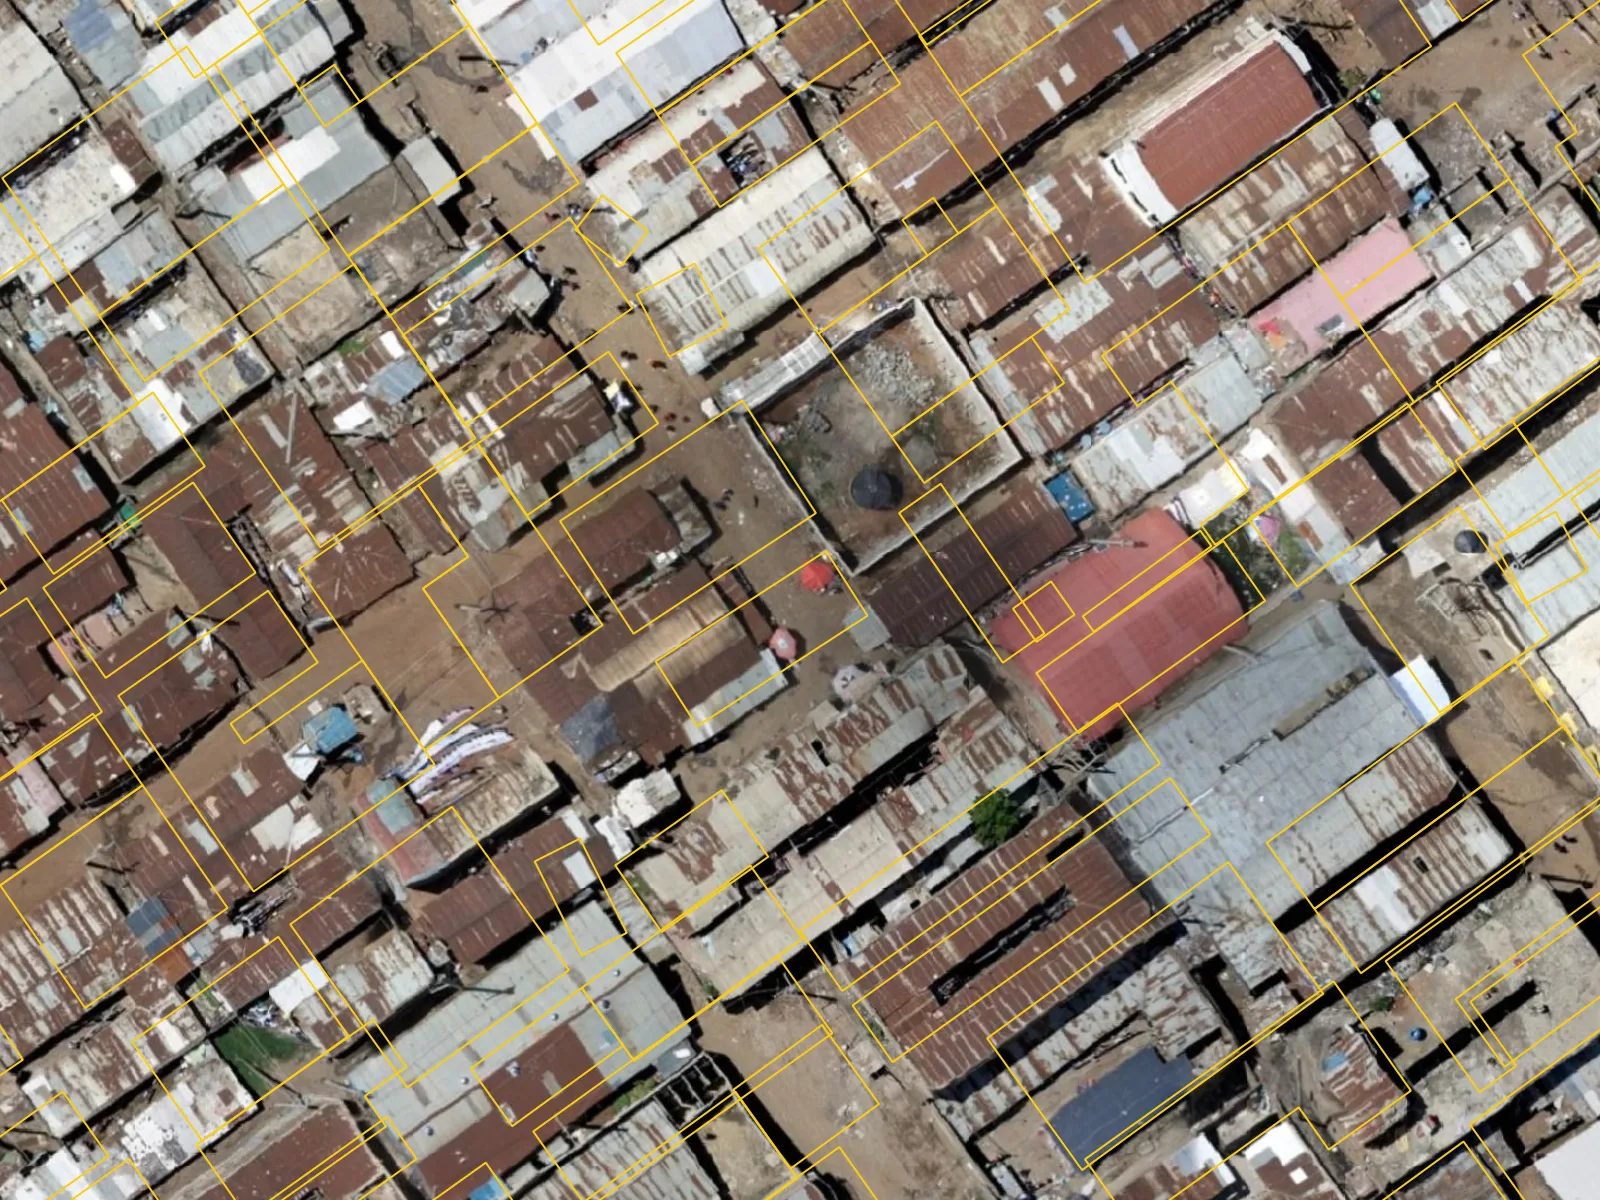
Then I sampled 30 polygons that only one source has, inside the imagery, and checked each on the drone photo. Of Microsoft's, 26 sit on bare ground, rubbish, a river, trees or parked vehicles, 3 on roofs and 1 at the edge of the imagery. Of Google's, 28 sit on riverbanks, roads, trees and yards, and 2 are unclear. Of OpenStreetMap's, 29 are real roofs and 1 is in shade.
The models' extras are either false detections or buildings demolished since their imagery, and the 2026 photo cannot tell those apart. What it does show is age. Of the 21,871 OpenStreetMap buildings in Overture's copy of Dandora, 20,519 were last edited between July and September 2026, after this drone flew, while Google's model ran in May 2023. Mappers probably traced them from imagery like this one (the AI Agent run above read the same OpenStreetMap through Overture), which gives OpenStreetMap a head start in this check, and that head start is exactly what a 2023 model cannot have.
How we measured this. The box is the extent of the "Dandora Mar-Apr 2026" drone mosaic on OpenAerialMap: 7.7 cm, flown by the Humanitarian OpenStreetMap Team between 26 March and 3 April 2026, CC BY 4.0. OpenStreetMap came from QuickOSM on 11 October, Overture from release 2026-09-23.1, Microsoft from its 13 August 2026 tile (identical here to the February release), and Google from cell 183. Areas are in UTM zone 37S. "No other source under them" means less than 10% of the polygon is covered by the other two of OpenStreetMap, Google and Microsoft. There is no ground truth here, only the photo, and a sample of 30 per set gives the direction, not a precise rate.
When none of them has your newest buildings
Every layer above is a snapshot of somebody's imagery. Google's is May 2023, Microsoft's tiles carry imagery from 2014 to 2025, and even BD TOPO waits for the cadastre. If your question is about the last two years, a construction survey, a flood damage count or a subdivision finished in 2025, the honest answer is to detect the buildings yourself from imagery as recent as the question.
We build a tool for that, AI Segmentation, which outlines buildings in QGIS from any raster or basemap you load, drone mosaics included. Detecting building footprints in QGIS compares it with the free routes, hand digitizing included, and shows the filtering step that decides whether the result is usable. For a few dozen buildings, digitizing by hand is still the fastest route, and it costs nothing.
What to remember
In France, OpenStreetMap and Overture follow the cadastre: they matched 83 to 84% of BD TOPO's buildings in Vitré, against 25% for Microsoft.
Microsoft's total area is right and its counts are not, because it draws one polygon per block: 66 houses in its largest Vitré polygon, 78 OpenStreetMap buildings in its largest Dandora one.
Google Open Buildings covers Africa, South and Southeast Asia and Latin America only, is frozen at May 2023, and should be filtered on its per-cell confidence threshold before you count anything.
Box-based routes take seconds (our downloader, the Overture CLI, QuickOSM), while Microsoft and Google make you download a whole tile or cell, up to 1.76 GB for one Kenyan cell.
Rename Microsoft's .csv.gz files to .geojsonl.gz before you drag them into QGIS.
Questions people ask
Which is better, Microsoft or Google building footprints?
Where both exist, Google gave more buildings in my Nairobi test (19,165 against 10,796 in the same box) and smaller, more separate polygons, while Microsoft merged more roofs into one shape. Outside Africa, South and Southeast Asia and Latin America there is no choice to make, because Google does not cover Europe, North America or Australia.
Is Overture better than OpenStreetMap for buildings?
Overture is OpenStreetMap plus machine-learning buildings where OpenStreetMap has none, so it is never smaller. In Vitré it added 157 Microsoft buildings to 3,787 from OpenStreetMap; in Dandora it added 1,509 from Google and 404 from Microsoft. Its release lags OpenStreetMap by a few weeks, and the whole theme is under ODbL.
What licence do Microsoft and Google building footprints use?
Microsoft's are under CDLA Permissive 2.0, which asks for attribution and has no share-alike clause. Google lets you choose between CC BY 4.0 and ODbL 1.0. Overture's buildings and OpenStreetMap are under ODbL, so a database you derive from them must be shared under the same licence.
Do these datasets include building heights?
BD TOPO gives a height for nearly every building (3,699 of 3,715 in Vitré). Microsoft gives one on a subset, 219 of 1,636 in Vitré and none in Dandora. Overture passes on heights where a source has them. Google's polygons have no height; its separate 2.5D Temporal rasters estimate one per 4 m cell from 2016 to 2023.
How do I open Microsoft building footprints in QGIS?
Find your country and quadkey in dataset-links.csv, download that one .csv.gz file, rename it to .geojsonl.gz and drag it into QGIS. Left as .csv.gz, QGIS opens it as a table with no geometry. For one small area, the free downloader or Overture, which already includes Microsoft buildings, saves the whole-tile download.
How current are Google Open Buildings?
Version 3 comes from an inference run in May 2023, and Google has not published a newer polygon layer. In Dandora, OpenStreetMap had 2,608 buildings on April 2026 drone imagery that neither Google nor Microsoft has, and 29 of 30 I checked were real roofs.
Two companion pages take this further: what a building footprint is, for why most of these polygons are really roofprints, and the QGIS AI hub, for the tools that work on them once they are loaded.