Contour Lines: How to Read Them, Contour Interval and QGIS
Published
A contour line is a line on a map that joins points of equal elevation above a reference level, usually mean sea level. The vertical step between one line and the next is the contour interval, which ranges from 1 to 2 m on a building site plan to 10 or 20 m on a standard hiking map and 50 to 100 m across a mountain range.
Walk along a contour line in the real world and you neither climb nor descend. Step across the lines and you go uphill or downhill. The closer the lines pack together on the paper, the steeper the ground is under your boots. If you need contour lines for your own map right away, draw a box anywhere on Earth in our free contour lines generator and export them as GeoJSON, Shapefile, KML or DXF.
What is a topographic map?
A topographic map is a map that shows the three-dimensional shape and height of the land on a flat sheet using contour lines, alongside rivers, roads, buildings and place names. Standard topographic series, such as the USGS US Topo quadrangles, print contour lines in brown so the terrain stands apart from blue water.
Not every elevation map is a topographic map. A shaded-relief map uses light and shadow to suggest slopes, and a hypsometric map paints elevation bands in colour from green valleys to white peaks. It becomes a topographic map when measured contour lines carry the exact heights and sit under the hydrography, transport and land-cover symbols.
What is a contour interval and how do you find it?
The contour interval is the vertical distance in elevation between two adjacent contour lines. On one map sheet, that vertical step stays constant across the whole area: if the interval is 20 m, crossing one line always means 20 m of height gained or lost, whether the lines sit 500 m apart on a plain or 20 m apart on a cliff.
To find the contour interval on a published map, check the map margin first. On USGS quadrangles, the interval is always printed just below the bar scale in the bottom marginalia.
If the margin is cropped off, calculate the interval directly from the lines on the map:
- Find two adjacent thicker, labelled contour lines (the index contours).
- Subtract the lower elevation number from the higher one.
- Divide that difference by 5, because four thin intermediate lines sit between two index lines, creating five steps.
For example, if one thick line reads 1,500 m and the next thick line upslope reads 1,600 m, the height difference is 100 m. Divide 100 m by 5 steps and the contour interval is 20 m.
Index, intermediate, supplementary and depression contours
Topographic maps use four line styles to keep steep slopes readable and flat ground detailed.
| Contour type | How it looks | What it means |
|---|---|---|
| Index contour | Thick solid line, broken every so often for an elevation number | Drawn every fifth line (for example, every 100 m when the interval is 20 m) so your eye can read heights quickly |
| Intermediate contour | Thin solid line, unlabelled | The four regular lines between two index contours, stepped at the map's contour interval |
| Supplementary contour | Thin dashed or dotted line | Drawn at half or a quarter of the regular interval across flat ground where normal contours sit too far apart (Japan's GSI draws them at 5 m or 2.5 m on 1:25,000 maps) |
| Depression contour | Closed loop with short tick marks (hachures) on the inside | A hollow, sinkhole or crater where the ground goes down inside the loop; the ticks point inward and downhill |
Usual contour interval by map scale
Mapmakers pick the contour interval from two things: the map scale and how steep the terrain is. The smaller the scale and the steeper the mountains, the larger the interval must be so the brown lines do not merge into an unreadable band.
| Map series | Scale | Contour interval |
|---|---|---|
| USGS US Topo / 7.5-minute quadrangle (US) | 1:24,000 | 10 ft (3 m) in flat areas, 100 ft (30 m) or more in steep mountains |
| USGS 30 × 60-minute quadrangle (US) | 1:100,000 | 5, 10, 20 or 50 m depending on relief |
| IGN TOP 25 (France) | 1:25,000 | 5 m in plains, 10 m in mountains, 20 m in places |
| Swisstopo national map (Switzerland) | 1:25,000 | 10 m on the Plateau and in the Jura, 20 m in the Alps |
| Swisstopo national map (Switzerland) | 1:50,000 | 20 m |
| Swisstopo national map (Switzerland) | 1:100,000 | 50 m |
| GSI basic topographic map (Japan) | 1:25,000 | 10 m, with index contours every 50 m |
| GSI topographic map (Japan) | 1:50,000 | 20 m, with index contours every 100 m |
When you generate your own contours in GIS or CAD, use three common ranges:
- 1 to 2 m (3 to 6 ft): building sites, drainage plans, gardens and grading work, when backed by LiDAR or a site survey.
- 10 to 20 m (30 to 65 ft): valley and hiking maps.
- 50 to 100 m (160 to 330 ft): regional maps and whole mountain ranges.
Avoid picking an interval much finer than your elevation data can resolve. Drawing 1 m contours from a 30 m global grid draws the staircase noise of the pixels, not real ground features.
How to read contour lines on a map
Read four things on a contour map: how far apart the lines sit, whether they close into loops, which way they bend across valleys and ridges, and whether they have ticks.
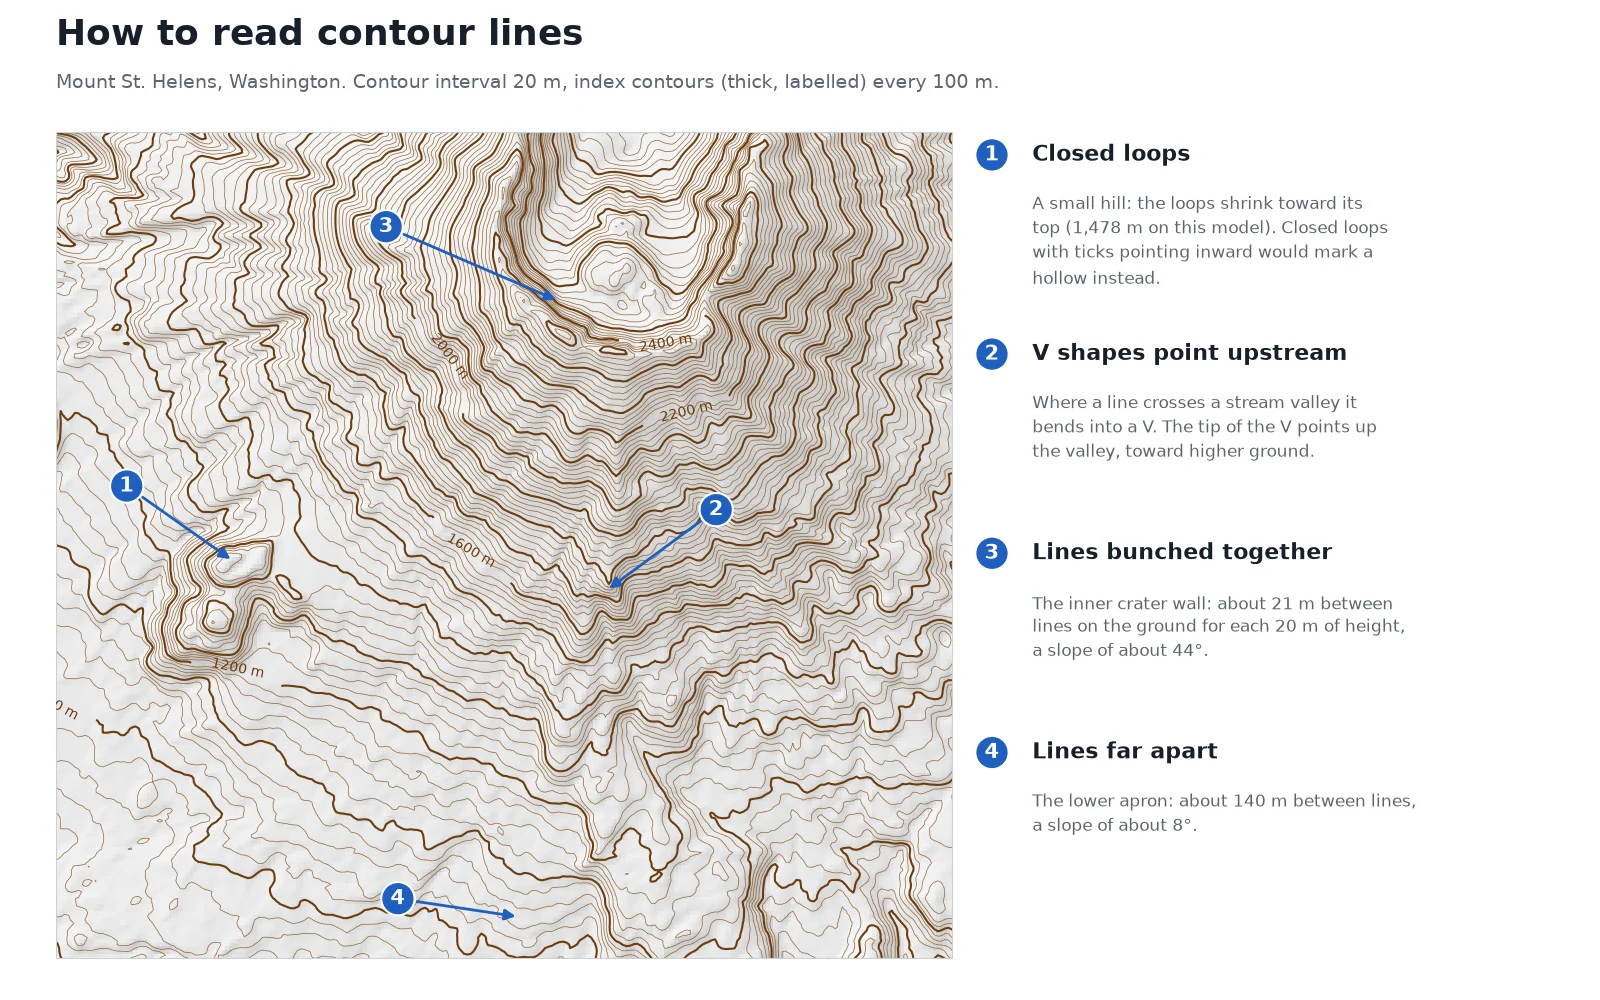
Spacing tells you the slope
Lines close together mean steep ground. Lines far apart mean gentle or flat ground. Lines spaced at equal distances up a hillside mean a uniform, constant slope. When lines crowd closely near the bottom of a hill and spread out near the top, the hill is convex (steep at the base, rounded on top). When they start wide at the bottom and pack tight near the summit, the slope is concave.
You can turn the spacing into an exact slope with two formulas:
- Slope in percent (%) = (contour interval / horizontal ground distance between two lines) × 100
- Slope angle in degrees = arctan(contour interval / horizontal ground distance)
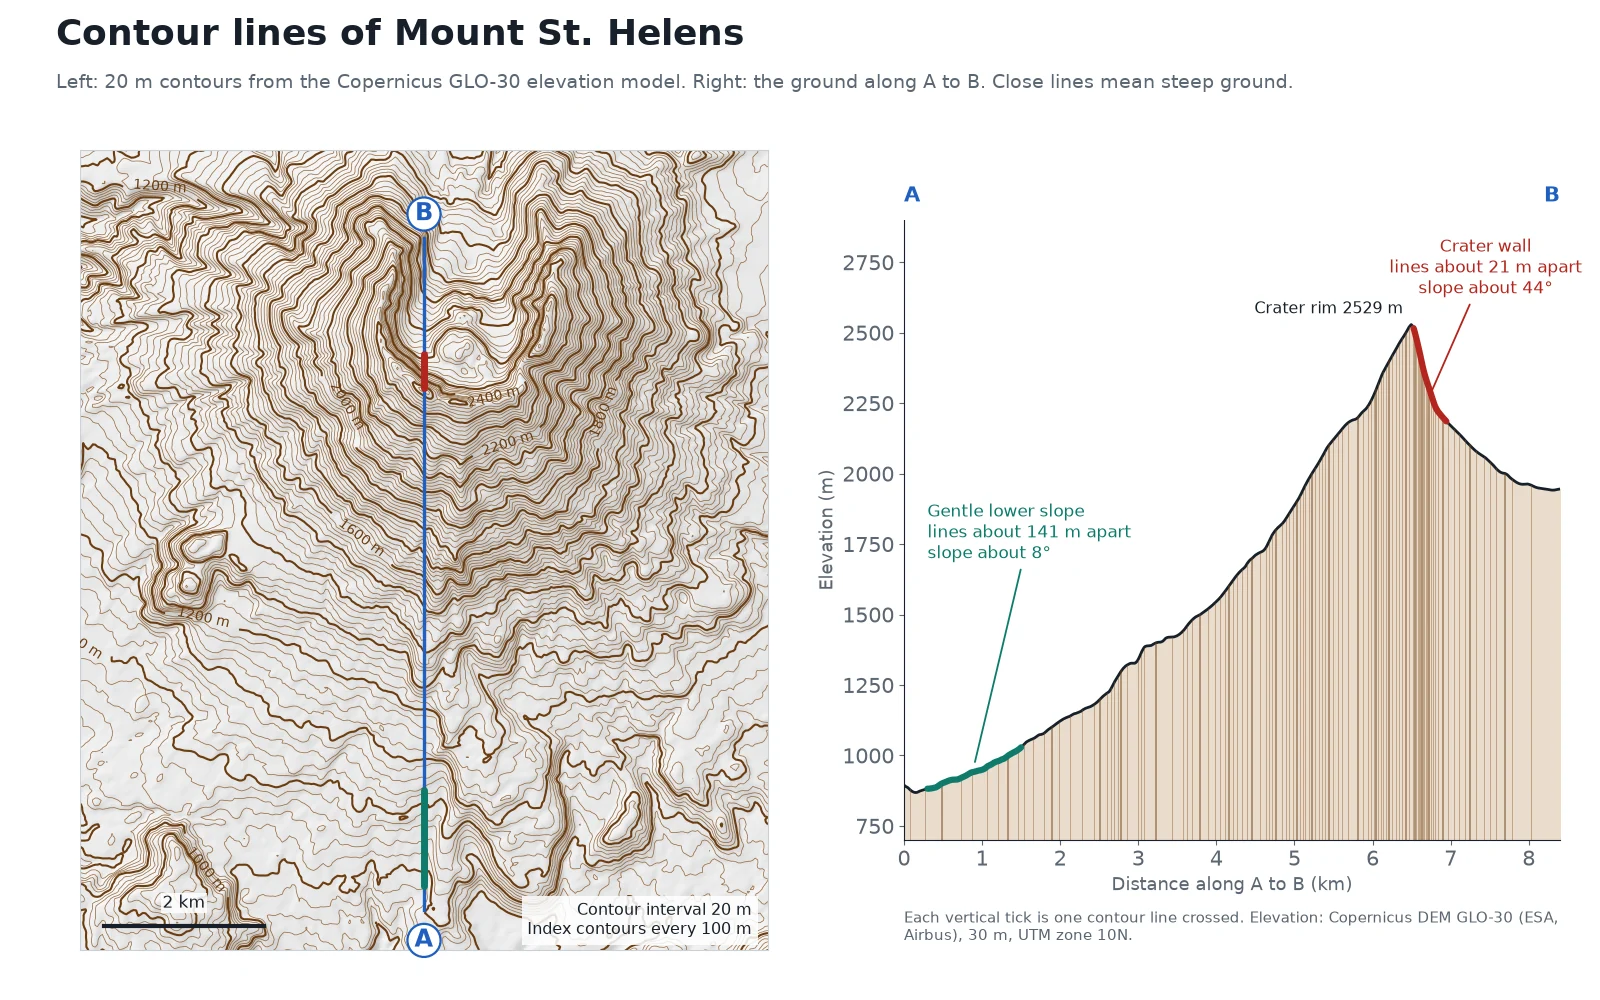
We measured this on Mount St. Helens in Washington State on 16 November 2026, pulling 20 m contours from the Copernicus DEM GLO-30 in WGS 84 / UTM zone 10N and slicing an 8.4 km north-south profile from the southern apron (869 m) across the crater rim (2,529 m on our transect) and down into the breached crater:
| Part of the volcano | Contour interval | Horizontal distance between lines | Slope grade (%) | Slope angle |
|---|---|---|---|---|
| Southern lower apron (marker 4) | 20 m | ~141 m | 14% | ~8° |
| Inner crater wall (marker 3) | 20 m | ~21 m | ~97% | ~44° |
The USGS records show why the northern half of the cone looks cut open: before the 18 May 1980 eruption, the symmetrical summit reached 2,950 m (9,677 ft). The landslide and blast lowered the highest point to 2,549 m (8,363 ft) and left a horseshoe crater open to the north. In our 30 m grid window, the highest cell reads 2,530 m because a 30 m cell averages the sharp crater rim with the drop beside it. To check the height of any point, or draw a line and get a profile like A to B without desktop software, use our free elevation finder.
Closed loops mark a hill or a depression
Concentric closed loops mean a peak or hill: each smaller loop inside is one contour interval higher than the loop around it. At marker 1 west of the main cone, the loops climb until the smallest ring wraps a local summit at 1,478 m.
When a closed loop has short inward tick marks (hachures), the ground drops inside the ring instead of rising. That marks a volcanic crater, a sinkhole or a quarry pit.
The rule of V's for valleys and ridges
When a contour line crosses a stream or river valley, it bends into a V shape whose tip points upstream, toward higher elevation. This is the rule of V's. You can tell which way water flows on a contour map even when the blue river line is missing: water always flows out of the open mouth of the V, perpendicular to the contour lines. At marker 2, on the south flank of Mount St. Helens, the lines bend into V shapes that point up the valley, toward the summit.
Lines that bend into U or softer V shapes pointing downhill, toward lower elevation, mark a ridge or spur running down the mountain.
The rules contour lines never break
- Contour lines never cross. One point on the ground has only one elevation. The sole exception is an overhanging cliff, where a lower contour passes underneath the rock face above it.
- Contour lines never split or branch. Two lines can touch and merge into one line only along a vertical cliff wall.
- Every contour line is a closed loop. If it does not close into a ring within the map frame, it runs to the neatline edge and closes somewhere off the sheet.
Where contour lines come from today
Cartographers once drew contour lines from field surveys and, later, from overlapping aerial photographs. Today most contours are traced by software from a digital elevation model (DEM), a raster grid where each cell holds a height.
For worldwide projects, a common choice is the Copernicus DEM GLO-30, produced by the European Space Agency and Airbus from TanDEM-X radar missions flown between 2011 and 2015. It covers all land areas at 1 arc second (about 30 m pixel size) and is free to read from the AWS Open Data Registry. Our guide to free DEM downloads for QGIS compares four free 30 m models with a LiDAR terrain model, and where to download each.
How to make contour lines in QGIS
In QGIS, the built-in Contour tool runs GDAL's gdal_contour algorithm to thread vector lines through any elevation raster. Follow the QGIS GDAL raster extraction documentation or these four steps:
 , the built-in Contour tool runs GDAL's
Load a DEM in your project
Drag your elevation raster (GeoTIFF) onto the QGIS canvas. Check the vertical units of the DEM: most global and national grids store heights in metres, even when the horizontal CRS is in degrees (
EPSG:4326).Run Raster > Extraction > Contour
Open Raster > Extraction > Contour from the top menu. Pick your DEM as the Input layer, keep Band 1, and enter your step in Interval between contour lines (the default is
10.0, in the elevation units of the raster, not the horizontal units of the CRS). Leave Attribute name asELEVand click Run. If you want filled elevation bands instead of lines, pick Contour Polygons right below it in the same menu, which creates polygons withELEV_MINandELEV_MAXattributes.Smooth the pixel stair-steps (optional)
Contours pulled directly from a 30 m DEM look blocky when you zoom in. Open the Processing Toolbox, run Vector geometry > Smooth on the contour layer with 1 or 2 iterations and an offset of 0.25 to round the corners without shifting the elevations.
Style index lines thicker and add labels
Open the contour layer's Layer Styling panel, switch the renderer from Single Symbol to Rule-based, and create two rules. For a 20 m interval, set the index rule filter to
"ELEV" % 100 = 0with a 0.45 mm brown line, and set the intermediate rule to"ELEV" % 100 != 0with a 0.20 mm line. On the Labels tab, label the layer with theELEVfield placed On line and curved.
Generate contours in the browser or with one prompt in QGIS
If you do not have a DEM file on disk, open our free contour lines generator. Pan to any place on Earth, draw a box up to 400 km² (about 20 × 20 km), and choose an interval between 1 and 500 m (or leave it on Auto, which picks an interval that gives about 30 lines across your box). The tool reads Copernicus DEM GLO-30 on the fly and lets you download the result as GeoJSON, zipped Shapefile, KML or CAD DXF. Every feature carries an elev_m attribute and an index flag on every fifth line; GeoJSON, Shapefile and KML export in EPSG:4326, while the DXF comes in metres in the area's UTM zone, ready for CAD software.
If you work in QGIS, AI Agent, the QGIS plugin we build, makes contours, a hillshade or a slope map for your open project from one sentence.
Read nextDSM vs DTM vs DEM: The Difference, Measured, and Free Downloads
Questions people ask
Contour lines are lines on a map that connect points of equal elevation above a reference level, usually mean sea level. They show the height, steepness and 3D shape of the terrain on a flat sheet of paper or screen. On standard topographic maps, contour lines are printed in brown, with every fifth line drawn thicker and labelled with its height.
A contour interval is the constant vertical height difference between two adjacent contour lines on a map. It is printed in the bottom margin of most topographic maps, right below the bar scale. If the margin is missing, subtract the elevation of one labelled thick index line from the next index line upslope and divide by 5.
When contour lines are close together, the ground is steep because the elevation changes rapidly over a short horizontal distance. On our 20 m contour map of Mount St. Helens, lines spaced 21 m apart on the inner crater wall represent a 44° slope, while lines spaced 141 m apart on the lower apron represent an 8° slope.
Index contours are every fifth contour line on a topographic map, drawn thicker than the four intermediate lines between them and labelled with their elevation in metres or feet. With a 20 m contour interval, the index contours sit every 100 m (for example at 1,400 m, 1,500 m and 1,600 m) so you can read heights without counting every thin line.
Contour lines almost never cross because a single point on the Earth's surface cannot have two different elevations at once. Two contour lines can merge and touch along a vertical cliff, and they can cross only where an overhanging rock cliff juts out above lower ground underneath it.
Load a digital elevation model (DEM) into QGIS and open Raster > Extraction > Contour. Choose your DEM, set the Interval between contour lines in the vertical units of the raster (usually metres), and click Run to create a vector line layer with an ELEV field. You can also generate and download ready-to-use contour lines for any area up to 400 km² in our free contour lines generator.
Do it in QGIS by asking for it
AI Agent carries out the task you describe, in your own QGIS project. Free, no card.