Map Projections Explained: Types, Mercator, and How to Choose
Published
A map projection is a mathematical method that turns curved positions on the Earth (latitude and longitude) into flat x and y coordinates on a screen or sheet of paper. Because a sphere or ellipsoid cannot be flattened without stretching or tearing, every projection distorts at least one of four geographic properties: area, shape, distance, or direction.
Carl Friedrich Gauss proved in 1827 (with his Theorema Egregium) that a curved surface cannot be mapped onto a flat plane without altering distances on the surface. Choosing a projection means deciding which property your map must preserve and where you are willing to accept the stretching. On a world Mercator map, local angles stay exact, but Greenland's area is drawn 16 times too big.
4properties
area, shape, distance, direction
Every flat map distorts at least one of the four
×16.29inflation
Greenland's area on a Mercator map
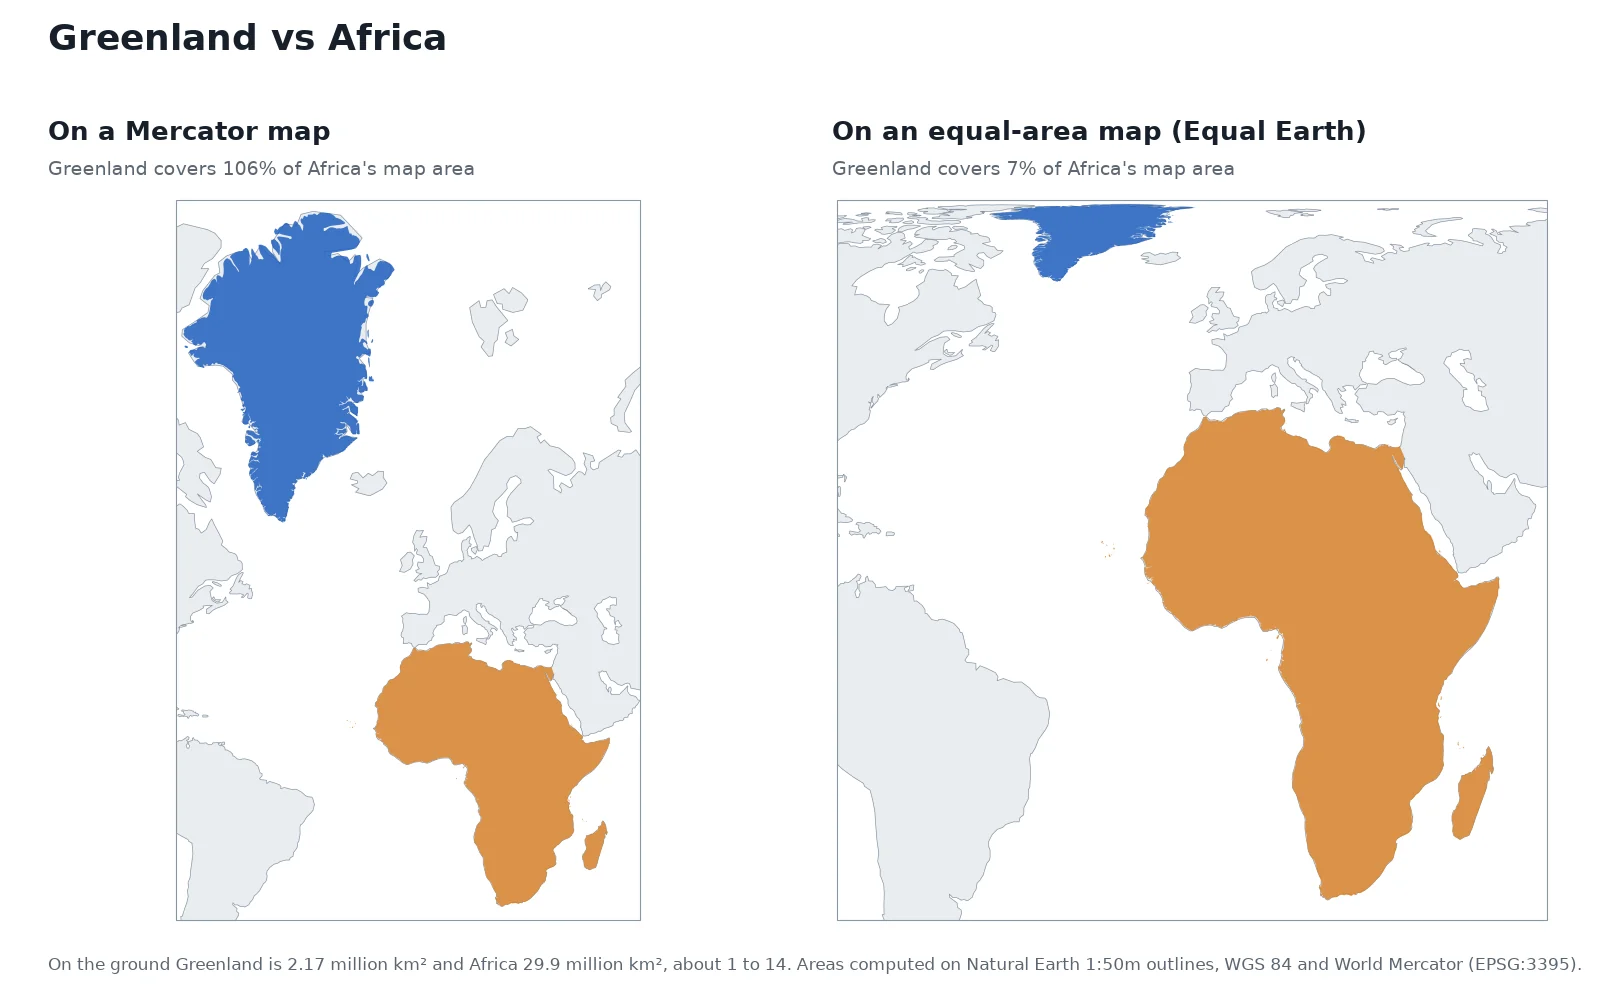
Covers 106% of Africa's map area vs 7% on the ground
85.05°latitude
where Web Mercator cuts off the poles
Turns EPSG:3857 into a square grid for web tiles
What is a map projection?
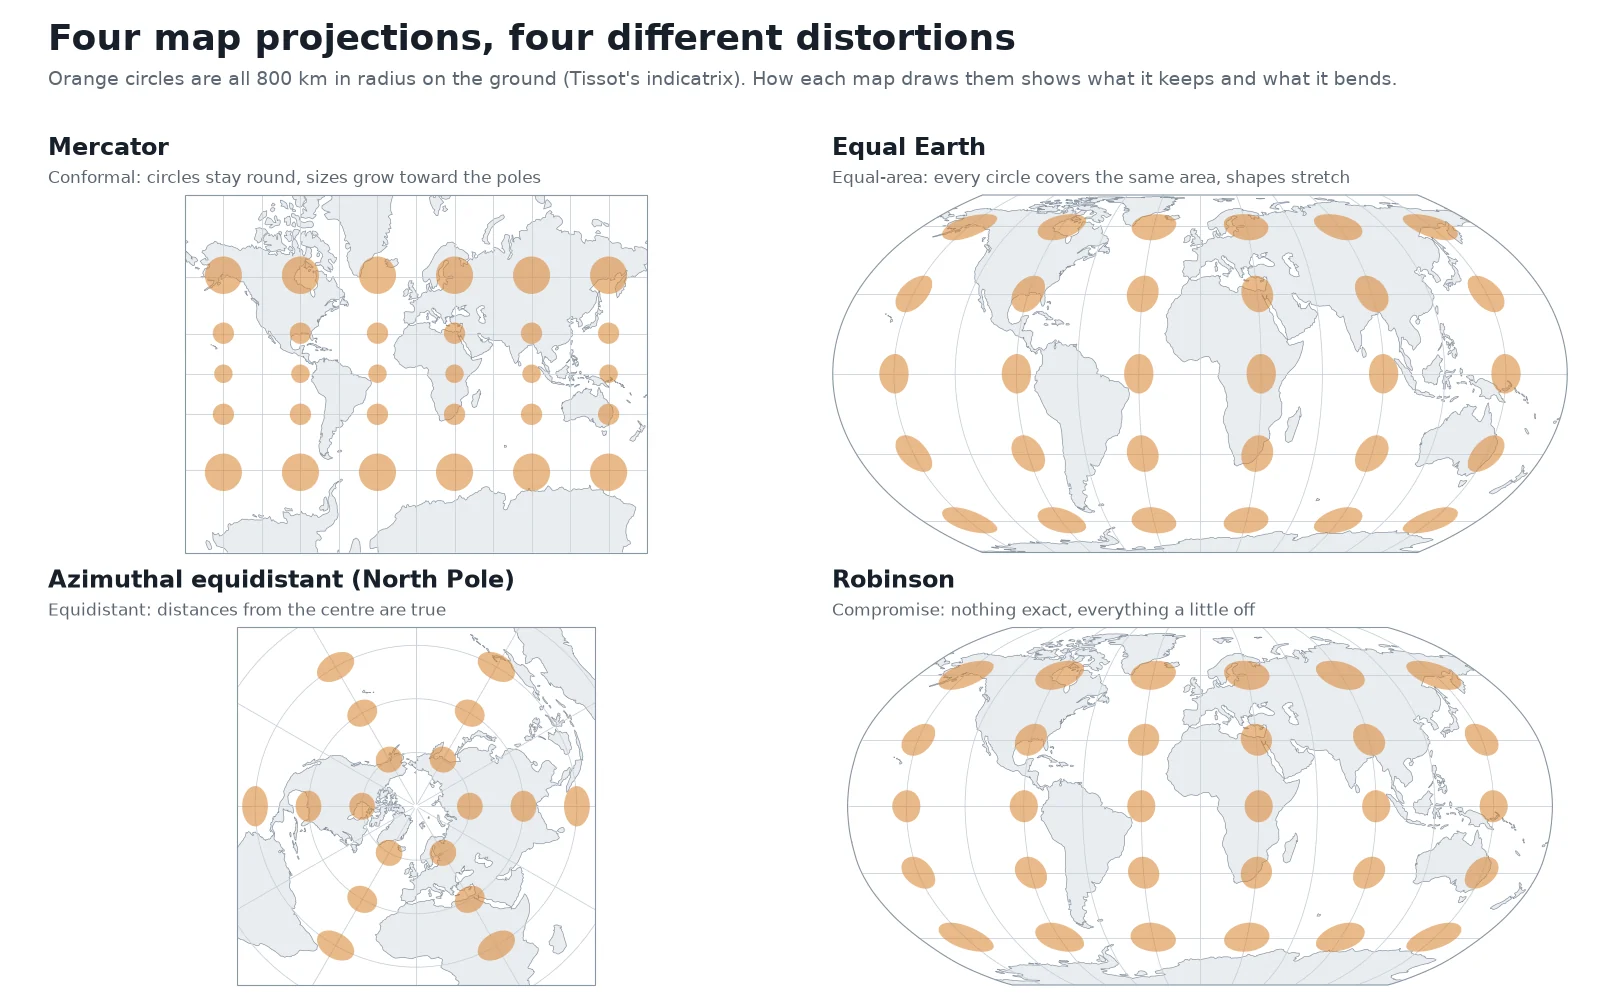
A globe is the only representation of the Earth that keeps areas, shapes, distances, and directions true at the same time. As soon as you flatten the globe onto a 2D surface, the geometry forces a trade-off. Cartographers measure that distortion by placing identical circles on the Earth, called Tissot's indicatrix, and projecting them onto the flat map, as shown in the figure above.
Where a projection stretches the Earth evenly in every direction, the circle stays a circle but grows larger. Where a projection compresses north-south to make up for east-west stretching, the circle flattens into an ellipse.
In GIS software, a map projection is half of a coordinate reference system. Our guide on what a CRS is explains how the projection combines with a datum (the model of the Earth's shape) to get an EPSG code. You can inspect any projection's parameters in our CRS lookup tool.
Types of map projections: what they preserve
Projections are grouped first by the geometric property they keep true. A mathematical rule sits underneath this list: no map projection can be both conformal (true shapes) and equal-area (true sizes).
1. Conformal projections (keep shapes and angles)
A conformal projection preserves local angles. Anywhere on the map, meridians and parallels cross at right angles just as they do on the globe, and the Tissot circles remain perfect circles. That preserves the shape of small features, coastlines, and parcels, which is why sailors, surveyors, and engineers rely on conformal grids. The price is area: to keep shapes round while meridians are pulled apart, the projection has to stretch scale toward the poles or away from its centre line.
- Examples: Mercator, Transverse Mercator (used in UTM zones), Lambert conformal conic, Polar stereographic.
2. Equal-area projections (keep sizes)
An equal-area (or equivalent) projection guarantees that a coin placed anywhere on the map covers the exact same number of square kilometres on the ground. The Tissot markers all have identical area, though they twist into ellipses near the outer edges of the map.
The International Cartographic Association (ICA) recommends using an equal-area projection whenever a world map communicates area or quantities tied to area, such as population density, land cover or climate. The ICA notes that there is no single "correct" equal-area projection: cartographers pick among several depending on how they want the continents shaped.
- Examples: Equal Earth, Mollweide, Albers equal-area conic, Lambert azimuthal equal-area, Gall-Peters.
3. Equidistant projections (keep distances along set lines)
No flat map can keep distances true between all pairs of points. An equidistant projection preserves true scale along specific lines only: either outward along straight lines from one central point, or north-south along all meridians.
- Examples: Azimuthal equidistant (true distance and direction from the centre point only), Plate carrée / equirectangular (true distance along meridians and the equator).
4. Azimuthal projections (keep direction from the centre)
Azimuthal (or planar) projections preserve the true compass bearing (azimuth) from one central point to every other point on the map. Many azimuthal projections also belong to one of the groups above: polar stereographic is both azimuthal and conformal, while azimuthal equidistant keeps both direction and distance from its centre.
5. Compromise projections (balance the errors)
Compromise projections preserve neither exact angles nor exact areas. Instead, they share the distortion between shape and size so that the continents look familiar to the eye without extreme polar inflation.
In 1988, the National Geographic Society adopted the Robinson projection (designed in 1963) for its world reference maps; in 1998, it switched to the Winkel Tripel projection, designed by Oswald Winkel in 1921.
Map projection families: cylinder, cone, and plane
Cartographers also classify projections by the geometric shape (the developable surface) that can be wrapped around the globe, traced with the outlines of the continents, and unrolled flat without stretching.
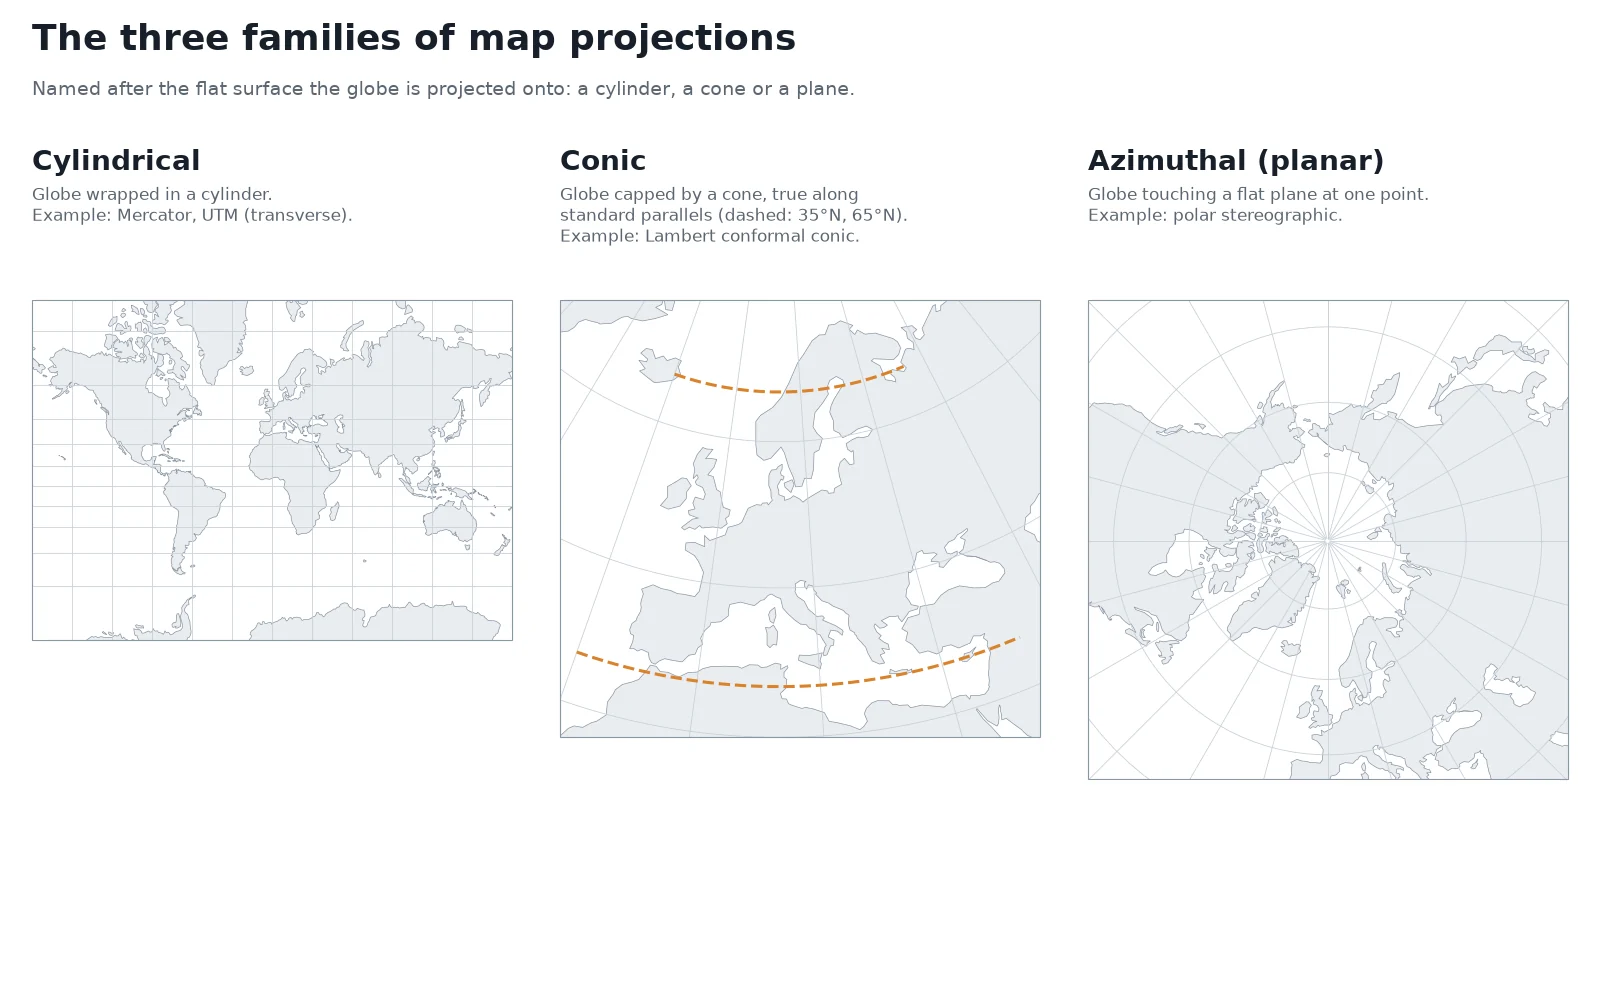
- Cylindrical projections wrap a tube around the globe. In a normal cylindrical projection like Mercator or Plate carrée, the cylinder touches the equator: scale is true along the equator and distortion grows toward the poles. If you turn the cylinder 90 degrees so it touches a meridian from pole to pole, you get a transverse cylindrical projection, the basis of the 60 narrow UTM zones.
- Conic projections set a paper cone over a hemisphere so it touches along one latitude circle, or slices through the globe along two standard parallels. Along those standard parallels, scale distortion is zero. Conic projections such as Lambert conformal conic and Albers equal-area conic fit mid-latitude countries and continents that stretch further east-west than north-south, like the United States, Europe, or France.
- Azimuthal (planar) projections press a flat sheet against the globe at a single point, often the North or South Pole. Distortion radiates outward in concentric rings from that tangent point, making them the standard choice for Arctic and Antarctic mapping.
- Pseudocylindrical projections (such as Equal Earth, Mollweide, and Robinson) are mathematical constructions that cannot be unrolled from a physical cone or cylinder. They draw parallels of latitude as straight horizontal lines and curve the meridians inward toward the poles to keep high-latitude areas under control.
The Mercator projection: why Greenland looks as big as Africa
Gerardus Mercator published his world map in 1569 for one specific job: sea navigation. On the curved Earth, if a ship steers a constant compass bearing (say, 60 degrees east of north), its path spirals across the meridians in a curve called a rhumb line or loxodrome. Mercator spaced the parallels of latitude progressively further apart toward the poles at the exact rate that the converging meridians are pulled apart into vertical straight lines.
Because the north-south scale and east-west scale stretch by the same factor at every latitude, every compass bearing becomes a straight line on the chart. A navigator could lay a ruler between two ports, read the angle against a meridian with a protractor, and steer that compass heading across the ocean.
How Mercator scale grows with latitude
That navigation property comes with a severe geometric cost at world scale. On a sphere, the circumference of a latitude circle shrinks by the cosine of the latitude (cos φ). Because Mercator stretches every parallel back out to the full length of the equator, its linear scale grows as 1 / cos(latitude), and its area scale grows as 1 / cos²(latitude):
- At 0° (Equator): linear scale is ×1.00, area is ×1.00 (true size).
- At 30° (Cairo, New Orleans): area is inflated ×1.33.
- At 45° (Milan, Montreal): area is inflated ×2.00.
- At 60° (Oslo, Anchorage): linear scale is ×2.00, area is inflated ×4.00.
- At 70° (Tromsø, northern Alaska): area is inflated ×8.5.
- At 80° (Svalbard, northern Greenland): area is inflated ×33.
- At 90° (North and South Poles):
cos(90°) = 0, so the poles sit at infinity and cannot be drawn on a Mercator map at all.
You can drag any country north or south on our interactive True Size Map to watch this 1 / cos²(latitude) expansion happen in real time and compare country footprints at the same latitude.
Measured Mercator area inflation for 16 countries
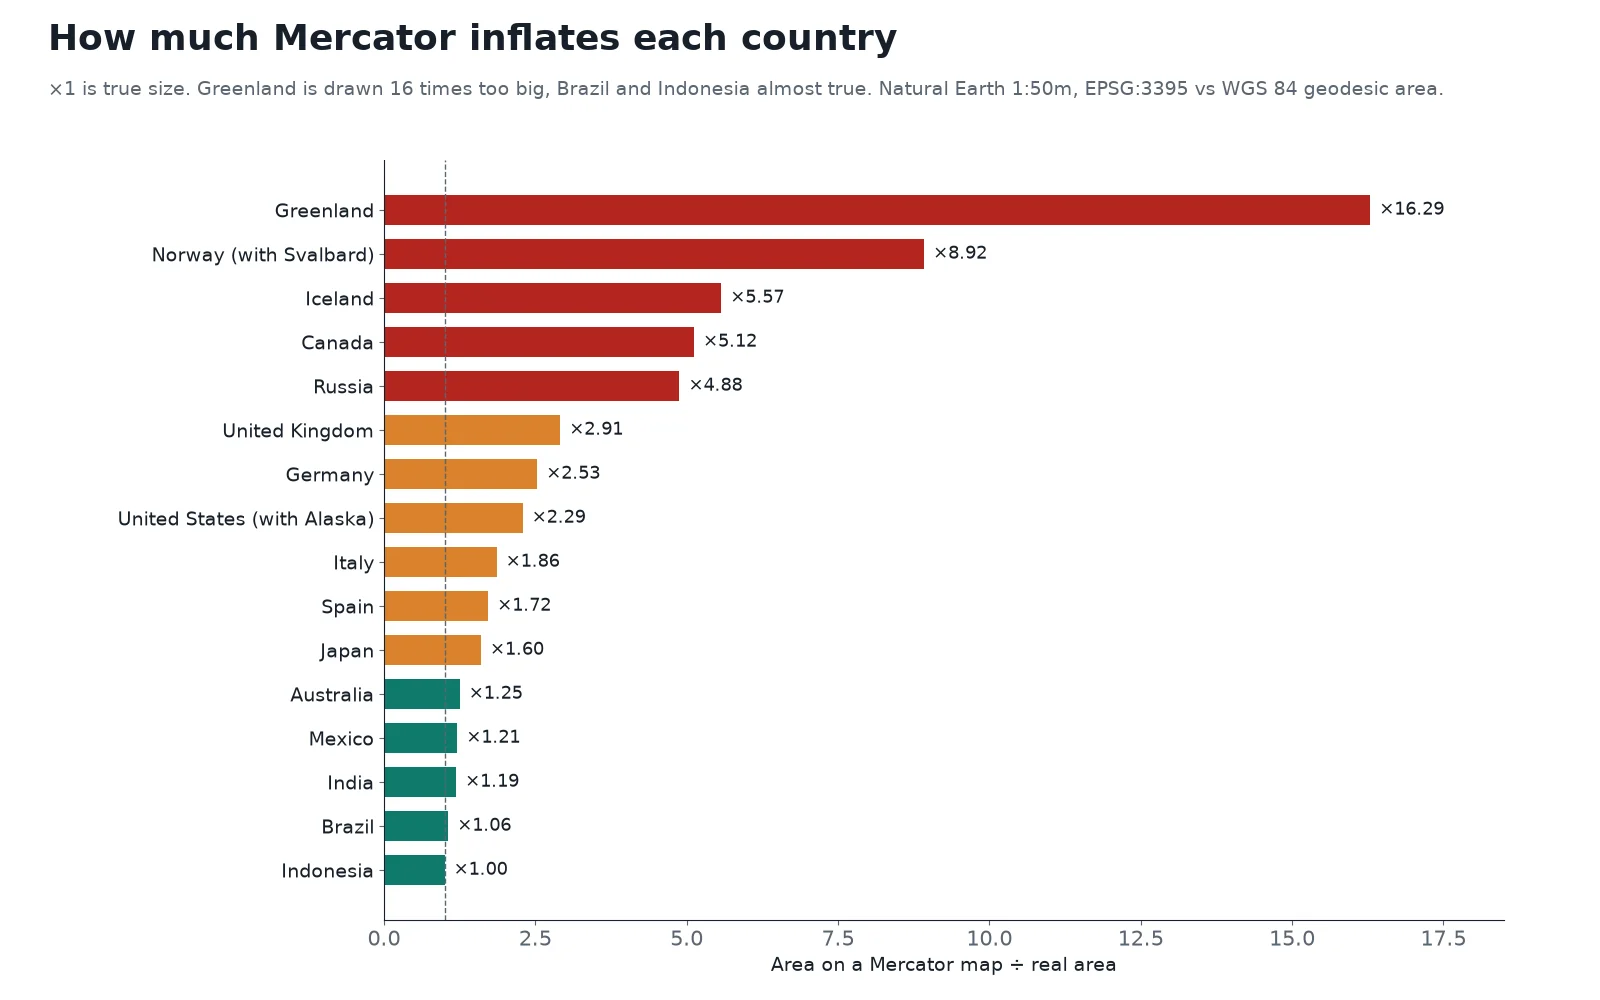
To replace rough textbook estimates with exact country figures, we computed the true geodesic area on the WGS 84 ellipsoid and the flat projected area on World Mercator (EPSG:3395) for 16 countries using Natural Earth 1:50m boundaries.
| Country | Real geodesic area (km²) | Area on Mercator ÷ real area |
|---|---|---|
| Greenland | 2,171,354 | ×16.29 |
| Norway (with Svalbard) | 386,809 | ×8.92 |
| Iceland | 101,819 | ×5.57 |
| Canada | 9,923,056 | ×5.12 |
| Russia | 16,973,548 | ×4.88 |
| United Kingdom | 240,645 | ×2.91 |
| Germany | 357,461 | ×2.53 |
| United States (with Alaska) | 9,455,760 | ×2.29 |
| Italy | 300,794 | ×1.86 |
| Spain | 506,723 | ×1.72 |
| Japan | 370,275 | ×1.60 |
| Australia | 7,691,284 | ×1.25 |
| Mexico | 1,957,878 | ×1.21 |
| India | 3,148,250 | ×1.19 |
| Brazil | 8,467,129 | ×1.06 |
| Indonesia | 1,863,915 | ×1.00 |
Note on data: areas above come from generalised Natural Earth 1:50m polygons so the same geometry is measured in both systems; official survey totals differ slightly (for example, the CIA World Factbook lists Greenland at 2,166,086 km²).
Look at how latitude drives the whole table. Indonesia straddles the equator, so its Mercator footprint is virtually identical to its real area (×1.00). Brazil sits mostly in the tropics and grows by only 6% (×1.06). By the time you reach central and northern Europe, Germany is drawn at 2.53 times its ground proportion and the United Kingdom at 2.91 times. Above the Arctic Circle, Svalbard pulls Norway's combined footprint up to ×8.92, and Greenland comes out at ×16.29 over its whole area.
Web Mercator (EPSG:3857) and online basemaps
When Google Maps launched in 2005, it needed a projection where north was always straight up, local streets kept their right-angle intersections anywhere in the world, and the whole planet could be sliced into a neat pyramid of 256×256-pixel square tiles. It adopted a spherical variant of Mercator now standardized as Web Mercator (EPSG:3857), and OpenStreetMap, Bing Maps, and Esri basemaps followed.
To make the world map a perfect square (as tall as it is wide), Web Mercator cuts off the planet at 85.0511° north and south. That works well for street navigation and zooming into cities, where local angles are true. It is wrong for measuring area or showing global thematic data: as we measured in our CRS guide, calculating polygon area directly on an EPSG:3857 layer inflates a 1 km² square to 1.73 km² in Madrid and 3.97 km² in Oslo.
Common map projections compared
The table below lists the 11 projections you will meet most often in GIS software, data portals, and atlases, along with their EPSG or Esri codes.
| Projection | Property | Family | Typical use | Common CRS code |
|---|---|---|---|---|
| Mercator | Conformal | Cylindrical | Sea navigation (rhumb lines), web map tiles | EPSG:3395 (world), EPSG:3857 (Web Mercator) |
| Transverse Mercator (UTM) | Conformal | Cylindrical (transverse) | National grids, land surveying, local GIS analysis | EPSG:32601 to 32660 (N), EPSG:32701 to 32760 (S) |
| Lambert conformal conic | Conformal | Conic | Mid-latitude countries, aeronautical charts, France's legal grid | EPSG:2154 (RGF93 / Lambert-93) |
| Albers equal-area conic | Equal-area | Conic | Statistical and thematic maps of mid-latitude countries (US national maps) | EPSG:5070 (NAD83 / Conus Albers) |
| Equal Earth | Equal-area | Pseudocylindrical | World choropleths and thematic maps | EPSG:8857 |
| Mollweide | Equal-area | Pseudocylindrical | World distribution maps (published 1805) | ESRI:54009 |
| Robinson | Compromise | Pseudocylindrical | World classroom and reference wall maps (National Geographic 1988 to 1998) | ESRI:54030 |
| Winkel Tripel | Compromise | Modified azimuthal | World reference maps (National Geographic since 1998) | ESRI:54042 |
| Azimuthal equidistant | Equidistant from centre | Azimuthal | Flight range, radio reach, seismic distance from one city | Custom (centred on target point) |
| Polar stereographic | Conformal | Azimuthal | Polar regions beyond UTM (80°S and 84°N), sea-ice grids | EPSG:3413 (Arctic sea-ice grid) |
| Plate carrée (equirectangular) | Equidistant along meridians | Cylindrical | What GIS displays when EPSG:4326 degrees are plotted straight as x and y | EPSG:4326 drawn flat |
Equal Earth (EPSG:8857) deserves special note for GIS users. In 2017, Boston Public Schools switched its classroom world maps from Mercator to the Gall-Peters equal-area projection, which corrects country sizes but stretches tropical continents vertically and high-latitude land horizontally. In response to the debate, cartographers Bojan Šavrič, Tom Patterson, and Bernhard Jenny published Equal Earth in 2018, giving GIS software a curved-meridian projection that is strictly equal-area while keeping continental outlines close to their globe shapes.
How to choose the right map projection
Standard cartographic practice, laid out in John P. Snyder's USGS Professional Paper 1395, Map Projections: A Working Manual, breaks the decision into three steps: check whether an official grid already exists, decide which geometric property your map must preserve, and match the projection family to the shape and latitude of your region.
1. For a single country or state, use the official grid
If your project sits inside one country, province, or city, you rarely need to design a projection from scratch. National mapping agencies have already chosen a conformal projection tailored to their territory:
- France: RGF93 / Lambert-93 (
EPSG:2154), a Lambert conformal conic projection. - Much of Europe: ETRS89 paired with the local UTM zone (such as
EPSG:25832in Germany). - United States: State Plane zones or NAD83 / UTM for engineering and local GIS, and NAD83 / Conus Albers (
EPSG:5070) for nationwide area statistics. - Anywhere else under 6° wide: the local UTM zone (
EPSG:326xxnorth,EPSG:327xxsouth).
2. Match the property to the map's purpose
When you are mapping a continent or the whole world, pick the projection by what the reader or the GIS tool will do with it:
- Comparing areas, densities, or totals by region (choropleths, land cover, habitats): always use an equal-area projection. Use Equal Earth (
EPSG:8857) or Mollweide for the world, Albers equal-area conic for a mid-latitude continent, or Lambert azimuthal equal-area (such asEPSG:3035in Europe). - Navigation, surveying, engineering, or preserving local street and coastline shapes: use a conformal projection (Transverse Mercator / UTM, Lambert conformal conic, or Polar stereographic at the poles).
- Showing distance and direction from one point (airports, antennas, epicentres): use an azimuthal equidistant projection centred on that coordinate.
- A general reference map of the world with no area calculation: use a compromise projection (Winkel Tripel or Robinson) or Equal Earth.
3. Match the projection family to the region's shape
If you are picking a continental or regional projection, match the developable surface to the geography:
| Region shape and latitude | Best projection family | Why |
|---|---|---|
| Along the equator and tropics | Cylindrical (normal) | A cylinder touching the equator keeps distortion lowest across the tropical belt |
| Mid-latitudes, wider east-west than north-south (US, Europe, China, Russia) | Conic (Albers or Lambert conformal) | Two standard parallels placed about one-sixth inside the top and bottom of the map hold scale tight across a wide belt |
| Narrow and long north-south (Chile, Britain, New Zealand, a single UTM strip) | Transverse cylindrical (Transverse Mercator) | Turning the cylinder sideways puts the line of true scale along the central meridian |
| Polar regions (Arctic, Antarctica) or compact circular areas | Azimuthal / planar (Polar stereographic, Lambert azimuthal) | Distortion grows evenly in rings from the pole instead of tearing along a top edge |
How to change the map projection in QGIS
When you load a global dataset in EPSG:4326 into QGIS, the canvas draws latitude and longitude directly as x and y coordinates, producing a flat, horizontally stretched Plate carrée view. Switching the project CRS changes the map projection on the fly without altering your files on disk.
 , the canvas draws latitude and longitude directly as x and y coordinates, producing a flat, horizontally stretched Plate carrée view. Switching the project CRS changes the map projection on the fly without altering your files on disk.
Open Project Properties > CRS
Click the
EPSG:...button in the bottom-right corner of the QGIS status bar (or select Project > Properties > CRS from the top menu).Filter by projection name or EPSG code
Type
Equal Earthor8857(for a world equal-area map),Winkel(for a world reference map), or your local UTM code into the Filter box. Select the coordinate system in the list and click OK. QGIS immediately reprojects all loaded layers on the fly into the new projection.Check the measurement ellipsoid before computing areas
Open Project > Properties > General and look under Measurements. Make sure Ellipsoid is set to your datum's ellipsoid (such as
WGS 84 (EPSG:7030)) rather thanNone / Planimetric. With an ellipsoid selected, the$areaexpression and the Measure Area tool calculate true geodesic area on the curved Earth even if your canvas is currently displayed in Web Mercator.
If you are building a thematic map in QGIS and do not want to hunt through EPSG codes by hand, AI Agent, the QGIS plugin we build, can switch the project or layer projection and build a choropleth in an equal-area CRS from a single sentence.
Questions people ask
A map projection is a mathematical formula that transforms three-dimensional positions on the curved Earth (latitude and longitude) into two-dimensional x and y coordinates on a flat map. Because a sphere or ellipsoid cannot be flattened without stretching, every map projection distorts at least one of four properties: area, shape, distance, or direction.
By the property they preserve, the main types are conformal projections (which keep local angles and shapes true, like Mercator and UTM), equal-area projections (which keep country and parcel sizes proportional, like Equal Earth and Albers), equidistant projections (which keep distance true from one centre point or along meridians), and compromise projections (like Robinson and Winkel Tripel). By geometric surface, they are grouped into cylindrical, conic, azimuthal (planar), and pseudocylindrical families.
Gerardus Mercator designed his 1569 projection so that any line of constant compass bearing is a straight line for sea navigation. To keep local angles true while pulling the converging meridians apart into parallel vertical lines, the projection stretches north-south scale at the same rate as east-west scale, causing area inflation to grow as 1 / cos²(latitude), reaching 4 times true area at 60° latitude and over 16 times across Greenland.
No, Africa is nearly 14 times larger than Greenland on the ground, with an area of 29.9 million km² compared with Greenland's 2.17 million km². On a Mercator map, high-latitude stretching inflates Greenland by a factor of 16.29 so that it covers 106% of Africa's map area, whereas on an equal-area projection like Equal Earth, Greenland covers its true 7%. You can compare them directly on our True Size Map.
Google Maps, OpenStreetMap, Bing Maps, and most online basemaps use Web Mercator (EPSG:3857), a spherical Mercator projection clipped at 85.0511° north and south so the world fits into a square grid of map tiles. Web Mercator keeps north at the top and preserves street angles when you zoom in, but it severely inflates areas away from the equator and should never be used for planar area measurements.
For a local or national project, use your country's official grid (such as Lambert-93 EPSG:2154 in France) or the local UTM zone. For continental or world thematic maps that compare areas, densities, or land cover, use an equal-area projection such as Equal Earth (EPSG:8857) for the globe or Albers equal-area conic (EPSG:5070 in the US) for mid-latitudes.
Do it in QGIS by asking for it
AI Agent carries out the task you describe, in your own QGIS project. Free, no card.