Map Scale Explained: Ratio, Bar Scale, Large vs Small Scale
Published
Map scale is the ratio between a distance on a map and the corresponding distance on the ground. A scale of 1:25,000 means one unit on the map equals 25,000 of the same units in the real world, so 1 cm on the paper represents 25,000 cm (250 m) on the ground, and 4 cm represents 1 km.
Every flat map shrinks the Earth to fit a sheet of paper or a screen. The scale tells you how much it was shrunk, how much territory fits in the frame, and which details had to be dropped to keep the map readable.
250m
1 cm on a 1:25,000 map
4 cm on the map = 1 km on the ground
2,000ft
1 inch on a 1:24,000 map
USGS 7.5-minute topographic series
100xmore area
when the denominator is 10x larger
1:50,000 covers 100x the area of 1:5,000
What are the three types of map scale?
Cartographers write scale on a map in three ways: a ratio, a sentence, or a drawn ruler. Most printed topographic maps include at least two of them in the margin.
| Type | Also called | Example | Best property | Main drawback |
|---|---|---|---|---|
| Ratio | Representative fraction (RF) | 1:24,000 or 1/24,000 | Unit-free: works in cm, inches, or any other unit | Becomes wrong if the map is resized or zoomed |
| Verbal scale | Statement of scale | "1 inch to 2,000 feet" or "1 cm = 250 m" | Easy to read without doing unit conversions | Tied to one system of units; breaks if resized |
| Graphic scale | Bar scale or linear scale | A ruler drawn on the map marked 0 to 1 km | Stays accurate when the map is enlarged, shrunk, or shown on a screen | Takes up space on the map face |
Ratio or representative fraction
A ratio scale compares one map unit to the number of ground units it represents, written with a colon (1:50,000) or as a fraction (1/50,000). The number on the left is always 1. The number on the right is the scale denominator.
Because both sides of the ratio use the same unit, the fraction has no unit of its own. On a 1:50,000 map, 1 cm equals 50,000 cm (500 m), 1 inch equals 50,000 inches (about 1,389 yards), and 1 foot equals 50,000 feet.
Verbal scale
A verbal scale states the relationship in everyday words so the reader does not have to convert centimetres to kilometres or inches to feet. The classic USGS 7.5-minute topographic map has a ratio of 1:24,000, which translates to the verbal scale "1 inch equals 2,000 feet" (because 2,000 x 12 inches = 24,000 inches).
Older British Ordnance Survey and US maps often used "1 inch to 1 mile". One statute mile is 5,280 feet, or 63,360 inches, so its exact ratio is 1:63,360. The abandoned USGS 15-minute map series rounded that denominator to 1:62,500, described by the USGS as "1 inch = approximately 1 mile".
Graphic or bar scale
A bar scale is a small ruler printed directly on the map, divided into round ground distances such as metres, kilometres, or miles.
Large scale vs small scale maps
A large-scale map shows a small area in great detail, and a small-scale map shows a large area with less detail.
People often mix the two up because in everyday speech "large-scale" means covering a big area. In cartography, "large" and "small" refer to the fraction, not the territory. Write the ratio as a fraction and compare the numbers: 1/1,000 is a much larger number than 1/1,000,000. Therefore, 1:1,000 is a large scale and 1:1,000,000 is a small scale.
A feature on the ground, say a 100 m city block, is drawn large (10 cm long) on a 1:1,000 map and tiny (0.1 mm, invisible) on a 1:1,000,000 map.
| Feature | Large-scale map | Medium-scale map | Small-scale map |
|---|---|---|---|
| Typical ratio | 1:500 to 1:25,000 | 1:50,000 to 1:100,000 | 1:250,000 and smaller |
| Fraction size | Large (1/1,000) | Medium (1/50,000) | Small (1/5,000,000) |
| Area covered | A parcel, neighbourhood, or town | A city, county, or national park | A state, country, continent, or the world |
| Buildings | Individual footprints drawn to shape | Grouped into urban blocks or dots | Replaced by a single dot for the whole city |
| Roads | All streets and alleys | Main roads and local connectors | Highways and major roads only |
| Typical users | Architects, surveyors, hikers, utilities | Regional planners, land managers | Atlases, wall maps, national overviews |
There is no single international cutoff between large, medium, and small. The USGS groups its maps into three bands: 1:24,000 as large-scale detailed maps "useful for engineering, local area planning, and recreational purposes"; 1:50,000 to 1:100,000 as intermediate-scale maps for land management and planning; and 1:250,000 to 1:1,000,000 as small-scale maps for regional and statewide planning.
Common map scales and what they show
Doubling the scale denominator halves every length on the map and divides the map area of a feature by four. Multiplying the denominator by 10 fits 10 times more ground width and 100 times more ground area into the same sheet of paper.
The table below shows what 1 cm on the map represents in the real world, and how much ground fits on a standard A4 page (21 x 29.7 cm, edge to edge) from large scale at the top to small scale at the bottom.
| Scale | 1 cm on the map | Ground covered by an A4 sheet | Typical use |
|---|---|---|---|
1:1,000 | 10 m (33 ft) | 210 x 297 m | Site plans, building plots |
1:5,000 | 50 m (164 ft) | 1.05 x 1.49 km | A town centre, street by street |
1:10,000 | 100 m (328 ft) | 2.1 x 3.0 km | City maps |
1:25,000 | 250 m (820 ft) | 5.3 x 7.4 km | Hiking maps (IGN TOP 25, GSI Japan 1:25,000, close to USGS 1:24,000) |
1:50,000 | 500 m (1,640 ft) | 10.5 x 14.9 km | Regional topographic maps |
1:100,000 | 1 km (0.62 mi) | 21 x 30 km | USGS 30 x 60-minute series, road maps |
1:250,000 | 2.5 km (1.55 mi) | 53 x 74 km | Regional planning |
1:1,000,000 | 10 km (6.2 mi) | 210 x 297 km | A large state or small country on one sheet |
1:10,000,000 | 100 km (62 mi) | 2,100 x 2,970 km | Whole continents in a world atlas |
If you want to measure a real distance or an area right now without a paper map or a calculator, click the points on our free distance calculator or draw a polygon on the area calculator.
How to calculate distance from map scale
Two formulas handle every map scale conversion. Keep the units the same during the multiplication or division, then convert to metres, kilometres, feet, or miles at the end.
- Ground distance = map distance x scale denominator
- Map distance = ground distance / scale denominator
1. From map distance to ground distance (metric)
You measure 3.2 cm between two trail junctions on a 1:50,000 topographic map.
- Multiply by the denominator:
3.2 cm x 50,000 = 160,000 cm. - Convert centimetres to metres (divide by 100):
160,000 / 100 = 1,600 m. - Convert to kilometres (divide by 1,000): 1.6 km.
A faster mental shortcut is to convert 1 cm first. On a 1:50,000 map, knock off the last two zeros to get metres: 1 cm = 500 m (or 0.5 km). Then multiply 3.2 x 0.5 km = 1.6 km.
2. From map distance to ground distance (US customary)
You measure 1 inch on a 1:24,000 USGS map.
- Multiply by the denominator:
1 inch x 24,000 = 24,000 inches. - Convert inches to feet (divide by 12):
24,000 / 12 =2,000 feet.
3. From ground distance to map distance
You need to draw a 2 km straight road on a 1:25,000 plan.
- Convert the ground distance to centimetres:
2 km = 2,000 m = 200,000 cm. - Divide by the denominator:
200,000 cm / 25,000 =8 cm on the page.
4. Finding the scale of an unmarked map
If a map has lost its legend, find two landmarks whose real ground distance you know (or measure between them on our distance calculator). Suppose two bridges are 1.5 km (150,000 cm) apart on the ground and 6 cm apart on the printed map. Divide ground distance by map distance: 150,000 / 6 = 25,000. The map scale is 1:25,000.
Scale, generalization and data resolution
Shrinking a map means more than printing the same lines smaller. If you take a 1:5,000 map and shrink it ten times to 1:50,000 without editing it, the streets turn into hairlines, the text becomes unreadable, and the buildings merge into a black smudge. Cartographers call this cleaning-up process generalization.
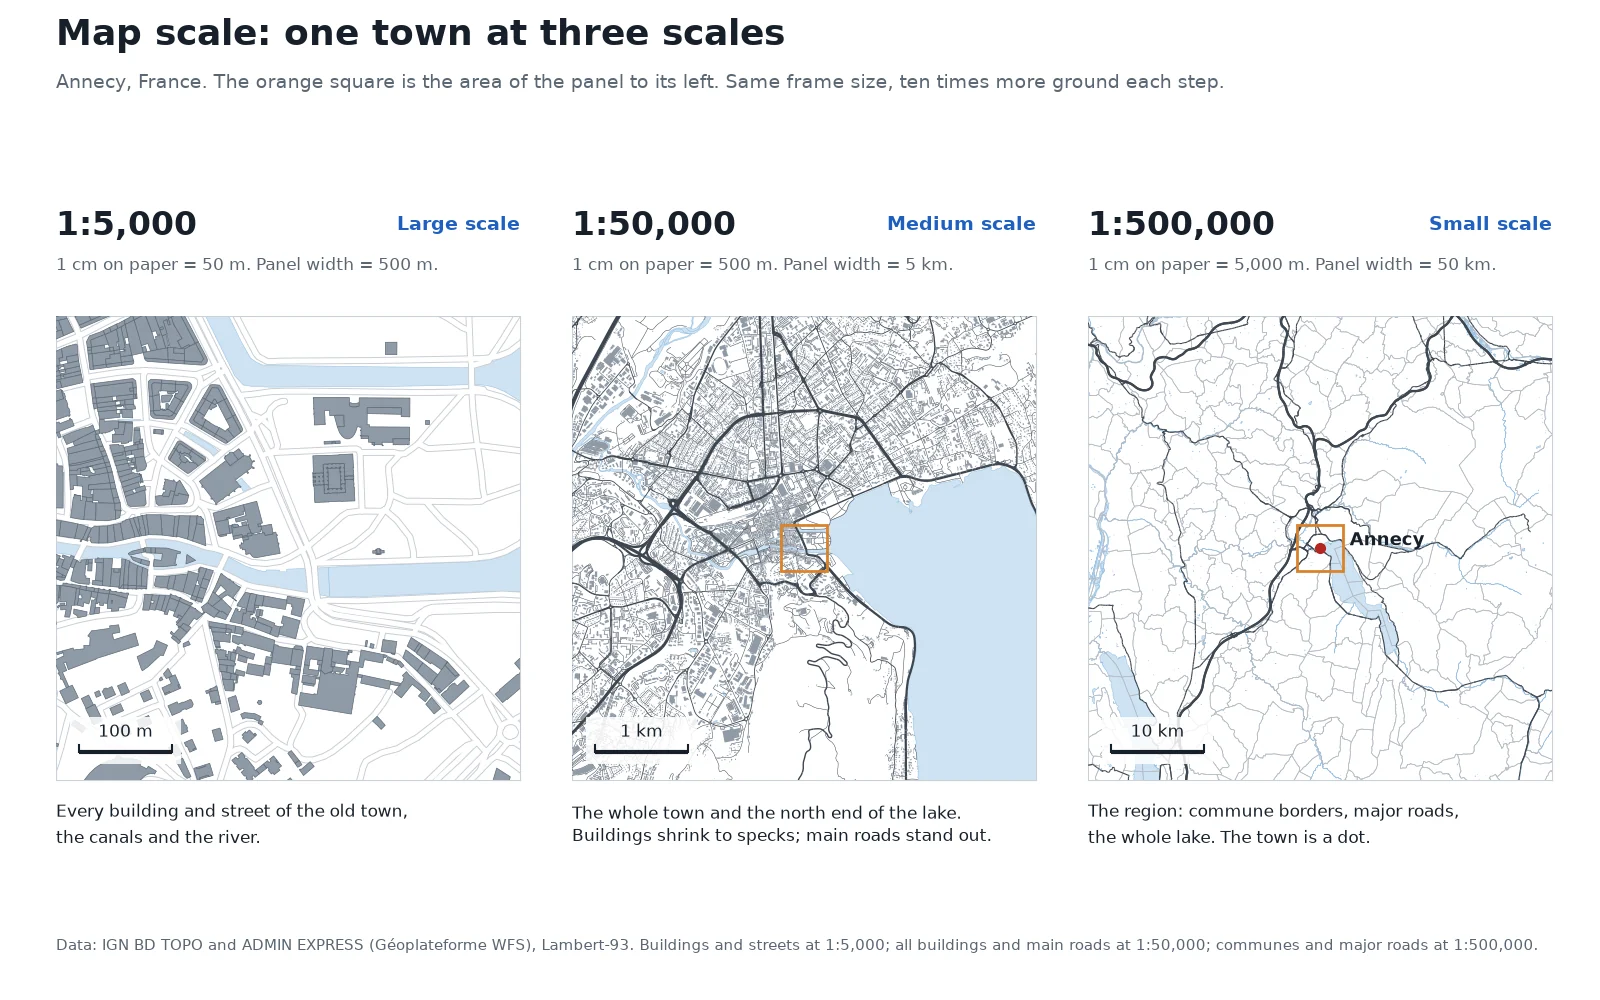
Look back at the three panels of Annecy at the top of this page, all built from IGN's BD TOPO and ADMIN EXPRESS databases in Lambert-93:
- At 1:5,000 (500 m across in a 10 cm square), the map draws every one of the 580 buildings and 244 road segments in the old town, along with the canals and the Thiou river.
- At 1:50,000 (5 km across), the frame holds 18,902 buildings and 6,545 road segments. Individual roofs are now specks less than a millimetre wide, minor paths drop out, and the main roads are drawn wider than their true ground scale so your eye can follow them.
- At 1:500,000 (50 km across), all 18,902 buildings are gone. Only the 250 commune borders, the major highways, the outline of Lake Annecy, and a single point symbol for the city remain.
Elevation layers generalize in the same way. Swisstopo draws contour lines every 10 m on its 1:25,000 maps (20 m in the Alps), every 50 m at 1:100,000 and every 100 m at 1:200,000, so the slopes do not turn solid brown.
Tobler's rule: matching data resolution to map scale
Raster datasets (satellite images, aerial photos, digital elevation models) do not have a map scale; they have a spatial resolution or pixel size, such as 30 m or 50 cm. In 1987, the geographer Waldo Tobler published a simple rule connecting the two:
- Smallest detectable feature (in metres) = scale denominator / 1,000
- Required data resolution (in metres) = scale denominator / 2,000
On the page, that means the smallest object you can see is about 1 mm long, and the data needs one value every 0.5 mm. By Tobler's rule, a 1:24,000 map can show objects about 24 m across and needs source data with a resolution of about 12 m. A 1:250,000 regional map needs about 125 m data; loading a 50 cm aerial orthophoto behind a 1:250,000 map only slows down your computer without adding visible detail.
Why web maps don't have a single scale
Paper maps have a fixed size. Web maps (Google Maps, OpenStreetMap, Mapbox, and web basemaps in GIS) do not have a constant ratio scale, for two separate reasons.
First, every screen has a different pixel size. A 256-pixel web map tile is about 6.8 cm wide on a 96 dpi desktop monitor and smaller on most phones. Without knowing the physical size of your pixels, the browser cannot know how many centimetres a feature takes up on the glass.
Second, Web Mercator stretches the map toward the poles. Almost all web maps use the Web Mercator projection (EPSG:3857), which cuts the world into a square grid of 256 x 256 pixel tiles at each zoom level. Because map projections cannot flatten a sphere without distortion, Web Mercator stretches lengths by 1 / cos(latitude) as you move away from the equator, and areas by the square of that. You can drag countries north and south on our true size map to see that inflation happen live.
At zoom level z, the ground size of one pixel (for a 256-pixel tile) is:
metres per pixel = 156,543.03 x cos(latitude) / 2^z
To turn that pixel size into a 1:xxxx ratio for software that expects one, the OGC WMTS standard assumes a "standardized rendering pixel" of 0.28 mm on the screen (about 90.7 dpi). Dividing the metres per pixel by 0.00028 gives the nominal scale at each zoom level:
| Zoom level | m / pixel (equator) | m / pixel (45° latitude) | Nominal scale (equator) | Nominal scale (45° latitude) |
|---|---|---|---|---|
| 0 | 156,543 | 110,693 | 1:559,082,264 | 1:395,330,860 |
| 5 | 4,892 | 3,459 | 1:17,471,321 | 1:12,354,089 |
| 10 | 152.9 | 108.1 | 1:545,979 | 1:386,065 |
| 12 | 38.2 | 27.0 | 1:136,495 | 1:96,516 |
| 14 | 9.55 | 6.76 | 1:34,124 | 1:24,129 |
| 15 | 4.78 | 3.38 | 1:17,062 | 1:12,065 |
| 16 | 2.39 | 1.69 | 1:8,531 | 1:6,032 |
| 17 | 1.19 | 0.84 | 1:4,265 | 1:3,016 |
| 18 | 0.60 | 0.42 | 1:2,133 | 1:1,508 |
| 20 | 0.15 | 0.11 | 1:533 | 1:377 |
Each zoom level in halves the metres per pixel, doubles the scale and shows a quarter of the ground. And at the same zoom level, a pixel at 45° latitude (Milan, Montreal, Minneapolis) covers 0.707 times the ground it covers at the equator (cos 45°), while at 60° (Oslo, Anchorage) it covers half. That is why the dynamic bar scale in the corner of Google Maps or OpenStreetMap stretches and shrinks as you pan north or south without touching the zoom button.
How to set map scale and add a scale bar in QGIS
In QGIS, you work with scale in three places: the map canvas while you explore, the layer styling panel to hide clutter when zoomed out, and the print layout when you export a finished PDF or image.
 , you work with scale in three places: the map canvas while you explore, the layer styling panel to hide clutter when zoomed out, and the print layout when you export a finished PDF or image.
First, make sure your project is in a projected coordinate reference system in metres or feet (such as your local UTM zone) rather than degrees (EPSG:4326), so the scale bar measures in metres and not in degrees. If you need background context, our guide on how to add a basemap in QGIS covers the standard tile layers.
Set the canvas scale and add a live scale bar
Look at the status bar at the bottom right of the main QGIS window. Click the Scale box (for example
1:50000) to pick a preset scale or type any ratio you want. To show a graphic bar on your working canvas, go to View > Decorations > Scale Bar, tick Enable Scale Bar, and click OK.Hide detailed layers at small scales
To stop a dense layer (such as building footprints or parcel labels) from turning into a solid block when you zoom out, right-click the layer and open Properties > Rendering. Tick Scale dependent visibility. Set the Minimum (exclusive) scale to a smaller scale such as
1:25,000; QGIS will now hide the layer whenever you zoom out past1:25,000and draw it again as soon as you zoom in closer.Lock the exact scale and bar in a Print Layout
A canvas screenshot only has an approximate ratio because screen pixel densities vary. For a real
1:10,000or1:25,000map, open Project > New Print Layout, add your map with Add Item > Add Map, and type25000under Item Properties > Main Properties > Scale. Then pick Add Item > Add Scale Bar and draw it on the page: QGIS links the bar to the map item and updates the ticks automatically whenever you change the map's scale.
Build a scaled print layout from one prompt
We build AI Agent, a plugin that runs inside QGIS. If you do not want to set up the paper size, map frame, scale denominator, scale bar, and legend by hand, you can ask the agent to build the print layout in your open project from a single sentence, for example: "Create an A4 landscape print layout at 1:25,000 over the active layer with a metric scale bar and a legend."
Questions people ask
Map scale is the ratio between a distance measured on a map and the real distance on the ground. For example, a map scale of 1:25,000 means 1 unit on the map equals 25,000 of the same units on Earth, so 1 cm on the map represents 250 m on the ground. Cartographers show it as a ratio (1:25,000), a verbal statement ("1 cm to 250 m"), or a drawn bar scale.
The three types of map scale are the ratio scale (or representative fraction, such as 1:50,000), the verbal scale (a written statement such as "1 inch equals 2,000 feet"), and the graphic or bar scale (a ruler drawn on the map). Ratio scales work in any unit, verbal scales are quick to read without math, and bar scales are the only type that stays accurate when a map is enlarged or reduced.
A large-scale map (such as 1:1,000 or 1:10,000) has a large fraction, covers a small geographic area, and shows detailed features like individual buildings and streets. A small-scale map (such as 1:1,000,000 or 1:10,000,000) has a small fraction, covers a state, country, or continent, and drops small details so the map stays readable. The terms refer to the size of the fraction 1/denominator, not the size of the area covered.
A scale of 1:50,000 means that 1 unit of length on the map equals 50,000 of the same units on the ground. In metric units, 1 cm on the map equals 50,000 cm, which is 500 m (half a kilometre), and 2 cm equals 1 km. An A4 sheet at 1:50,000 covers a ground area of 10.5 by 14.9 km.
Multiply the distance you measured on the map by the scale denominator, then convert to larger units. If two points are 4.5 cm apart on a 1:25,000 map, multiply 4.5 x 25,000 to get 112,500 cm, then divide by 100 to get 1,125 m (1.125 km). To go the other way and draw a real distance on a map, divide the ground distance by the scale denominator.
A bar scale is drawn directly on the map image, so it shrinks or stretches at the exact same rate as the map whenever the map is photocopied, embedded in a document, or zoomed on a computer or phone screen. A ratio like 1:24,000 is only true when the map is printed at 100% of its original design size; resizing the page makes the printed ratio false while the bar scale remains accurate.
Do it in QGIS by asking for it
AI Agent carries out the task you describe, in your own QGIS project. Free, no card.