NDVI vs EVI, SAVI, NDRE and NDWI: Which Index When
Published
NDVI and EVI both measure green vegetation from red and near-infrared light, but NDVI flattens out over dense canopy, and EVI adds the blue band and three coefficients so it keeps responding. SAVI corrects for bare soil, NDRE swaps red for the red edge, and NDWI and NDMI measure water instead of plants. If NDVI itself is new to you, start with what NDVI is.
The difference in one line
NDVI tells you whether a pixel is green. EVI, SAVI and NDRE tell green things apart, and NDWI and NDMI tell you about water. All eight indices below run in the QGIS Raster Calculator on Sentinel-2 surface reflectance, with the band names as layer names.
 Raster Calculator on Sentinel-2 surface reflectance, with the band names as layer names.
| Index | Formula | Sentinel-2, Raster Calculator on reflectance | Measures | Use it when | Weak spot |
|---|---|---|---|---|---|
| NDVI | (NIR − Red) / (NIR + Red) | ("B08@1" - "B04@1") / ("B08@1" + "B04@1") | Greenness | General vegetation maps, long time series | Saturates over dense canopy |
| EVI | 2.5 × (NIR − Red) / (NIR + 6 × Red − 7.5 × Blue + 1) | 2.5 * ("B08@1" - "B04@1") / ("B08@1" + 6 * "B04@1" - 7.5 * "B02@1" + 1) | Canopy, driven by NIR | Dense forest, MODIS continuity | Breaks on raw values, noisy blue band |
| EVI2 | 2.5 × (NIR − Red) / (NIR + 2.4 × Red + 1) | 2.5 * ("B08@1" - "B04@1") / ("B08@1" + 2.4 * "B04@1" + 1) | Same as EVI | No blue band on the sensor | Same as EVI |
| SAVI | 1.5 × (NIR − Red) / (NIR + Red + 0.5) | 1.5 * ("B08@1" - "B04@1") / ("B08@1" + "B04@1" + 0.5) | Greenness, soil damped | Young crops, drylands | L = 0.5 is a compromise |
| NDRE | (NIR − Red edge) / (NIR + Red edge) | ("B8A@1" - "B05@1") / ("B8A@1" + "B05@1") | Chlorophyll, nitrogen | Mid to late season crops | 20 m on Sentinel-2 |
| GNDVI | (NIR − Green) / (NIR + Green) | ("B08@1" - "B03@1") / ("B08@1" + "B03@1") | Chlorophyll | No red edge available | Saturates like NDVI |
| NDWI (McFeeters) | (Green − NIR) / (Green + NIR) | ("B03@1" - "B08@1") / ("B03@1" + "B08@1") | Open water | Lakes, rivers, floods | Misses water under plants |
| NDMI (Gao NDWI) | (NIR − SWIR) / (NIR + SWIR) | ("B8A@1" - "B11@1") / ("B8A@1" + "B11@1") | Water in leaves and soil | Drought, fire fuel | Open water reads near zero |
EVI uses the MODIS coefficients of Huete et al. (2002), the same ones the USGS applies to Landsat, and SAVI the L = 0.5 of the USGS SAVI page. For NDRE I pair B8A with B5: both are 20 m bands on the Sentinel-2 grid, so the calculator doesn't mix resolutions, and B8A is a narrow band around 865 nm, where B8 is about 100 nm wide. Here's the same scene through four of them:
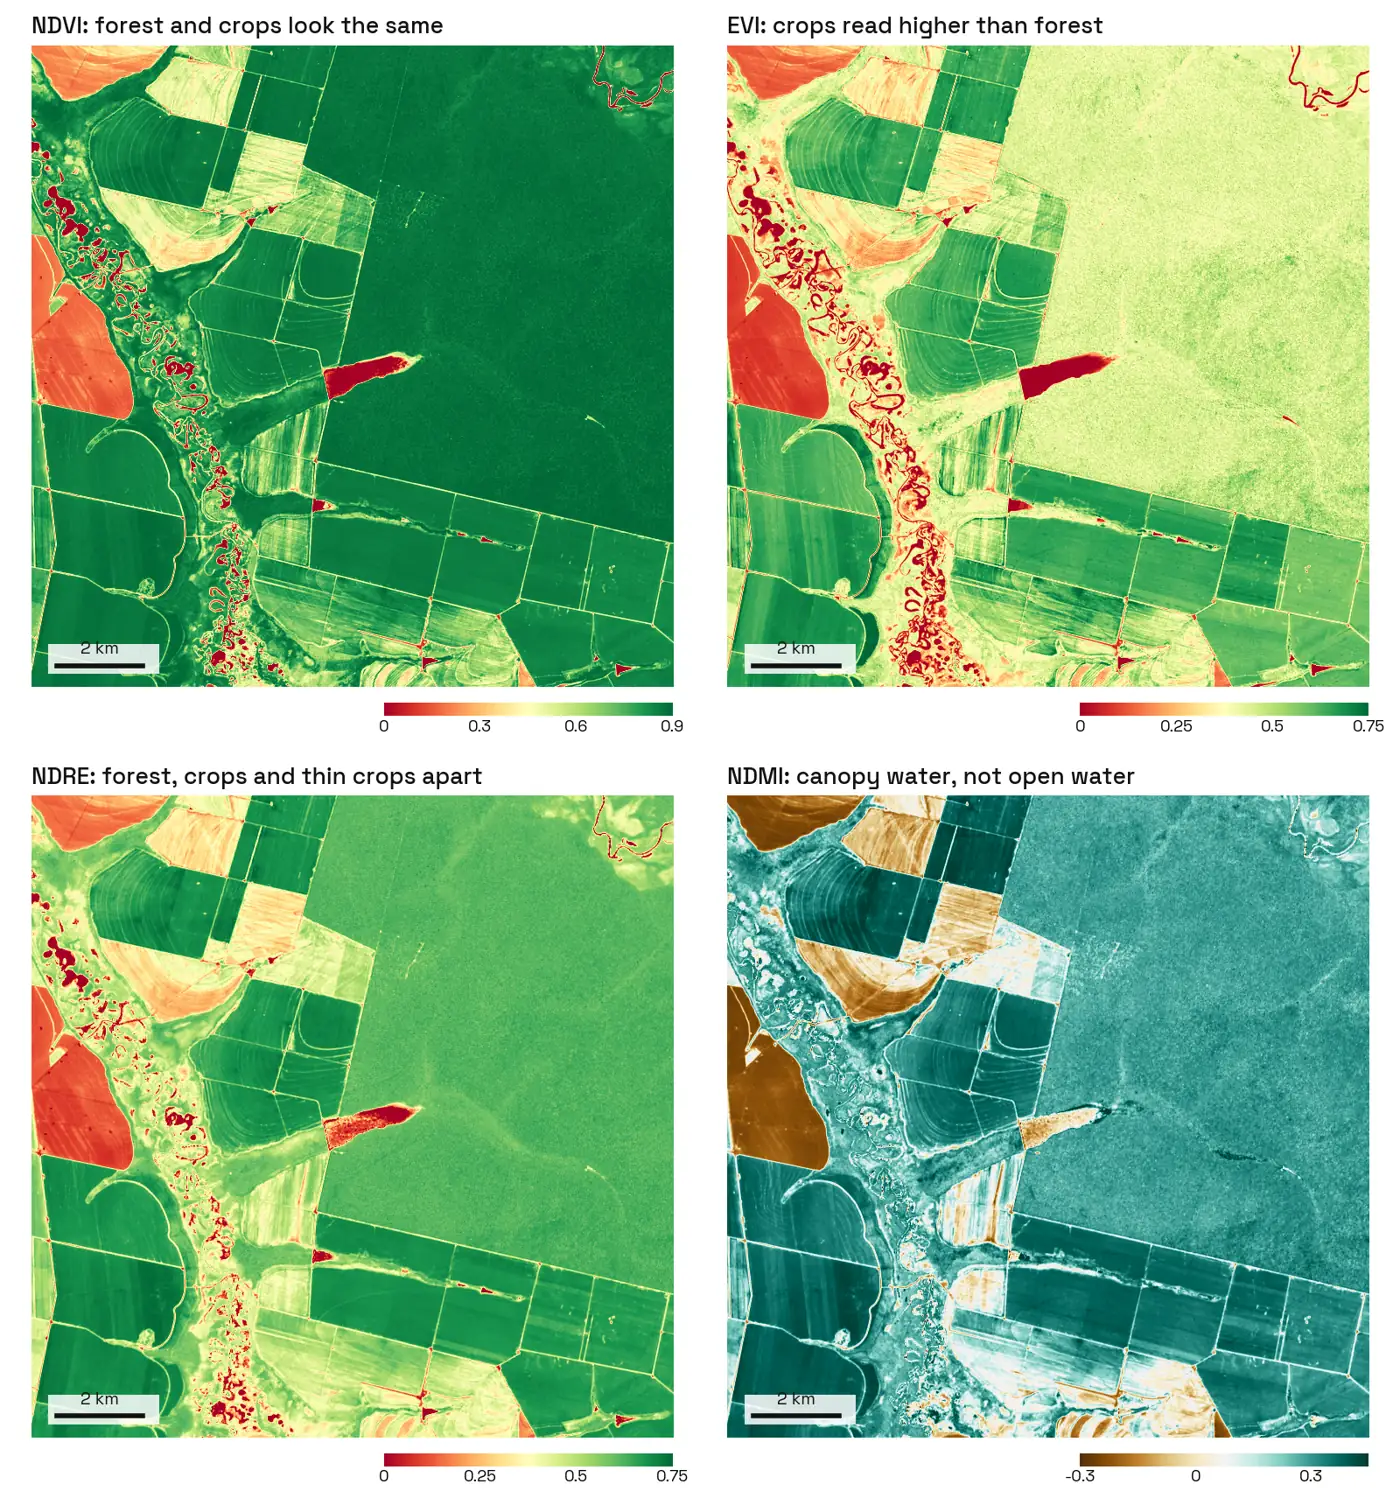
NDVI saturation, measured on a scene in Mato Grosso
On a cloud-free Sentinel-2 scene of 7 May 2026 near Querência, Mato Grosso, NDVI gave dense Amazon forest a median of 0.88 and crops at their peak 0.87, and 54% of forest pixels fell inside the crop band. EVI pulled the two apart, 0.44 against 0.66 with no overlap, but put the forest in the same range as pale, thin crops. NDRE was the only index that kept all three apart.
Values are the median, with the 10th to 90th percentile in brackets, over 1,000 random pixels per class:
| Class | NDVI | EVI | NDRE | NDMI |
|---|---|---|---|---|
| Dense forest | 0.88 (0.86 to 0.90) | 0.44 (0.39 to 0.51) | 0.62 (0.59 to 0.64) | 0.29 (0.26 to 0.32) |
| Crop at peak | 0.87 (0.84 to 0.88) | 0.66 (0.60 to 0.70) | 0.69 (0.65 to 0.71) | 0.37 (0.31 to 0.41) |
| Pale, thin crop | 0.64 (0.47 to 0.77) | 0.43 (0.30 to 0.58) | 0.41 (0.30 to 0.50) | 0.03 (−0.10 to 0.17) |
| Bare soil | 0.23 (0.16 to 0.39) | 0.14 (0.09 to 0.24) | 0.15 (0.10 to 0.25) | −0.22 (−0.25 to −0.15) |
| Open water | −0.08 (−0.29 to 0.19) | 0.00 (−0.03 to 0.01) | 0.02 (−0.21 to 0.23) | 0.05 (−0.11 to 0.20) |
NDVI packs 80% of the forest into a band 0.04 wide. EVI didn't rank the forest above the crops, as the textbook line "EVI doesn't saturate" suggests, but below them. The forest canopy reflects 23% of near-infrared light against 39% for a crop at peak, because a rough canopy is full of shadow, and EVI follows near-infrared. My take: read EVI as a canopy signal, not a biomass meter. SAVI and EVI2 behaved like EVI on every class.
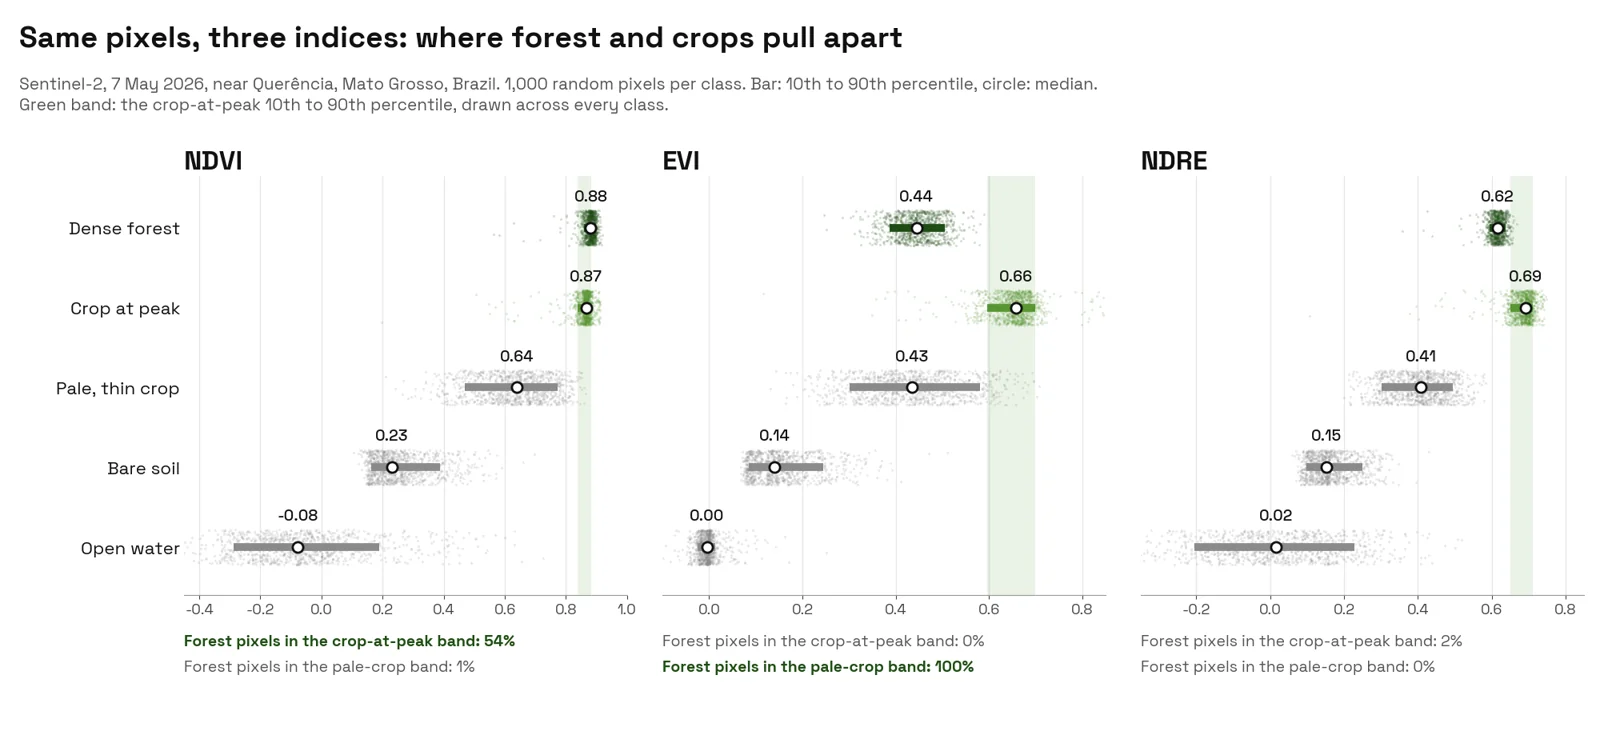
NDMI tells another story: open water read 0.05, the same as a pale, drying crop at 0.03. That's why NDMI is a moisture index and NDWI (McFeeters) is the water mapper.
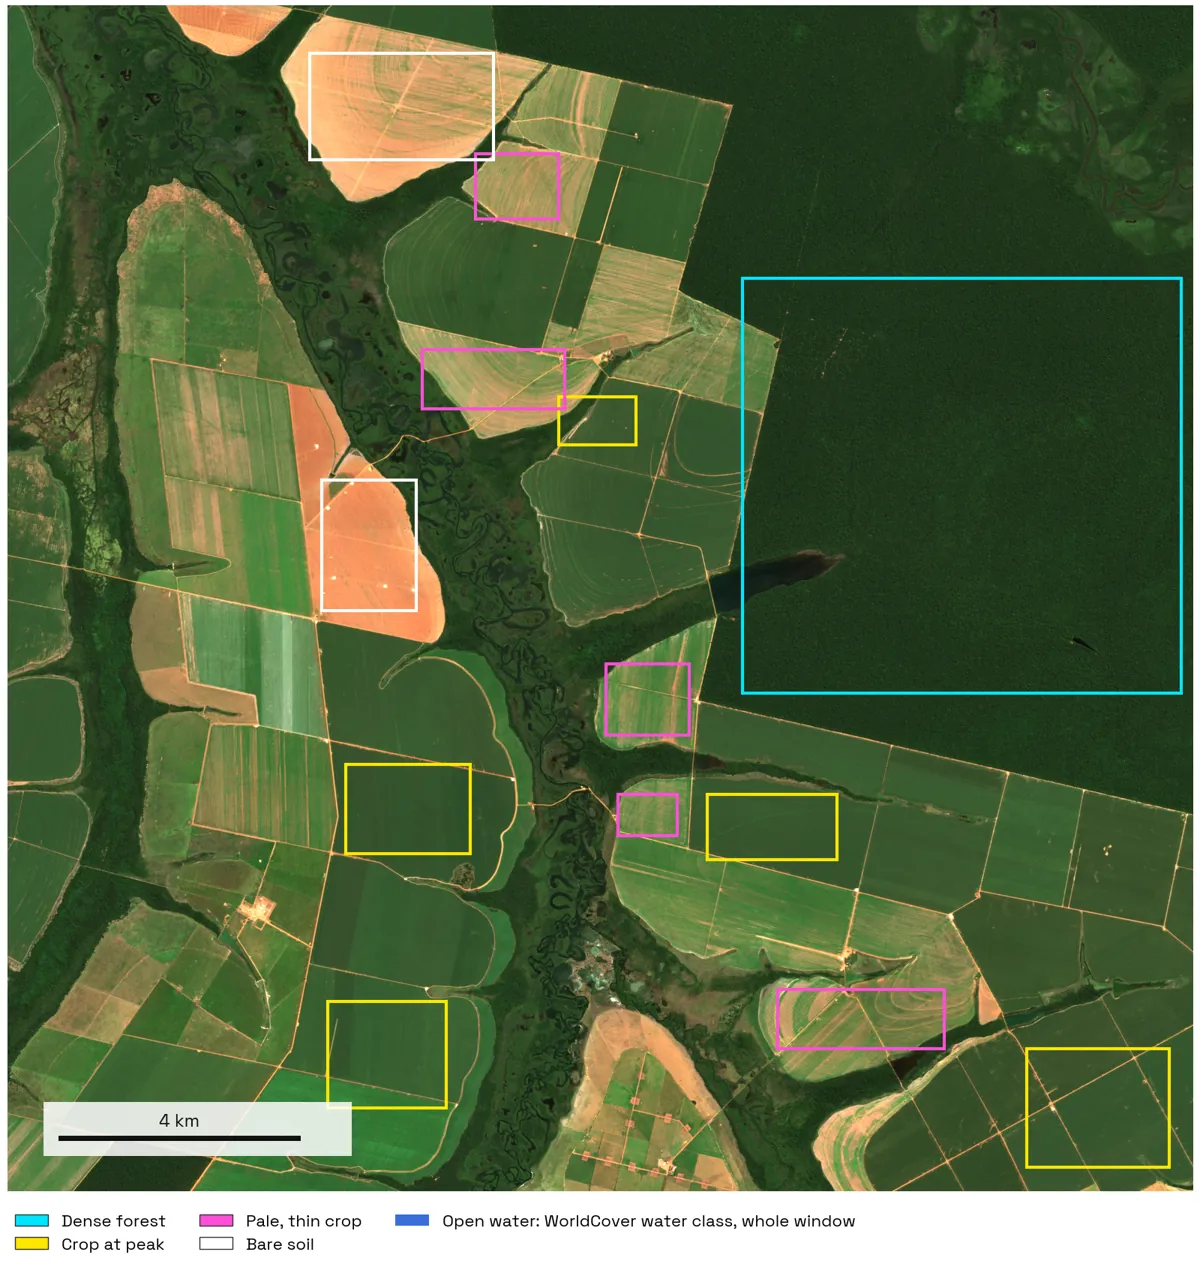
How I measured this. I took Sentinel-2 L2A scene S2C_MSIL2A_20260507T135111_R024_T22LCM (0% cloud) from Microsoft Planetary Computer, a 20 by 20 km window about 55 km north of the town of Querência. Before computing any index, I drew rectangles on the true colour image over dark green fields, pale fields, bare fields and a forest block, and kept only pixels that ESA WorldCover 2021 labels cropland or tree cover and that the scene classification marks clear. Water is every WorldCover water pixel in the window. Reflectance is (DN − 1000) / 10000. Limits: one date and one place, crop stages read from colour rather than from the field, and the water class includes river wetland with floating plants, which explains its wide NDVI spread.
Which index for which job in QGIS
Pick the index from the question, not from habit:
- A vegetation map, a change map, a comparison with older years. NDVI. Almost every multispectral sensor can compute it, and the Landsat archive goes back to 1982.
- Dense forest, or continuity with MODIS products. EVI, or EVI2 when the sensor has no blue band. Don't use it alone to split forest from crops.
- Young crops, orchards, drylands, lots of visible soil. SAVI.
- Nitrogen, late-season vigour, telling dense covers apart. NDRE, with B8A and B5 on Sentinel-2.
- Mapping lakes, rivers and floods. NDWI (McFeeters), green and NIR.
- Drought, crop water stress, fire fuel. NDMI, the index Gao (1996) first called NDWI. The USGS NDMI page uses NIR and SWIR 1.
If you'd rather type the request than the formula, AI Agent, the QGIS plugin we build, runs these Raster Calculator steps from one sentence. To get the bands first, see how to download Sentinel-2 in QGIS.
Questions people ask
NDVI or NDRE for nitrogen?
NDRE. Nitrogen status shows in chlorophyll, which moves the red edge, and NDRE keeps responding once the canopy closes and NDVI has flattened. Early in the season, when soil still shows, NDVI is fine. On this scene, NDRE separated crops at peak from forest (2% overlap) where NDVI could not (54%).
Is NDWI the same as NDMI?
Two different indices share the name NDWI. McFeeters (1996) uses green and NIR and maps open water. Gao (1996) uses NIR and shortwave infrared and measures water in leaves, and most tools now call that one NDMI. Check the bands before you trust a layer called NDWI.
Is EVI better than NDVI?
Over dense canopy, it saturates less. In my Mato Grosso test it separated forest from crops at peak, but it confused forest with pale, thin crops, which NDVI kept apart. EVI also needs a clean blue band and true reflectance. Use it next to NDVI, not instead of it.
Which index works with a drone camera?
An ordinary RGB camera records no near-infrared light, so none of these work. A multispectral camera with red, NIR and red edge bands gives NDVI, SAVI, GNDVI and NDRE. EVI needs a blue band too, and NDMI needs shortwave infrared, which drone cameras rarely carry.
Which Landsat bands replace the Sentinel-2 ones?
On Landsat 8 and 9: blue is band 2, green band 3, red band 4, NIR band 5 and SWIR 1 band 6, all at 30 m. Landsat has no red edge band, so no NDRE. Collection 2 Level-2 reflectance is DN × 0.0000275 − 0.2.
For the bands behind these formulas, see multispectral vs hyperspectral. The QGIS AI hub lists what AI can do inside QGIS, task by task.