What Is NDVI? Meaning, Values and Formula
Published
NDVI, the Normalized Difference Vegetation Index, is a number from −1 to +1 that measures how much healthy green vegetation a pixel of a satellite image contains. It compares two kinds of light a surface sends back: near-infrared, invisible to our eyes, and red. NDVI = (NIR − Red) / (NIR + Red). Dense crops and forest score about 0.6 to 0.9, bare soil around 0.1, and water below zero.
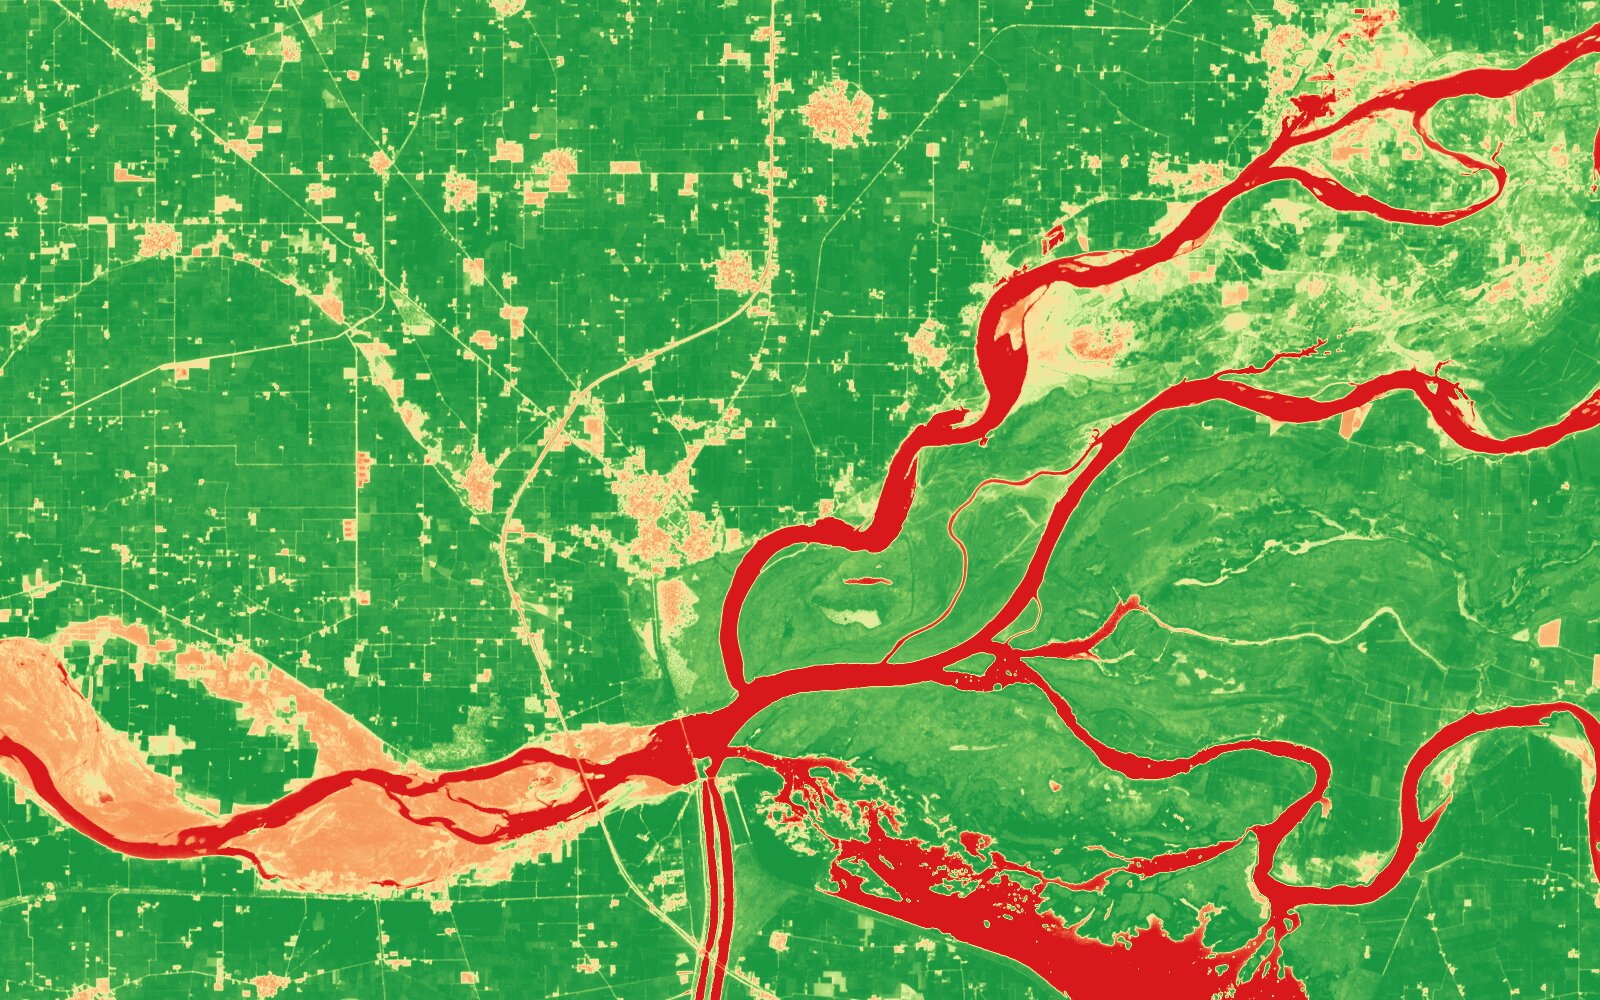
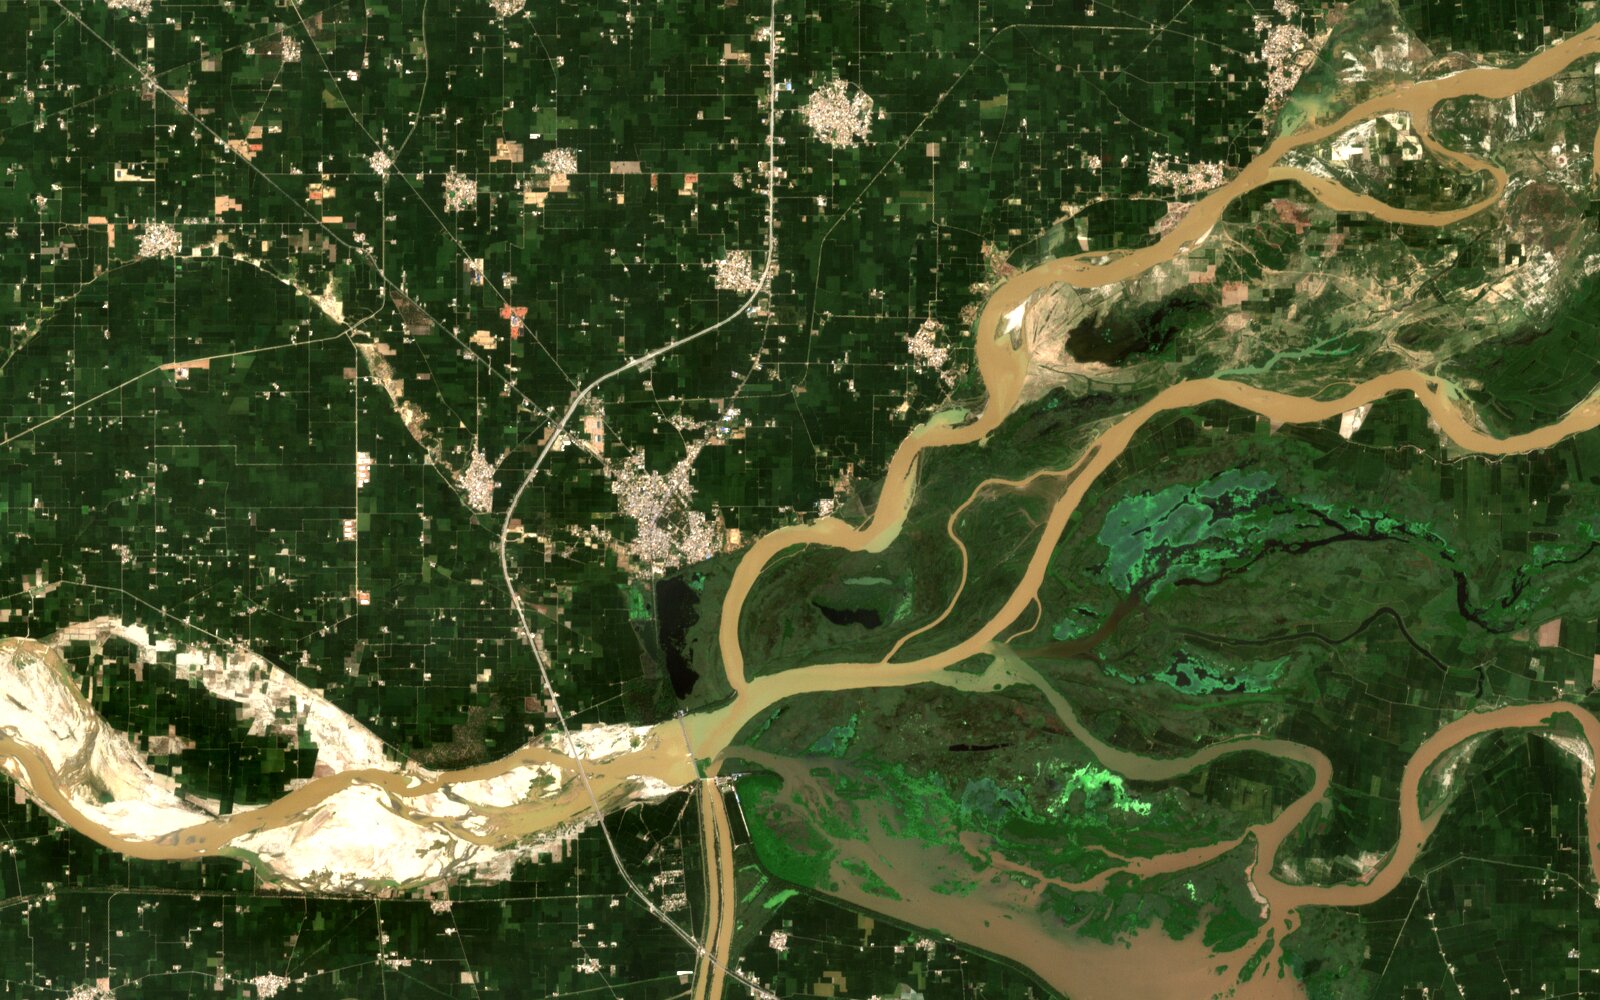
It's the most used vegetation index because almost every satellite, and many drone cameras, record those two kinds of light, and one number per pixel is easy to map and compare over time. Farmers use it to spot weak patches in a field, foresters to follow a drought, and planners to measure how green a city is. You can compute it for free in QGIS in a few minutes, steps below, or ask AI Agent, the QGIS plugin we build, to do it from one sentence.
 in a few minutes, steps below, or ask
 How NDVI works
Plants use red light and reject near-infrared light. A healthy leaf absorbs most of the red light to grow, and bounces most of the near-infrared back. NASA Earthdata explains that when a plant suffers from drought or disease, it reflects more red and less near-infrared, so the gap between the two narrows.
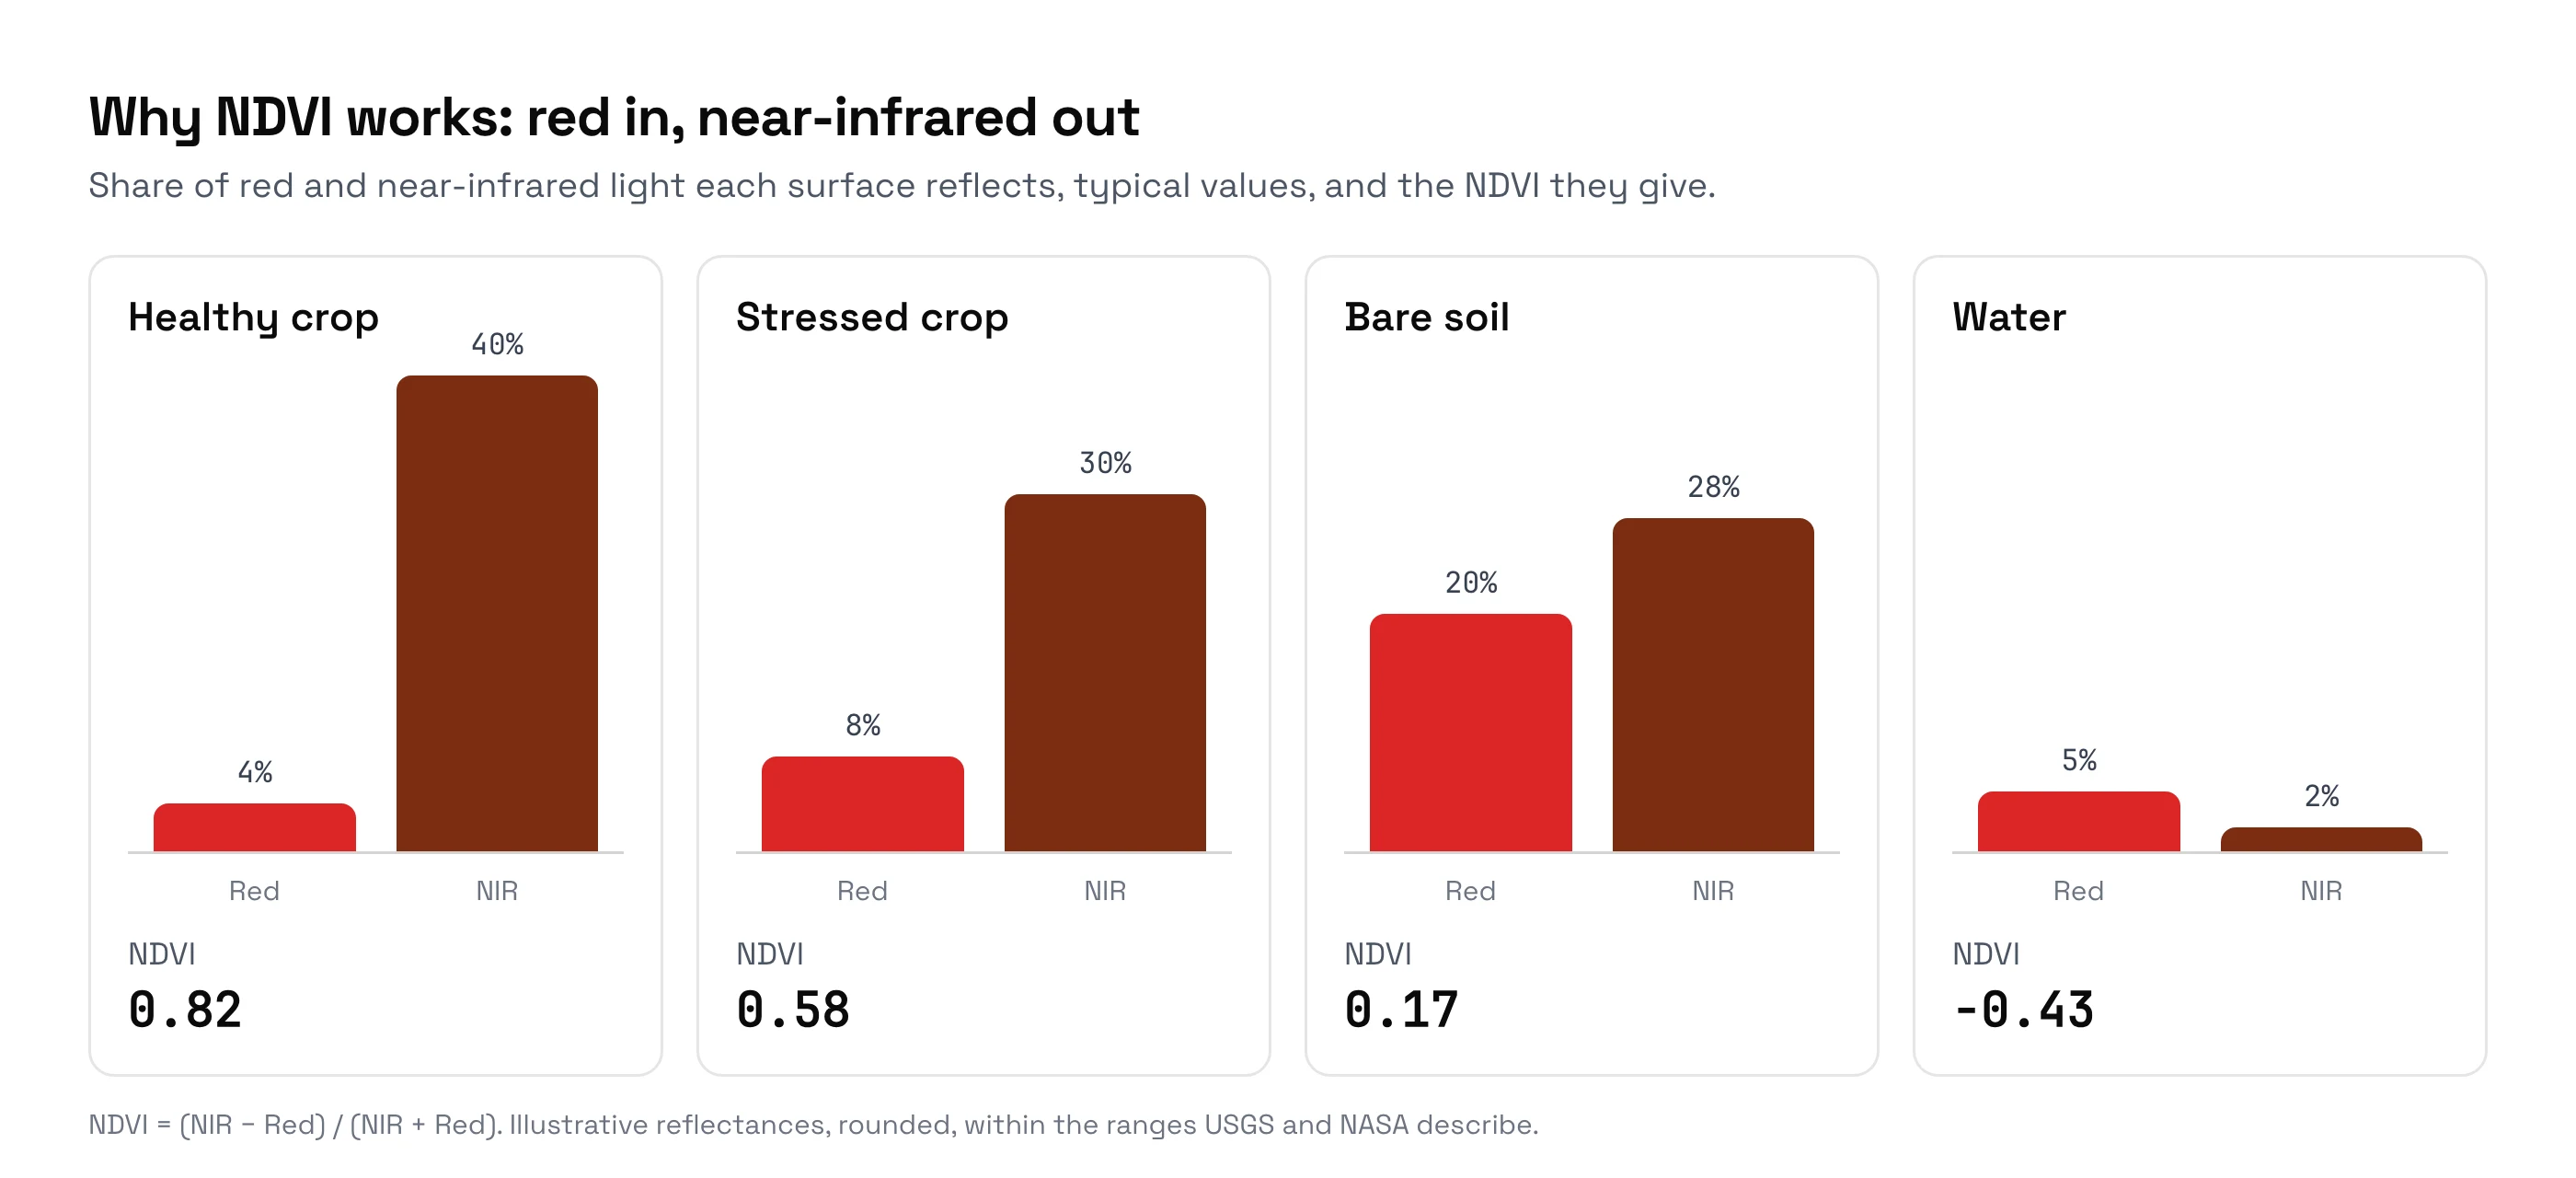
NDVI turns that gap into one number:
NDVI = (NIR − Red) / (NIR + Red)
Take a healthy wheat field that reflects 40% of near-infrared and 4% of red light: (0.40 − 0.04) / (0.40 + 0.04) = 0.82. Bare soil might reflect 28% and 20%: (0.28 − 0.20) / (0.28 + 0.20) = 0.17. Dividing by the sum makes the index "normalized": a field in shadow and the same field in full sun give similar values.
Researchers first used it on satellite images in 1974, to watch crops on the US Great Plains from the first Landsat satellite.
What NDVI values mean
The US Geological Survey gives the ranges most sources repeat. Treat them as a rule of thumb:
| NDVI | What it usually is |
|---|---|
| Below 0 | Water, clouds, snow |
| 0 to 0.1 | Bare rock, sand, bare soil, built-up areas |
| 0.2 to 0.5 | Sparse vegetation: grassland, shrubs, young or ripening crops |
| 0.6 to 0.9 | Dense vegetation: forest, crops at peak growth |
In the USGS wording, barren areas show "0.1 or less", sparse vegetation "approximately 0.2 to 0.5", and dense vegetation "approximately 0.6 to 0.9". The same field moves through all three in a year, as the next section shows.
NDVI through a season, measured
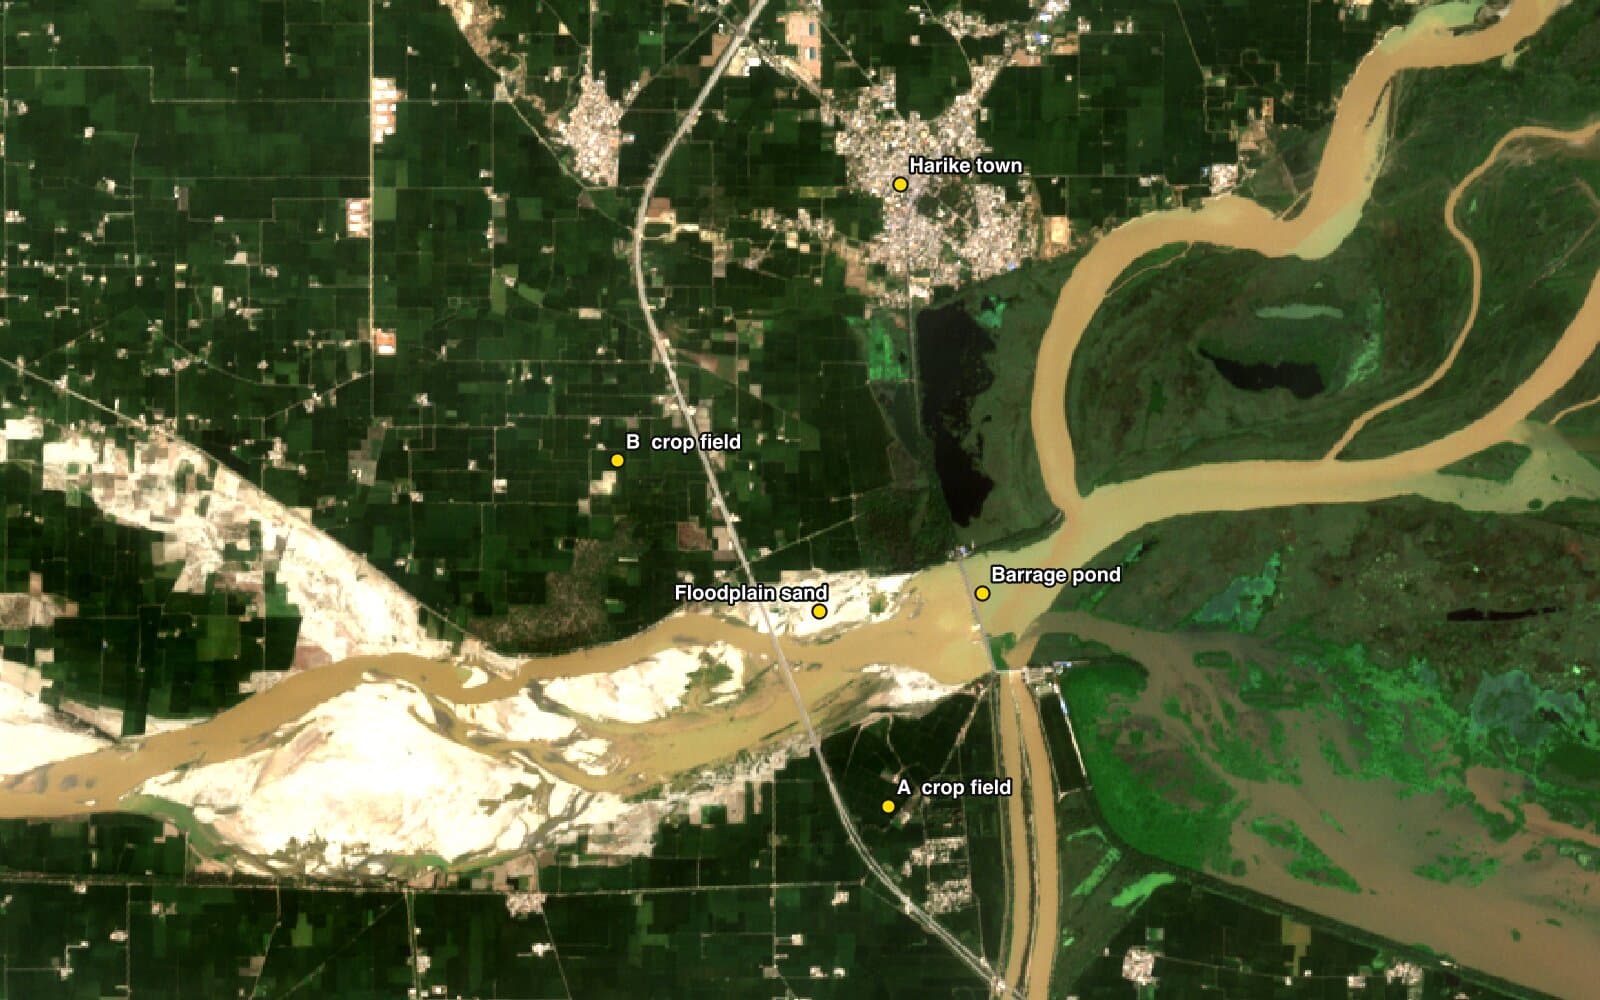
An NDVI value only means something with its date. To show it, I followed one crop field in Punjab, India, through a whole year of Sentinel-2 satellite images. The same field read 0.06 in early June and 0.92 in early September: from bare soil to dense crop, on the same patch of ground.
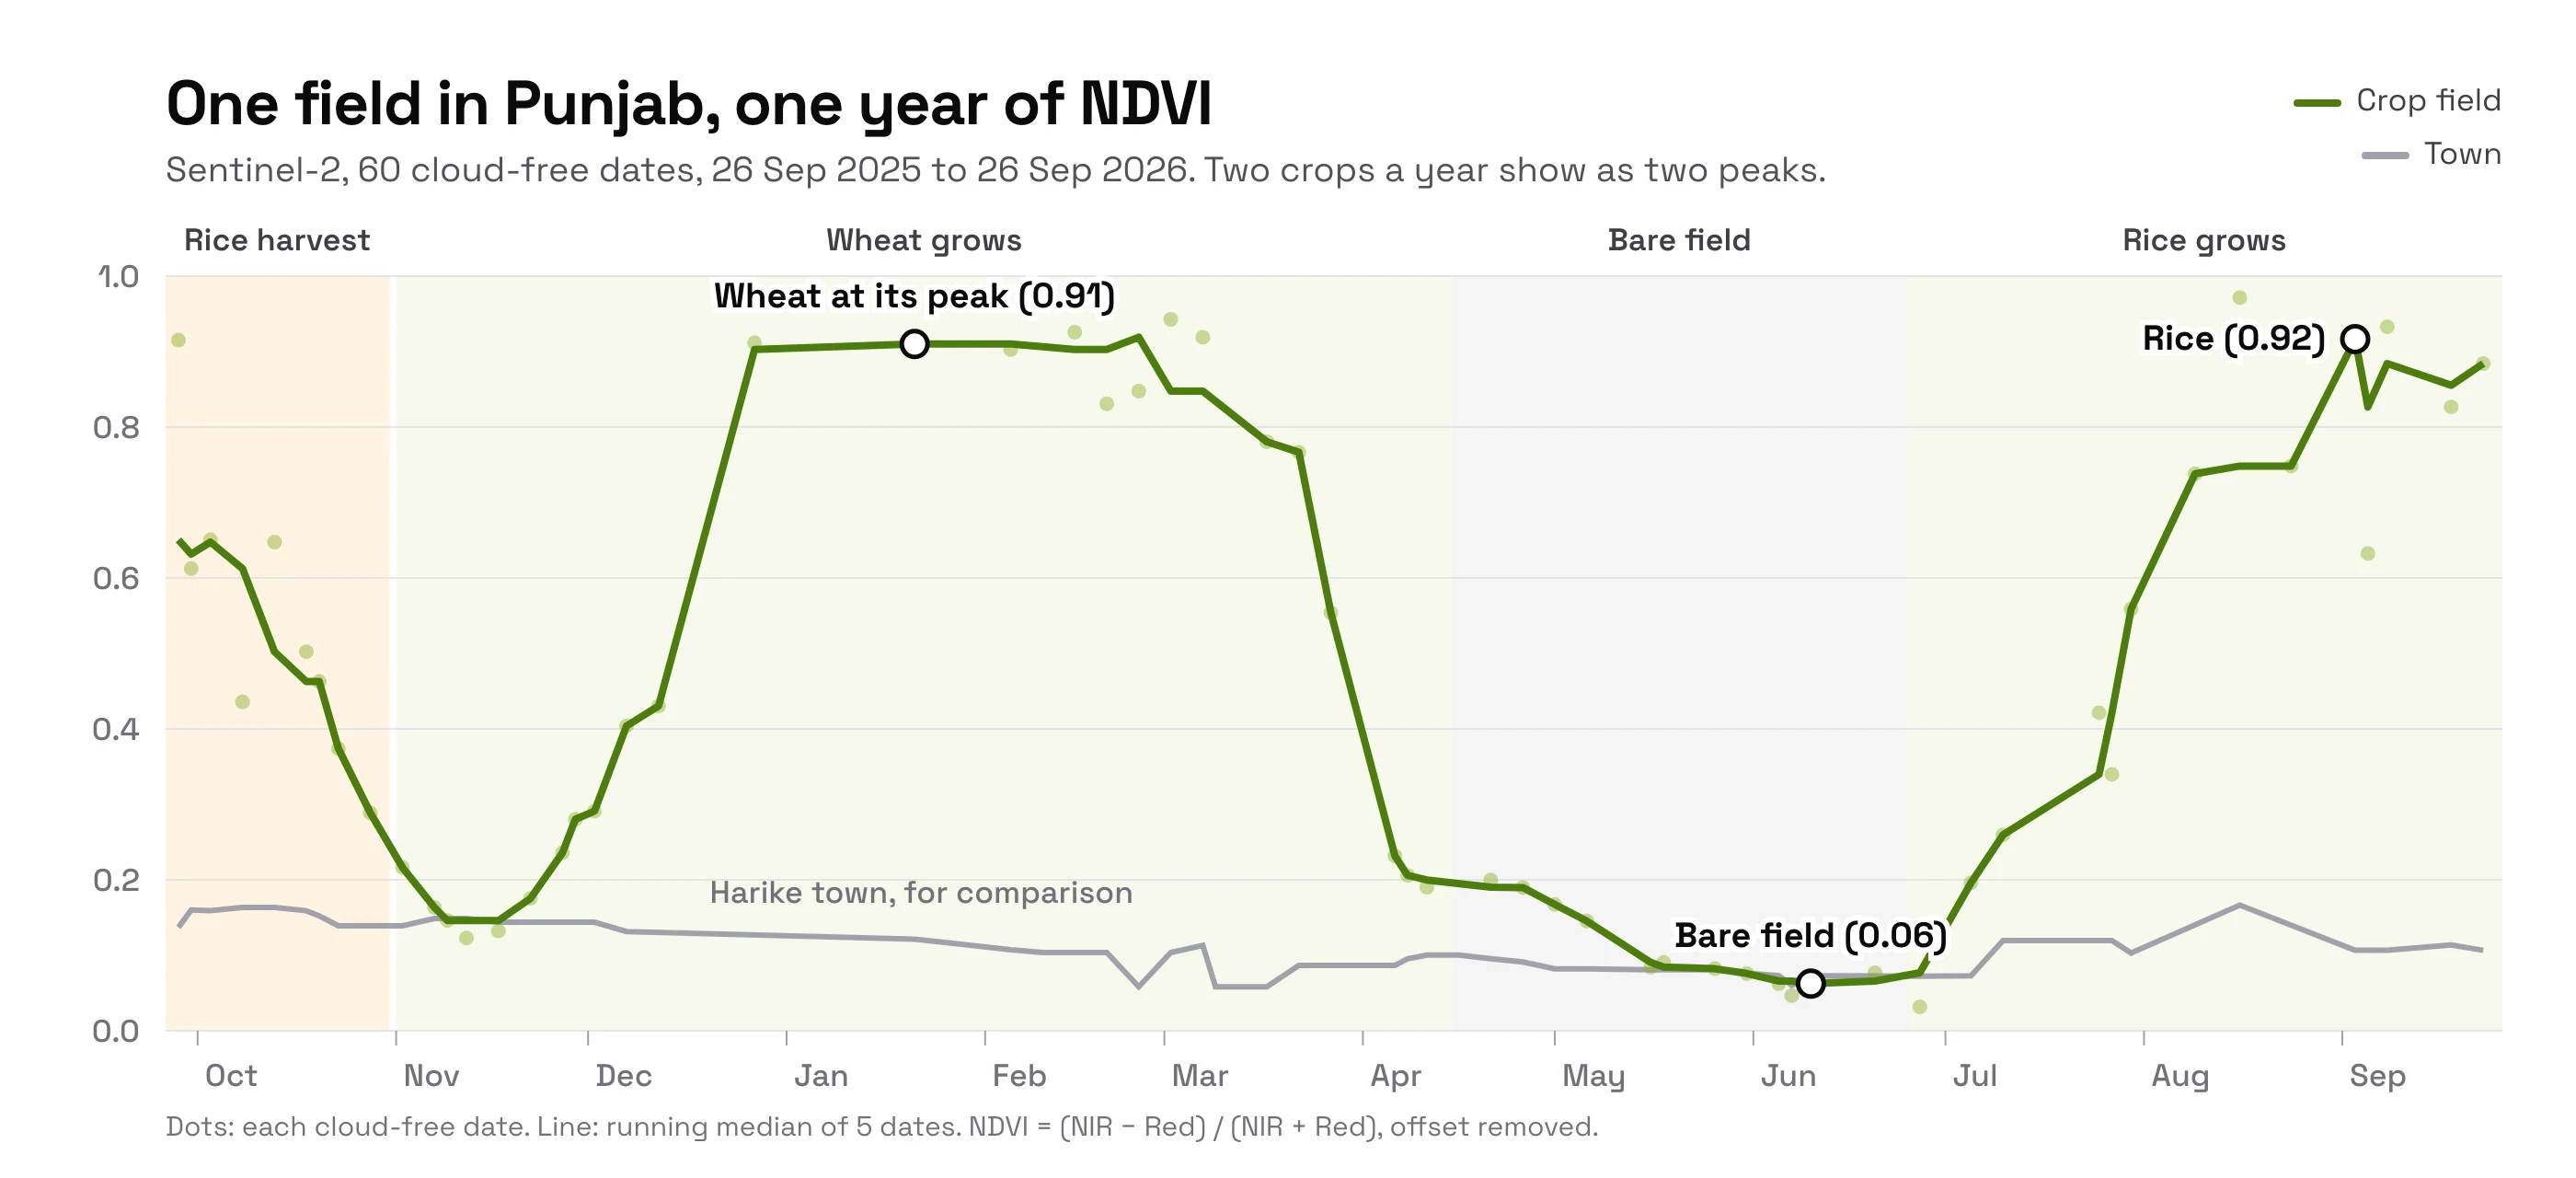
The curve follows the farming calendar: wheat grows in winter and peaks around February, the field is bare after the April harvest, and rice is planted in late June and peaks in August and September. The town nearby stays between 0.05 and 0.17 all year. So "0.2" can mean a young crop, a harvested field or a village, depending on the month.
How we measured this. I used all 87 Sentinel-2 images of the area from 26 September 2025 to 26 September 2026, and picked my sample spots before reading any value. Each spot is the average of 3 × 3 pixels of 10 m, and a date counts only when there is no cloud or shadow over it: 60 dates for this field.
Which bands to use, satellite by satellite
The formula never changes, but each satellite numbers its bands (its recorded colours of light) differently. Mixing them up is the most common first mistake.
| Source | Red band | Near-infrared band | Pixel size | Revisit |
|---|---|---|---|---|
| Sentinel-2 (ESA) | B4, 665 nm | B8, 842 nm | 10 m | 5 days or less |
| Landsat 8 and 9 (USGS) | Band 4 | Band 5 | 30 m | 8 days combined |
| Landsat 4 to 7 | Band 3 | Band 4 | 30 m | Archive back to 1982 |
| MODIS (NASA) | Ready-made NDVI product, MOD13Q1 | 250 m | 16-day composite | |
| Multispectral drone camera | Red band | NIR band | A few cm | Whenever you fly |
Sentinel-2 is the default for fields and farms: free, 10 m pixels, a new image every few days. Use Landsat to go back before 2015, and MODIS for a whole country every two weeks. An ordinary drone camera can't compute NDVI, because it doesn't record near-infrared. For finding and streaming the scenes, see how to download Sentinel-2 in QGIS.
The Sentinel-2 offset that silently lowers NDVI
Since 25 January 2022, Sentinel-2 files add 1,000 to every value. ESA's data quality report says to subtract it: reflectance (the share of light sent back) = (value − 1000) / 10000. The classic tutorial formula, (B8 − B4) / (B8 + B4) on the raw values, skips that step, and the result comes out too low.
The error is largest exactly where it matters most, on healthy crops:
| Surface | Correct NDVI | NDVI if you forget the 1,000 | Error |
|---|---|---|---|
| Dense crop | 0.82 | 0.56 | −0.26 |
| Bare soil | 0.17 | 0.12 | −0.05 |
A healthy crop drops from "dense" into the "sparse" band. On our Harike image, the share of the area above 0.6 falls from 73% to 14% if you forget the offset. None of the nine QGIS NDVI tutorials we checked mentions it.
Some sources already remove it for you, so check before you subtract. Click a pixel with the Identify tool: values in the thousands are raw, values between 0 and about 1 are already reflectance.
Where NDVI falls short
NDVI measures greenness, and greenness isn't the same as health. Four limits come up in real projects:
- It tops out. Over very dense vegetation, NDVI stays around 0.85 to 0.9 and can't tell a lush field from a very lush one.
- Soil colour leaks in. Where plants are sparse, dark and bright soils give different values for the same plants.
- Clouds fake it. A thin cloud lowers NDVI, so remove cloudy pixels before you average anything.
- Satellites differ slightly. Sentinel-2 and Landsat give close but not identical values for the same field.
When those limits bite, another index answers better:
| Index | Use it when |
|---|---|
| EVI | The vegetation is very dense, such as tropical forest, where NDVI stops rising |
| SAVI | Plants are sparse and a lot of soil shows, such as young crops or drylands |
| NDRE | You follow crop nitrogen late in the season (needs a red-edge band, which Sentinel-2 has) |
| NDWI | You want to map water rather than plants |
How to calculate NDVI in QGIS
Load the red and near-infrared bands
For Sentinel-2, load bands B04 (red) and B08 (near-infrared), downloaded or streamed as shown in the Sentinel-2 guide. Click a pixel with the Identify tool: values in the thousands are raw, values from 0 to 1 are already corrected.
Open the Raster Calculator
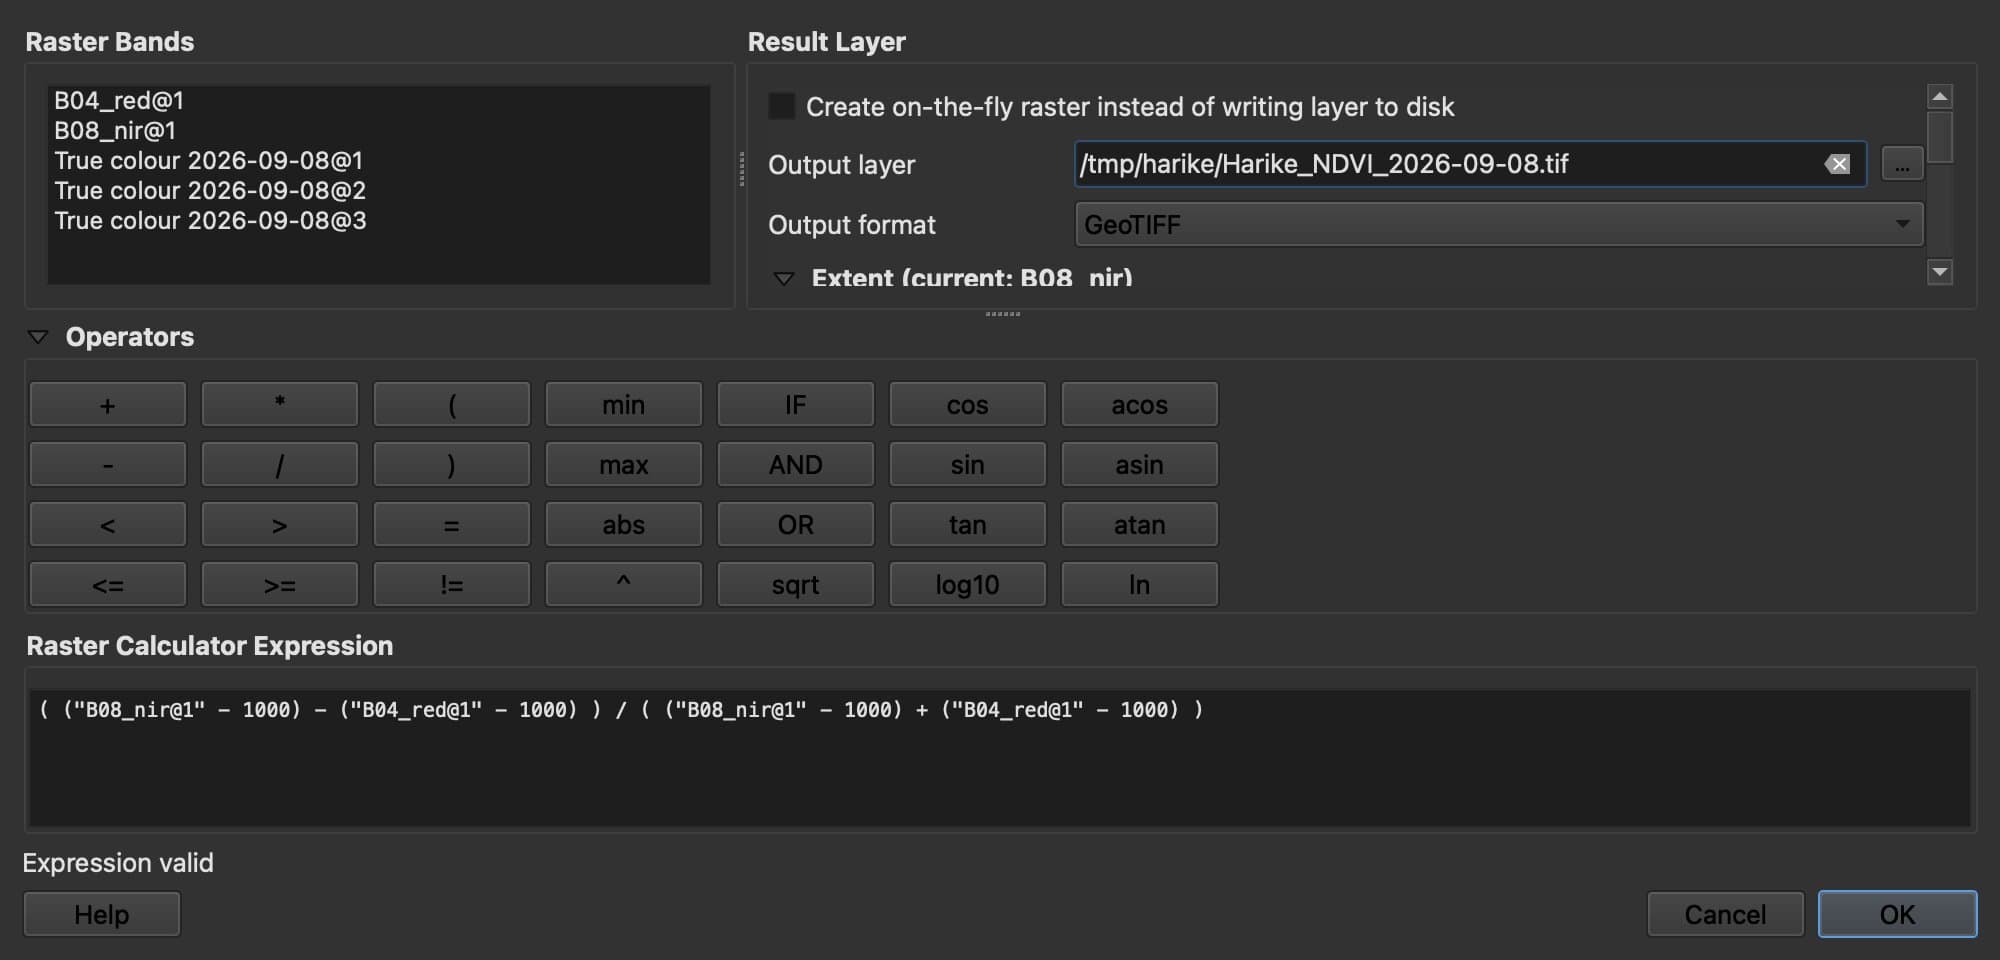
Raster > Raster Calculator…. Enter the formula with your layer names. On reflectance: ("B08@1" - "B04@1") / ("B08@1" + "B04@1"). On raw values from 2022 on, take 1,000 off each band first: (("B08@1" - 1000) - ("B04@1" - 1000)) / (("B08@1" - 1000) + ("B04@1" - 1000)). Set the extent to your area rather than the whole tile.
Style the result
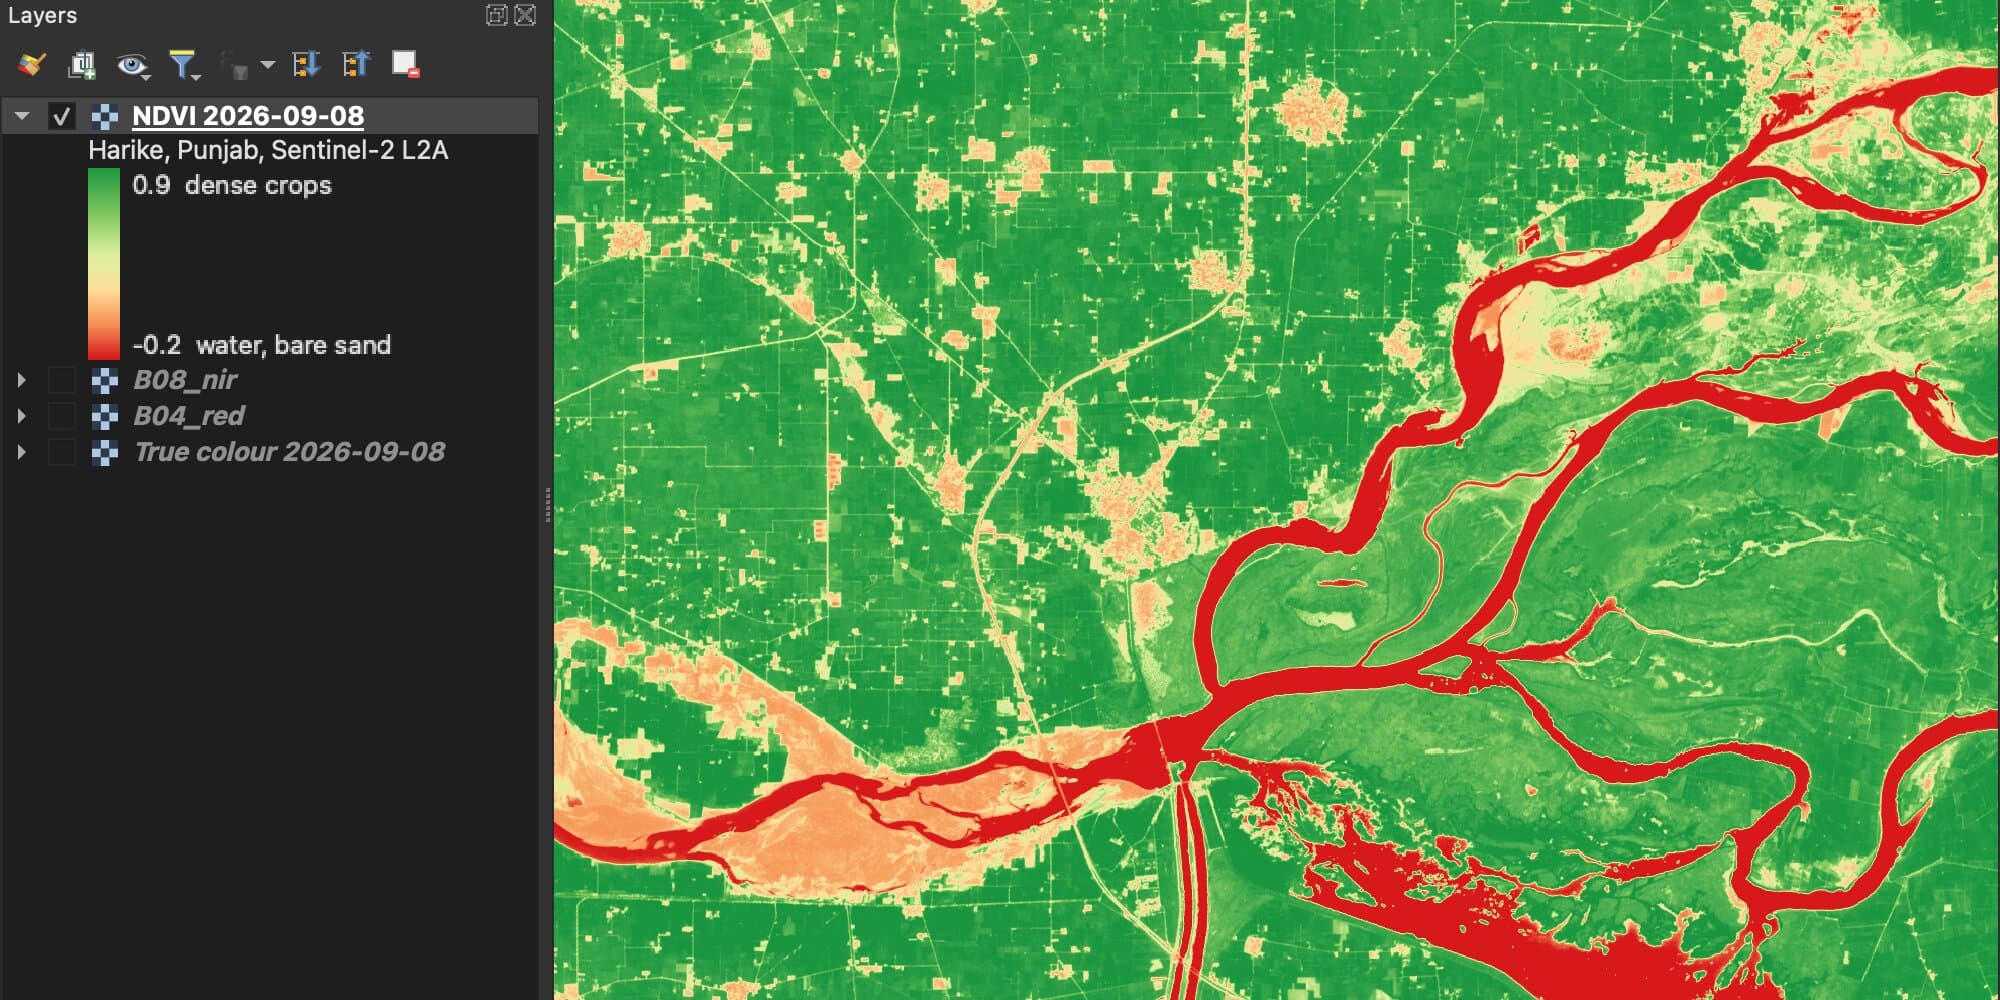
Open the layer's properties, Symbology, render type Singleband pseudocolor, a red-yellow-green ramp from −0.2 to 0.9. Water turns red-brown, fields green.
Summarise per field
Run Processing > Zonal statistics with your field polygons to get the mean NDVI of each field as an attribute.
Here is the Raster Calculator with the formula for raw Sentinel-2 values, where 1,000 is taken off each band first:
And the result, styled from red to green, with the legend in the Layers panel:
In one message
We build AI Agent, so this part is about our own plugin. The steps above take about ten minutes once you know them. With the plugin, you type the task instead. I sent it this, in a new project with default settings: "Calculate NDVI for the fields around Harike, Punjab from the latest cloud-free Sentinel-2 image, style it red to green, and tell me what share of the area is above 0.6."
It checked five September images, skipped two with clouds, used the 8 September one, removed the offset, and answered in about 3 minutes 30 seconds: 75% of the 17 km² area was above 0.6. Its NDVI matched my manual one pixel for pixel.
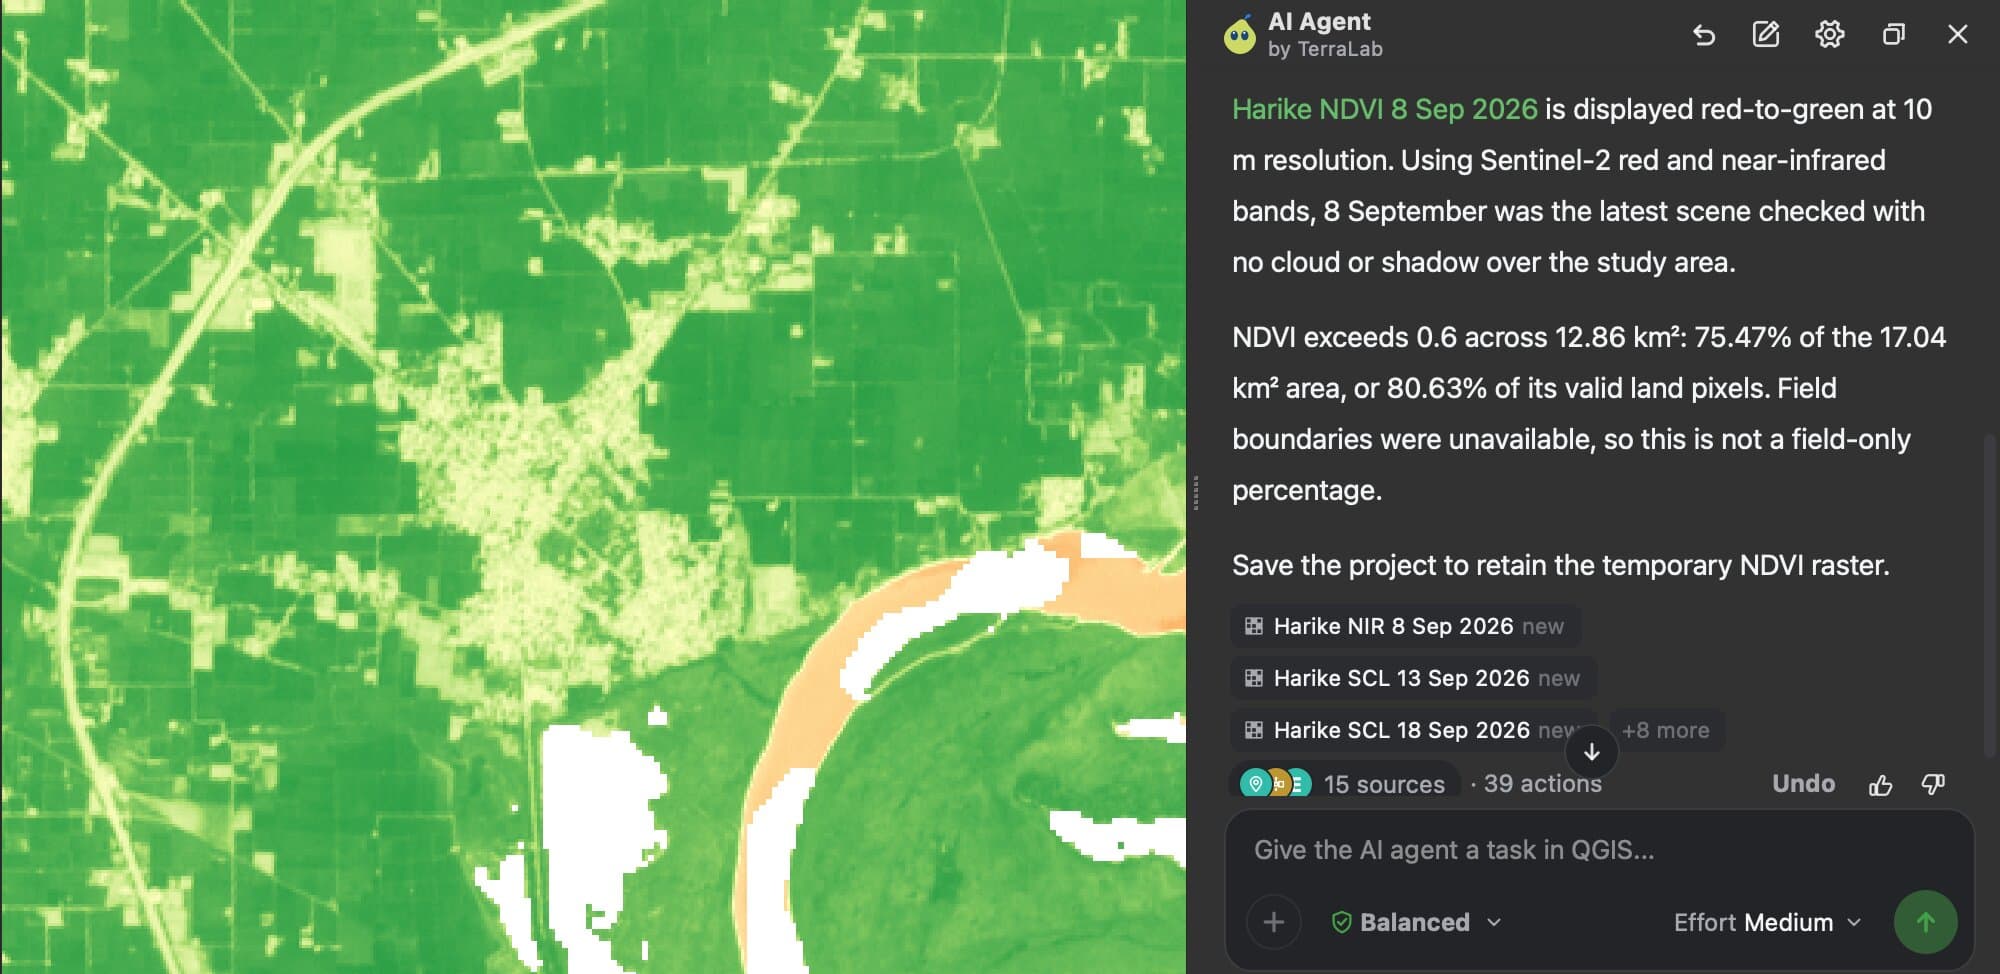
It also left its working layers in the project, and called the area "4 km by 4 km" when it measures 3.8 by 4.5 km. Small things, but check the numbers you quote.
Try AI Agent free in QGIS, no card needed
What to remember
NDVI = (NIR − Red) / (NIR + Red), a value from −1 to +1. Dense crops and forest score about 0.6 to 0.9, bare soil about 0.1, water below zero.
The same field crosses the whole scale in a year, so an NDVI value only means something with its date. One field in Punjab read 0.06 in early June and 0.92 in early September.
On Sentinel-2, NDVI uses B8 and B4 at 10 m. Since 25 January 2022, raw Level-2A values carry a −1000 offset that lowers a dense crop's NDVI from 0.82 to 0.56 if you ignore it.
NDVI saturates over dense canopy and is sensitive to soil and clouds. EVI, SAVI and NDRE answer those cases better.
Questions people ask
What is a good NDVI value for crops?
A healthy crop at peak growth usually reads 0.6 to 0.9. Early in the season, when plants cover little of the soil, 0.2 to 0.4 is normal. Compare a field with itself over the season, or with neighbouring fields of the same crop on the same date, rather than against a fixed threshold.
What does a negative NDVI mean?
Almost always water, cloud or snow, which reflect more red than near-infrared light. Clear open water usually reads below zero, while muddy or shallow water can sit just above it, so NDVI alone is a poor water detector.
Which Sentinel-2 bands are used for NDVI?
B8 (near-infrared, 842 nm) and B4 (red, 665 nm), both at 10 m. NDVI = (B8 − B4) / (B8 + B4) on reflectance. On raw Level-2A values processed since 25 January 2022, subtract the 1,000 offset from each band first.
What is the difference between NDVI and NDRE?
NDRE uses a red-edge band instead of the red band. It keeps responding over dense canopy where NDVI saturates, which makes it better for nitrogen and late-season crop vigour. It needs a sensor with a red-edge band, such as Sentinel-2 or a multispectral drone camera.
Can I calculate NDVI from a normal drone photo?
No. NDVI needs a near-infrared band, and an ordinary RGB camera records only red, green and blue. Visible-light indices such as VARI exist, but they're weaker proxies. For NDVI from a drone, you need a multispectral camera.
Can QGIS calculate NDVI automatically?
QGIS has no one-click NDVI button, but the Raster Calculator does it with one formula, as shown above. To skip the steps, an AI agent plugin can find the image, compute NDVI and style it from one sentence: ours, AI Agent, did it for a Punjab farming area in about three and a half minutes.
Where can I get NDVI data for free?
Compute it yourself from Sentinel-2 (10 m) or Landsat (30 m), both free, or download NASA's ready-made MODIS NDVI (MOD13Q1, 250 m, every 16 days). QGIS computes it from the two bands in a minute with the Raster Calculator.
To get the imagery, downloading Sentinel-2 in QGIS compares four ways, with the scene picked and streamed. Multispectral vs hyperspectral explains the bands behind the index, and tree canopy mapping in QGIS takes vegetation from an index to polygons. AI Agent runs the whole NDVI workflow from one sentence in QGIS, and the QGIS AI hub lists the other AI plugins by task.