Multispectral vs Hyperspectral Imagery, Explained
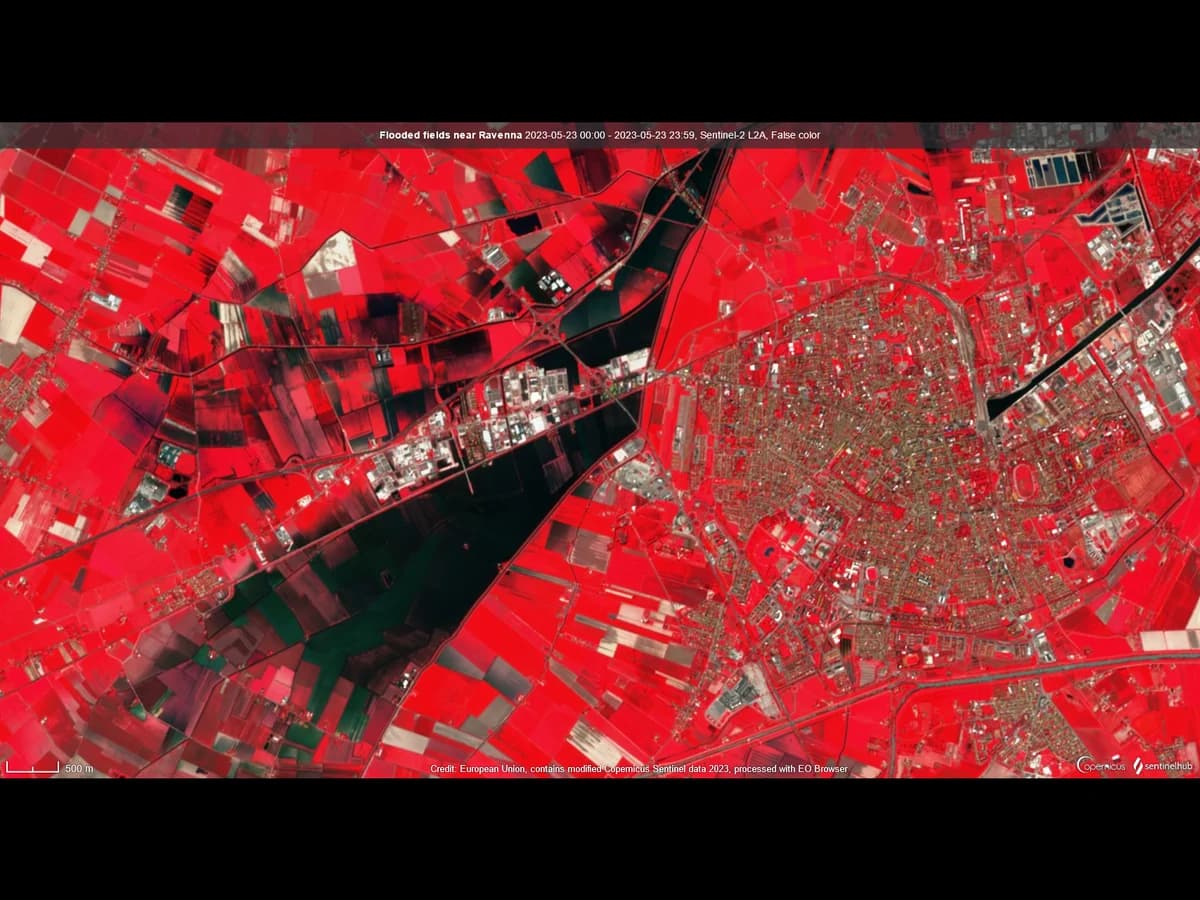
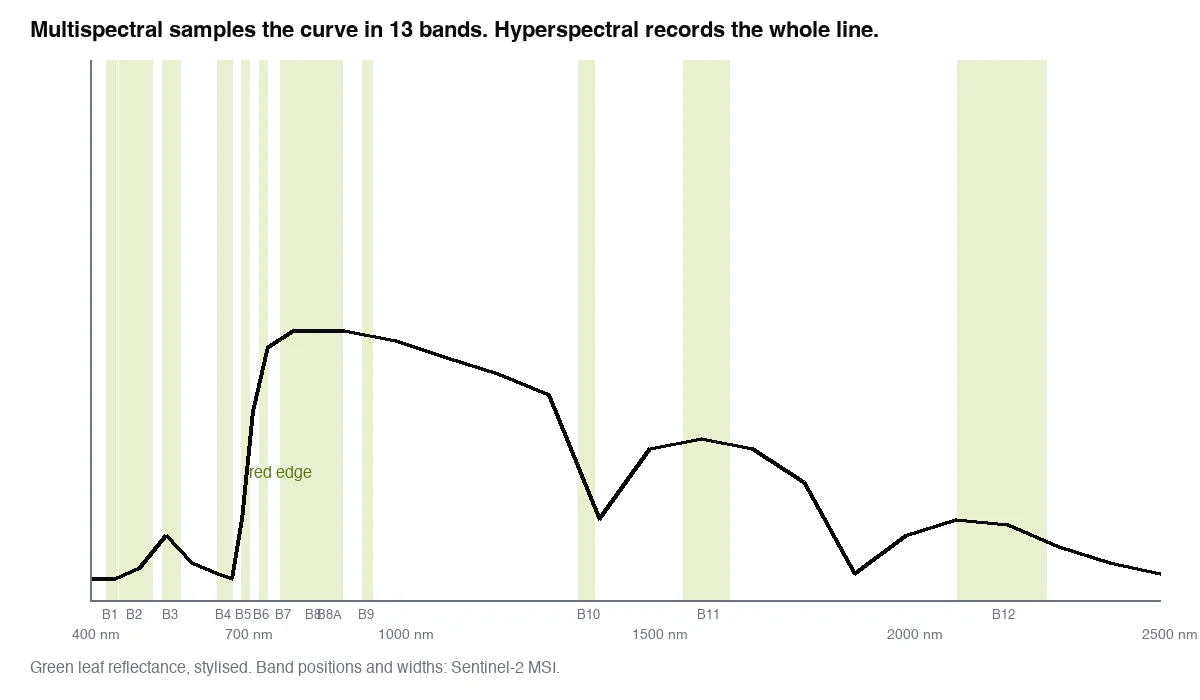
A multispectral image records the light reflected from the ground in a handful of bands, typically 4 to 13, each a wide slice of the spectrum: blue, green, red, near infrared, a few in the shortwave infrared. A hyperspectral image records the same light in hundreds of narrow, contiguous bands, so every pixel carries a full spectrum instead of a few samples of it.
The difference in one line
Multispectral tells you that a field is green and stressed. Hyperspectral can tell you which crop, which mineral, which pigment.
| Multispectral | Hyperspectral | |
|---|---|---|
| Bands | 4 to 13 | 100 to 300 |
| Free satellites | Sentinel-2, Landsat | EnMAP, PRISMA, on request |
| Drone sensor | A few thousand euros | Tens of thousands |
| Data per scene | Hundreds of megabytes | Gigabytes |
| Answers | Vegetation, water, built, stressed | Which species, which mineral, which plastic |
What each one is good for
Multispectral does almost everything a GIS team does with satellite imagery, for free. Sentinel-2 delivers a new 13-band scene of every point on land every five days, and its near-infrared band is enough to map crops, forest, water, burned areas and built-up extent. The tool is index arithmetic, NDVI first, then a classification in the Semi-Automatic Classification Plugin. The tree canopy post runs that route.
Hyperspectral adds discrimination inside a class. Two crops that look the same in every Sentinel-2 band have different spectra at 10 nanometre resolution. Mineral mapping, its original use, reads absorption features no multispectral band can see. The price is expensive sensors, heavy data, and free satellites that image on request at 30 m with a revisit measured in weeks.
Which one for which job in QGIS
- Land cover, crop type, forest extent, flood extent. Multispectral. Free, frequent, and the QGIS classification tools were built for it.
- Crop stress before it shows, species, minerals, contamination, plastics. Hyperspectral, from a drone for a site, from EnMAP or PRISMA for a region.
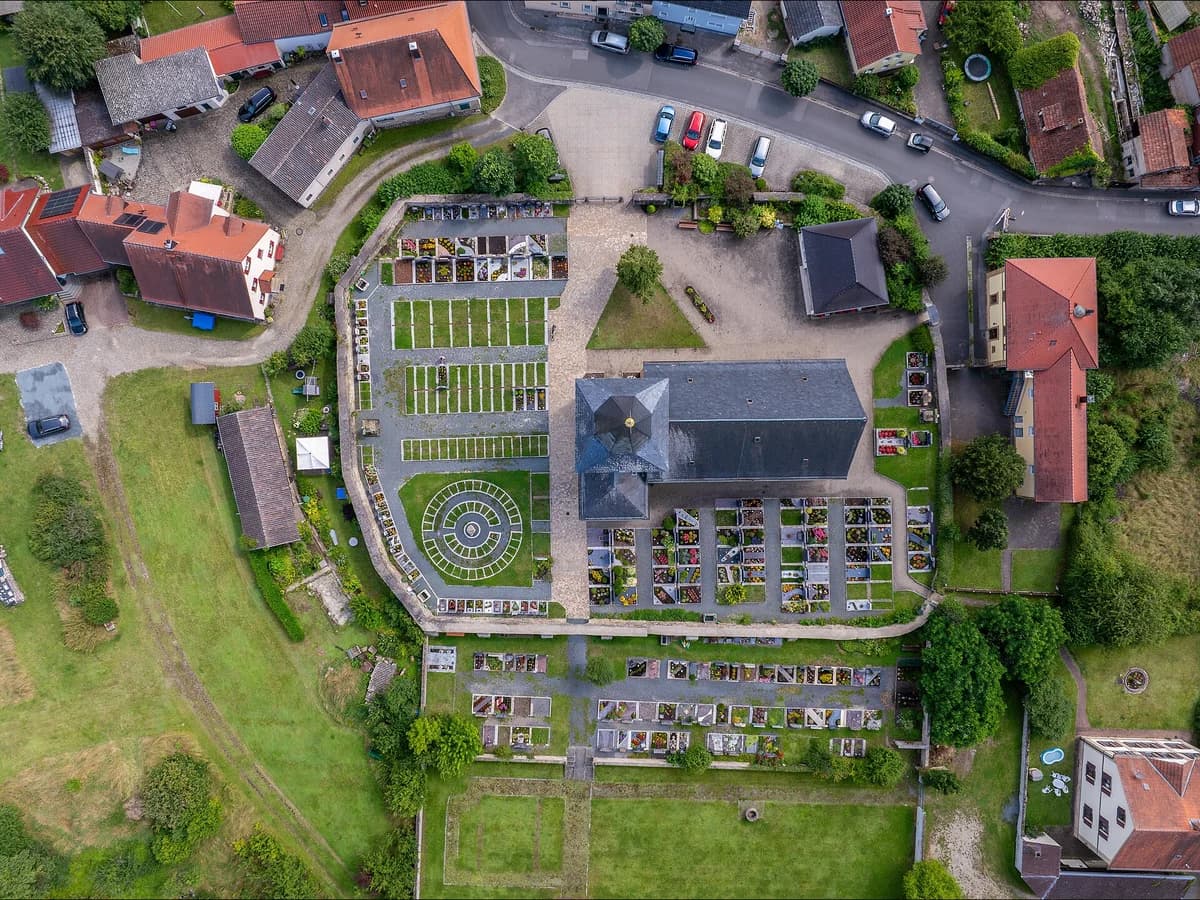
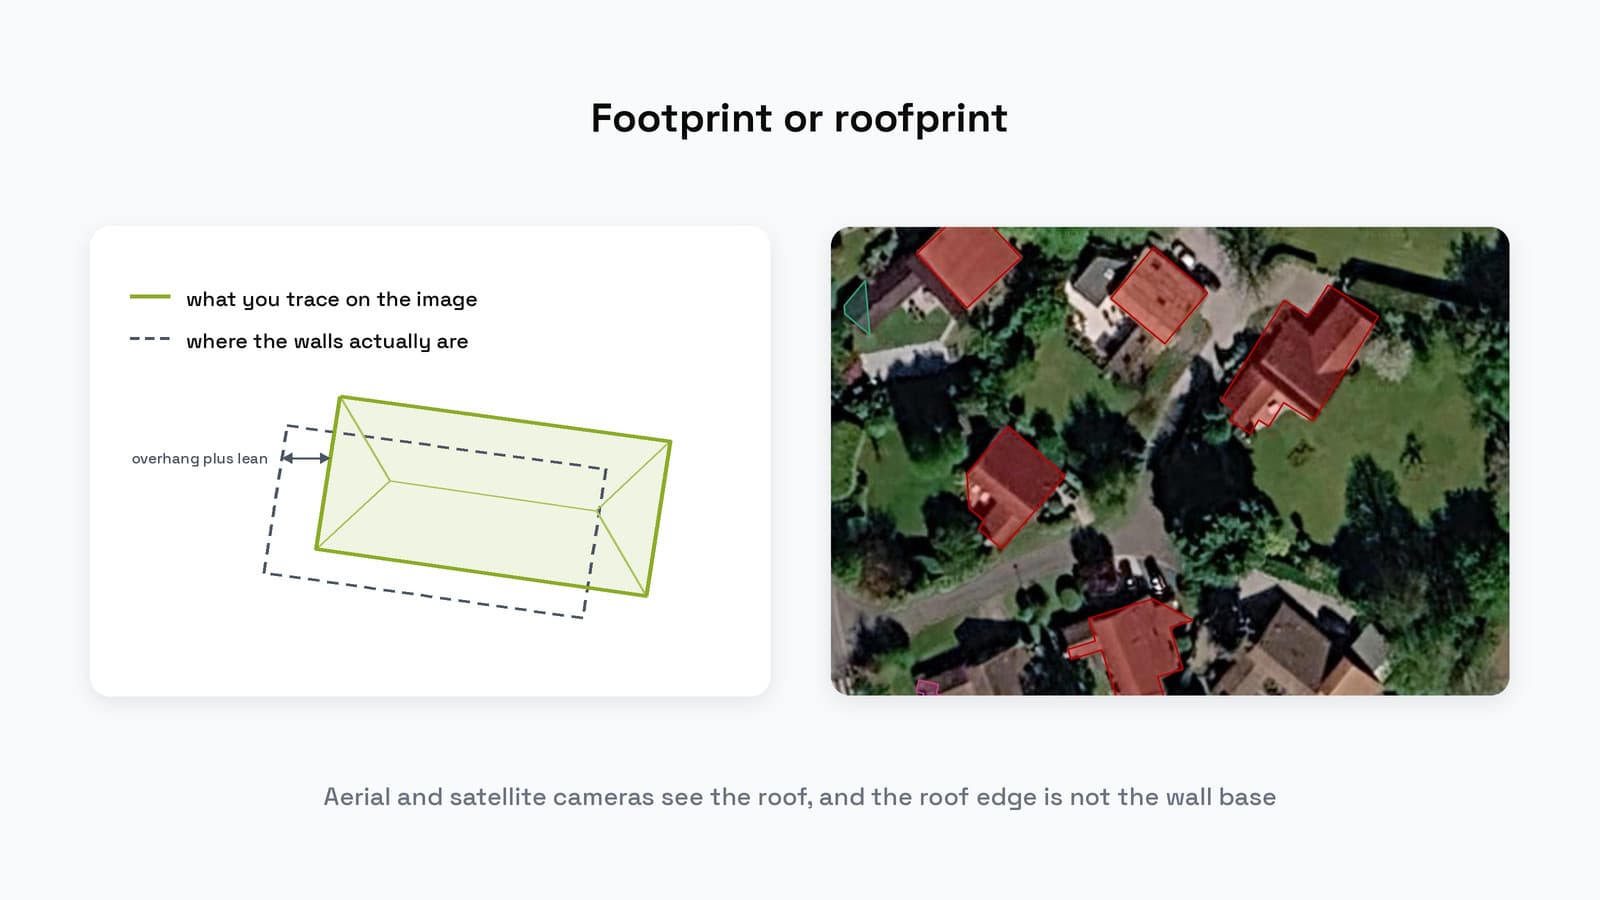
- Anything that needs to see a small object. Neither. Both are pixel sciences at 10 to 30 m. A roof, a tree crown or a pool is a shape, read from high-resolution imagery in three bands. AI Segmentation, the plugin we make at TerraLab for QGIS, works that way: it reads the RGB orthophoto and returns one polygon per object.
 , works that way: it reads the RGB orthophoto and returns one polygon per object.
Questions people ask
Is Sentinel-2 multispectral or hyperspectral?
Multispectral: 13 bands at 10, 20 and 60 m. The free hyperspectral missions are EnMAP, PRISMA and NASA's EMIT.
What is the red edge?
The steep rise in a leaf's reflectance between about 680 and 750 nanometres. Its position shifts with plant stress, which is why Sentinel-2 carries three narrow bands across it.
Does QGIS support hyperspectral data?
Yes. A hyperspectral scene is a raster with a few hundred bands and every raster tool reads it. EnMAP-Box, a QGIS plugin from the EnMAP team, is built for that case.
The QGIS AI hub collects what AI can and cannot do inside QGIS. The imagery vocabulary continues on the orthomosaic vs orthophoto page.