Turn a Satellite Image into a Site Plan in QGIS
Published Updated
To turn a satellite image into a site plan you need three things: georeferenced imagery, a way to trace what you see into flat shapes, and a way to get the result back at the right scale. In QGIS the first and the third come with the software, and the tracing is the part that eats the afternoon.
 the first and the third come with the software, and the tracing is the part that eats the afternoon.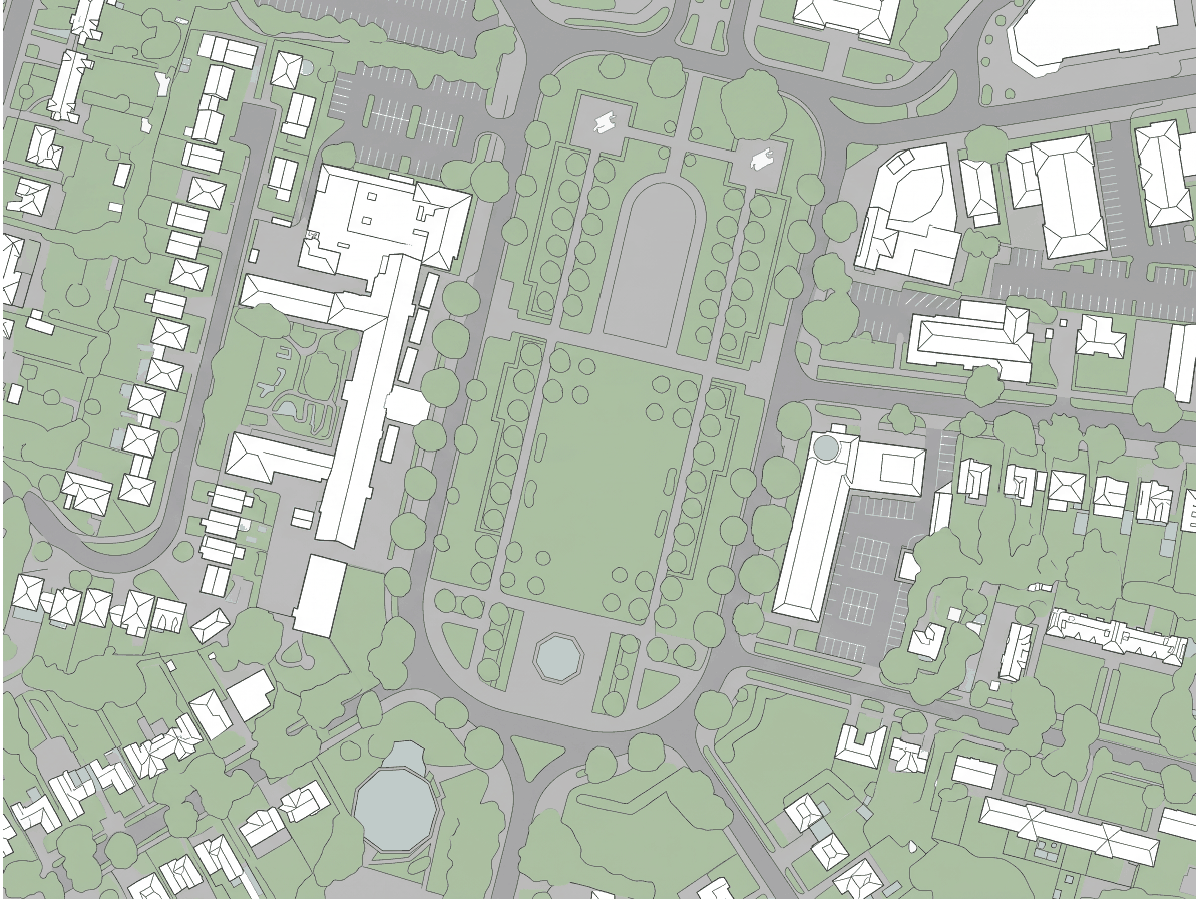
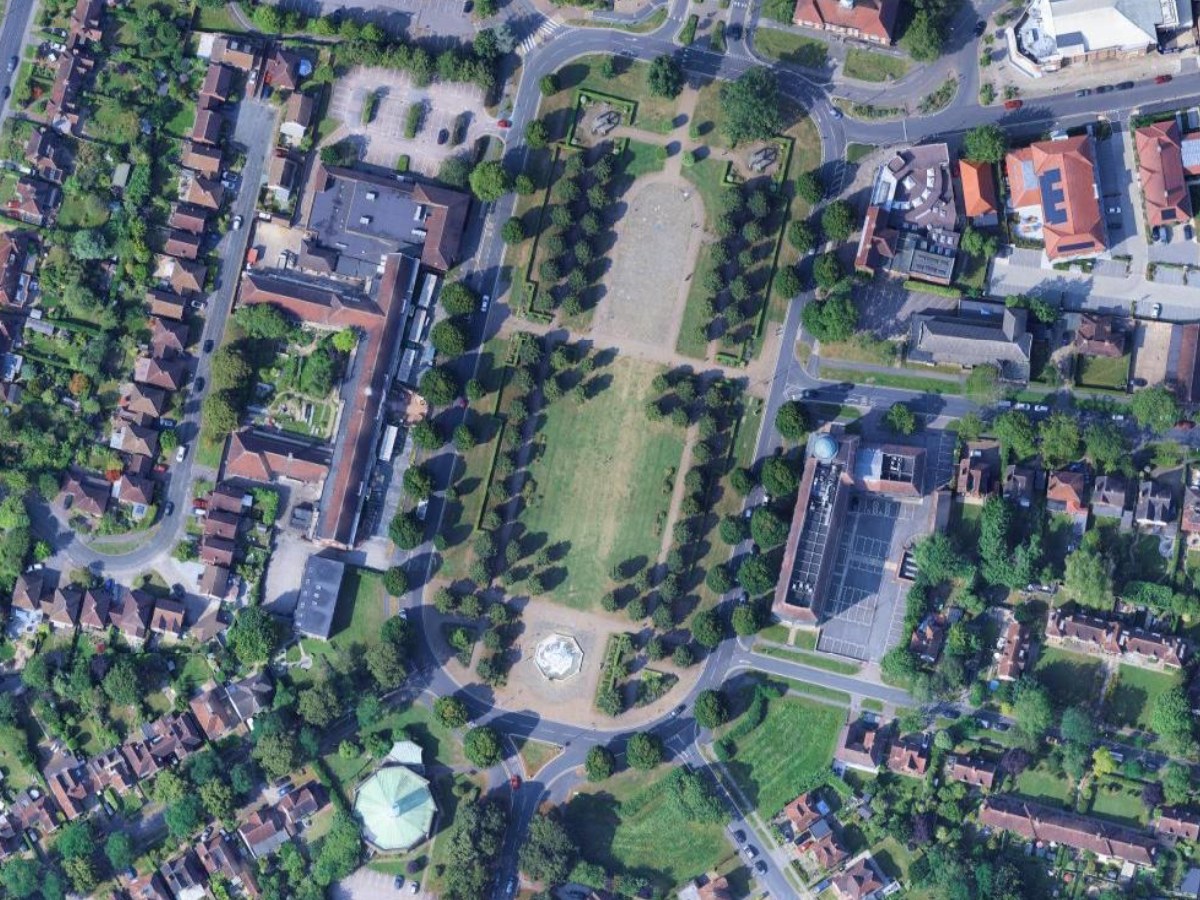
This post walks the manual route first, then does the same block in 29 seconds with a model that redraws the image, and says what the model got wrong. Every image here is a screenshot of that QGIS session.
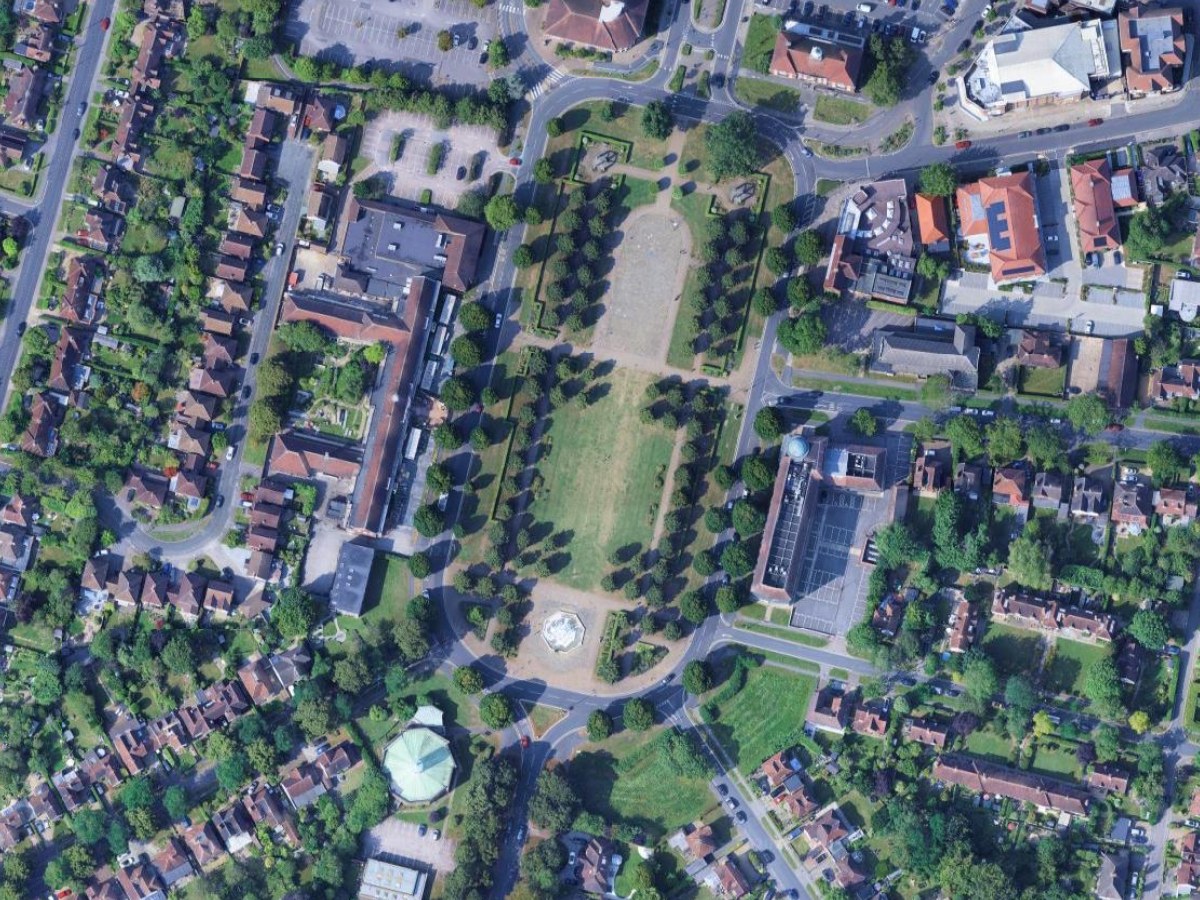
The site is Broadway Gardens in Letchworth Garden City, the first garden city, about 55 km north of London. A 586 by 439 metre block: a formal park with a fountain, the old town hall, a library, an office block with its car park, and two streets of houses. Enough variety to break a lazy method.
What is a site plan, and why start from a satellite image?
A site plan is a scaled, top-down drawing of a parcel and its surroundings: the buildings that exist, the roads and paths that reach them, the trees and lawns between them, and, on a proposal drawing, the thing you want to build. Planning departments ask for one with almost every application. Architects draw one at the start of every project to understand the site before touching the design.
A satellite or aerial image is the honest base for it because it already contains every answer: where the footprints are, how wide the road is, which trees are mature. The problem is that it contains them as pixels, and a site plan needs them as shapes. Everything below is about that conversion.
The manual route: trace it yourself
- Imagery you can read at plot scale. Google Satellite is the easiest to load in QGIS and it covers most of the world at 15 to 30 cm. National orthophotos are better where they exist: NAIP in the United States, IGN's BD ORTHO in France, and most cadastral agencies in Europe publish a WMS. Any of them works: a GeoTIFF, a WMS, or an XYZ basemap.
- QGIS, on Windows, macOS or Linux. Version 3.22 or later.
- The QuickMapServices plugin to load Google Satellite in one click. Plugins, Manage and Install Plugins, search "QuickMapServices".
You do not need Photoshop, Illustrator, or any other GIS. This post starts from the image alone, not from CAD drawings.
I'll give you this route in full first, because it needs no plugin and because knowing it is what lets you judge the AI result afterwards.
Load the imagery and frame the site
Web, QuickMapServices, Google, Google Satellite. Zoom to your plot. For a block this size I frame at around 1:2,000; for a single house plot, 1:500. The imagery is already georeferenced, so the scale bar in the bottom bar is right without any work on your part.
Create one polygon layer with a class field
Layer, Create Layer, New GeoPackage Layer. Geometry type Polygon, CRS the same as your project, and a text field class_name. One layer with a class field beats four layers, because you can style it in one place and export it in one file.
Trace buildings, then roads, then vegetation
Toggle editing, Add Polygon Feature, click around each footprint. Hold the mouse steady on corners and do not chase every bay window; a site plan reads at 1:500, not at 1:50. Roads next, as one long polygon per carriageway. Vegetation last, as loose blobs, because nobody checks the edge of a lawn.
I have not timed a hand trace of this exact block, so I won't quote a number. What I can say is that it has several hundred buildings, and each one takes several clicks.
Style the classes with flat fills
Layer Properties, Symbology, Categorized on class_name. White with a thin black outline for buildings, mid grey for roads, pale green for vegetation, pale blue for water. Those four fills are the whole visual language of a site plan; resist adding more.
Export at scale
Project, New Print Layout. Add the map, set the scale to 1:500 or 1:1,000, add a scale bar and a north arrow, export as PDF. That PDF is what a planning portal accepts.
This route gives you a correct site plan and a file you own. The only work is the tracing, and it grows with the number of buildings. If the block is already in open data, the free building footprint downloader hands you the building polygons as GeoJSON and leaves only roads and vegetation to trace.
The fast route: let a model redraw the image
A generative model can restyle imagery in place: same extent, same shapes, photographic texture swapped for flat fills. We build one of these, AI Edit. This section is about our own tool.
It takes a zone of your imagery, a sentence describing the change you want, and returns the result as a new georeferenced raster layer, aligned to the pixel with the original. For a site plan, the "change" is a style: keep every shape where it is, replace the photographic texture with flat fills.
Install the plugin and sign in
Plugins, Manage and Install Plugins, search AI Edit, Install. Open the panel and click Sign in. Your browser opens, you create an account, and the plugin connects itself. If you want the full tour of the panel before starting, it is in the complete guide.
Draw the zone
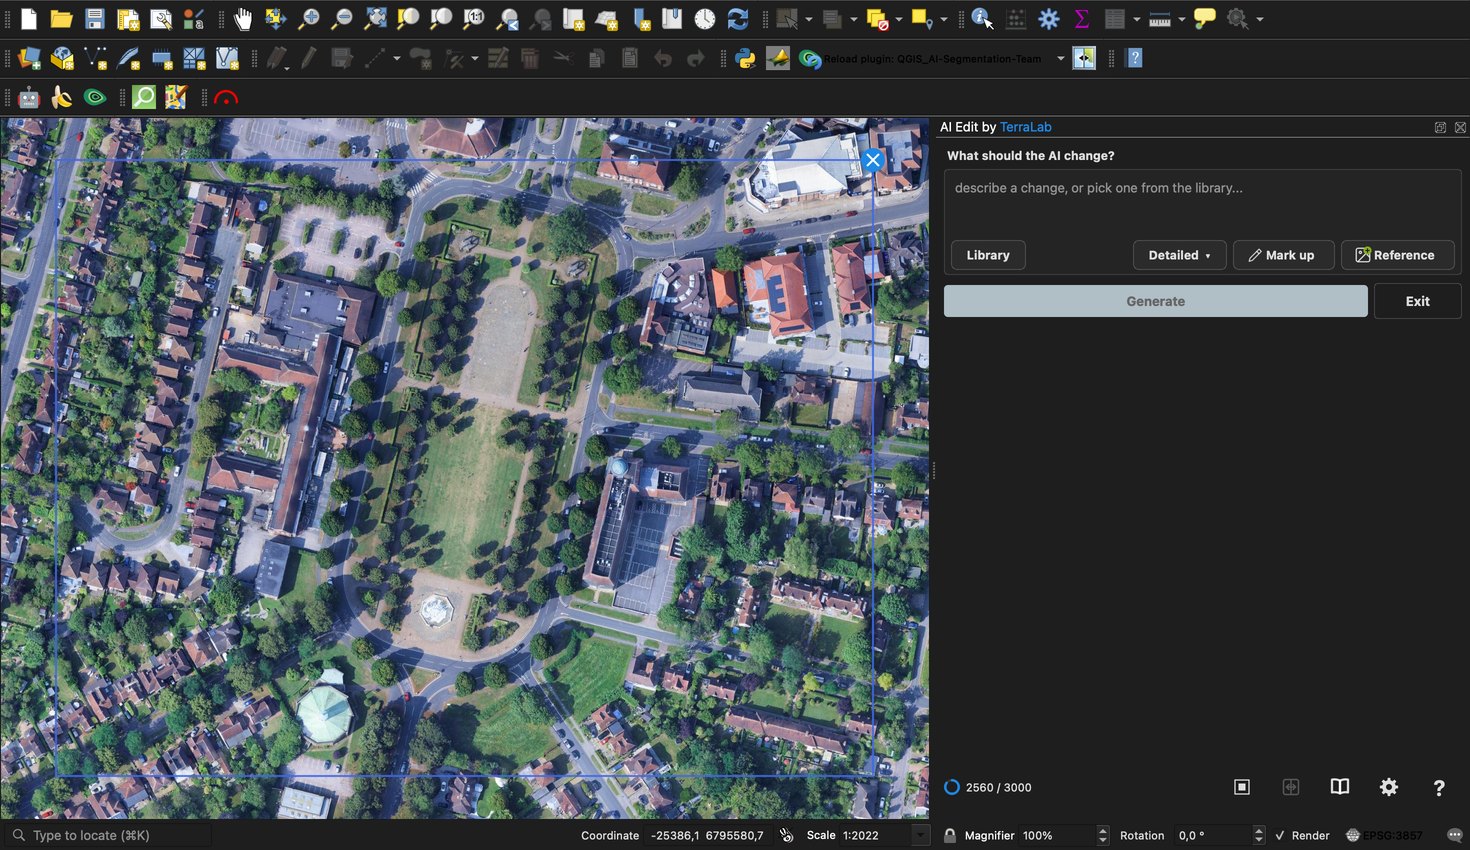
Click Launch AI Edit, then click the corners of your area on the map and press Return to close it. I outlined the whole block, 586 by 439 metres. That's on the large side: the panel warns you above roughly a square kilometre that the AI keeps only broad shapes, and it is right to.
Write the prompt as a specification, not a wish
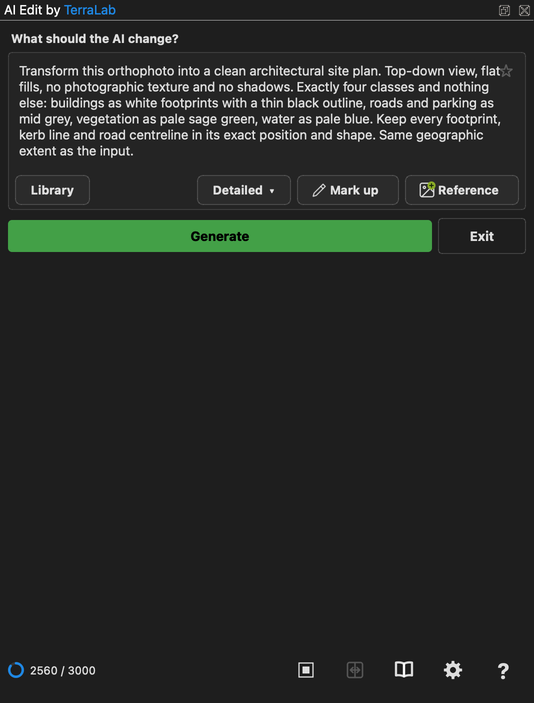
This is the prompt I used, word for word:
Transform this orthophoto into a clean architectural site plan. Top-down view, flat fills, no photographic texture and no shadows. Exactly four classes and nothing else: buildings as white footprints with a thin black outline, roads and parking as mid grey, vegetation as pale sage green, water as pale blue. Keep every footprint, kerb line and road centreline in its exact position and shape. Same geographic extent as the input.
Three things make it work. It names the classes and the colours, so the model does not improvise a palette. It says "exact position and shape", which is the difference between a site plan and a pretty picture. And it says what not to do: no shadows, no texture. The same prompt is in the panel's Library under Clean architectural site plan if you'd rather not type it.
Generate
Click Generate. On this block, with the output detail set to Detailed (the middle of the three settings), the result came back in 29 seconds. The new layer is a 2,392 by 1,792 pixel GeoTIFF, about 25 cm per pixel, saved in your Documents folder and added to the project on top of the imagery.
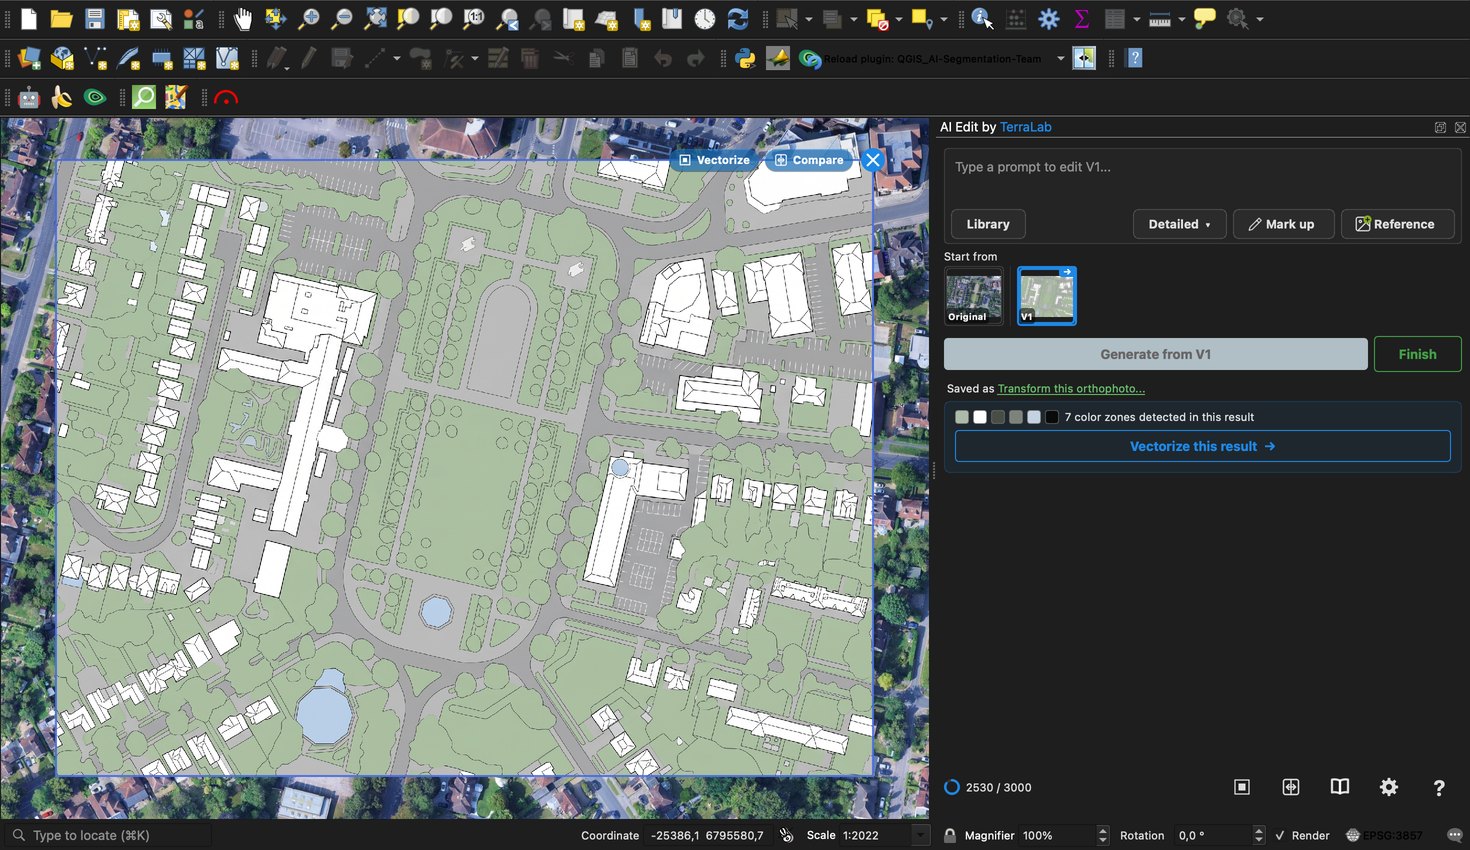
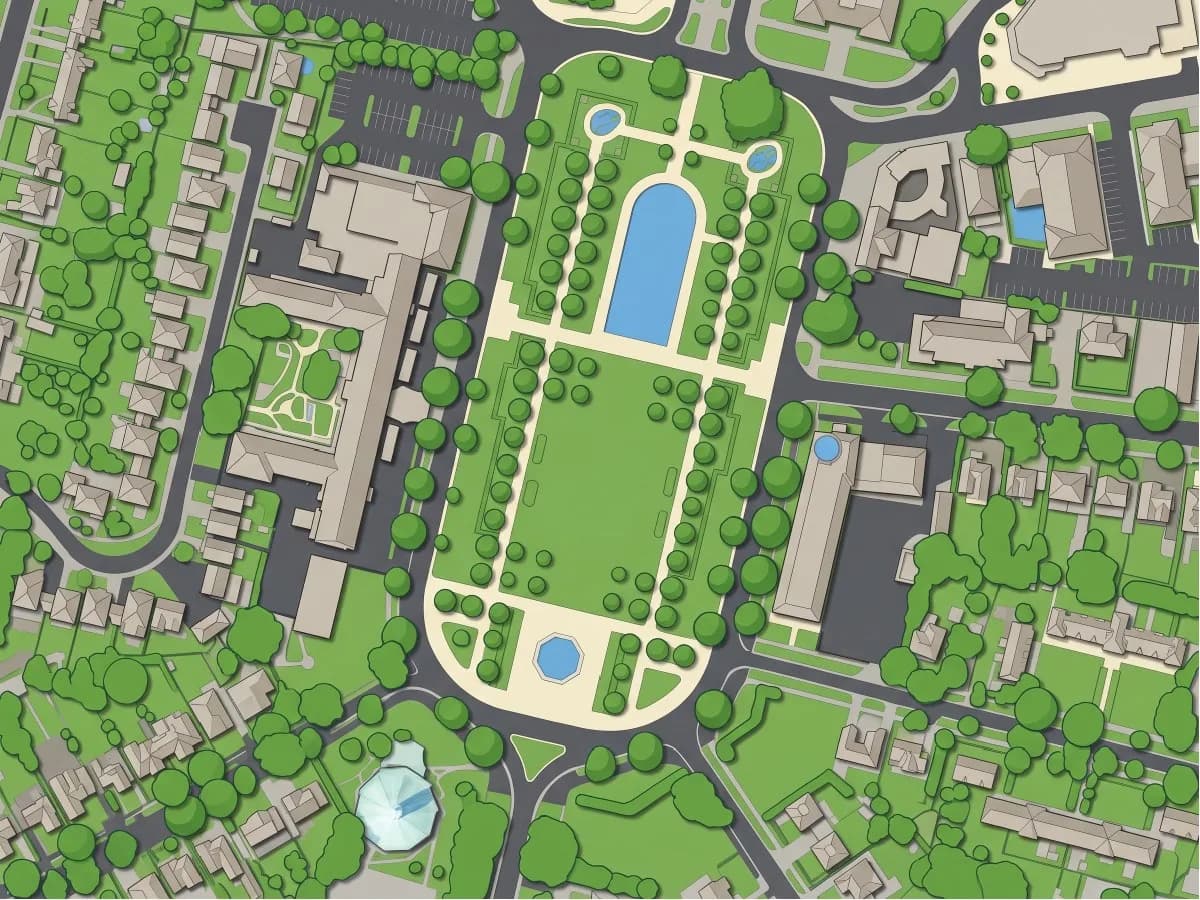
Look at the plan again in the slider at the top of this post. Every footprint is where it should be. The tree avenues along the park read as rows of canopies. The car parks have their bay lines. The fountain basin is a blue octagon, which is correct.
Try it free in QGIS, no card needed
What I fixed by hand, and what I would not trust
Here is what the AI got wrong on this block, from the same run, no cherry-picking.
- The octagonal building became a pond. The copper-roofed round building south-west of the fountain has a green roof, and the plan drew it as pale blue water. It's the one real error among several hundred footprints, and it is the kind of error you only catch because you looked at the image first.
- Parking bay stripes came through. The painted bay lines in the two car parks are drawn in light grey. Keep them if you want the bays shown, or ask the prompt for plain grey parking.
- Most tree crowns merged into the lawn colour. If individual tree positions matter to your plan, run a second edit with a tree-only prompt, or use AI Segmentation with the prompt "tree", which is built for counting individual objects.
I would not use this method for a boundary survey or anything where a 30 cm error matters. The plan is as accurate as the imagery, and Google Satellite is not a survey. For a feasibility study, a pre-application drawing, a landscape concept, or a client meeting tomorrow morning, it is exactly what I'd use.
What to remember
Under about twenty buildings, trace it by hand. You will be done before you have written a good prompt, and you will know every corner of the site, which is the real point of drawing one.
The generated route earns its place on blocks and neighbourhoods, on repeat work across many sites, and on the days when the drawing is due at nine.
A prompt that names the four classes and their colours, and says "exact position and shape", is the difference between a site plan and a pretty picture.
The output is a georeferenced image at true scale, so a print layout made from it is dimensionally correct, within the accuracy of the imagery.
One green roof came back as a pond on this block. Look at the imagery before you look at the plan, because that is the only way you catch an error like it.
Questions people ask
Does the site plan come back at the right scale?
Yes. The result is a GeoTIFF in the same coordinate system as your imagery, so it sits on the map at true scale and any print layout you make from it is dimensionally correct, within the accuracy of the imagery itself.
Can I use my own drone or survey imagery?
Yes. The plugin works on whatever raster layer you select in the panel: a GeoTIFF from a drone flight, a WMS from your national mapping agency, or a basemap. Sharper input gives a sharper plan.
Which QGIS versions?
QGIS 3.22 and later, and QGIS 4, on Windows, macOS and Linux.
Can I screenshot the imagery from Google Earth and trace over that?
A screenshot carries no coordinates, so you spend twenty minutes in the Georeferencer before you can draw a line. Imagery loaded in QGIS is already georeferenced, and that is the whole reason to start here rather than in a drawing tool.
Is an AI site plan accurate enough for a survey?
The plan is as accurate as the imagery under it, and Google Satellite is not a survey. It is right for a feasibility study, a pre-application drawing or a client meeting, and wrong for a boundary.
Next step
Load your own site, draw the zone, paste the prompt above. If the plan is right, you have a base to design on. If it's wrong, you have learned something about your site in thirty seconds, and the manual route is still there.
One last thing. The plan you get back is an image. If all you need is a picture for a presentation or a client deck, that is enough, and you can stop here. If you need polygons you can edit, the plugin has a tool that turns the flat colours into vector shapes, one class per colour. That is a subject for another post.
Before you trace anything, it helps to know which kind of site you're looking at: the greenfield vs brownfield page covers how each reads on the same kind of aerial image this post starts from.
More on what AI can and cannot do inside QGIS on the QGIS AI hub.