Sentinel-2 vs Landsat 8 and 9: Bands, Resolution, Revisit
Published
Sentinel-2 and Landsat 8 and 9 are the two free multispectral satellite families most GIS work runs on. Sentinel-2 has sharper pixels (10 m against 30 m) and passes more often, while Landsat adds a thermal band and an archive that goes back to 1972. For a field or a town edge after 2015, start with Sentinel-2.
Sentinel-2 vs Landsat in one line
Sentinel-2 is the sharper, more frequent camera, and Landsat is the longer memory with a thermometer attached.
| Sentinel-2 (A, B, C) | Landsat 8 and 9 | |
|---|---|---|
| Pixel size | 10 m (4 bands), 20 m (6), 60 m (3) | 30 m, 15 m panchromatic |
| Bands | 13 | 11 (9 OLI + 2 TIRS) |
| Revisit | 5 days with two satellites | 8 days with both |
| Thermal | None | 2 bands, 100 m |
| Archive starts | 2015 | 2013 for these two, 1972 for the series |
| Swath | 290 km | 185 km |
The specs come from ESA's Sentinel-2 mission page and the USGS Landsat band designations. Here is what three times the pixel size looks like on the same fields, photographed 13 minutes apart:
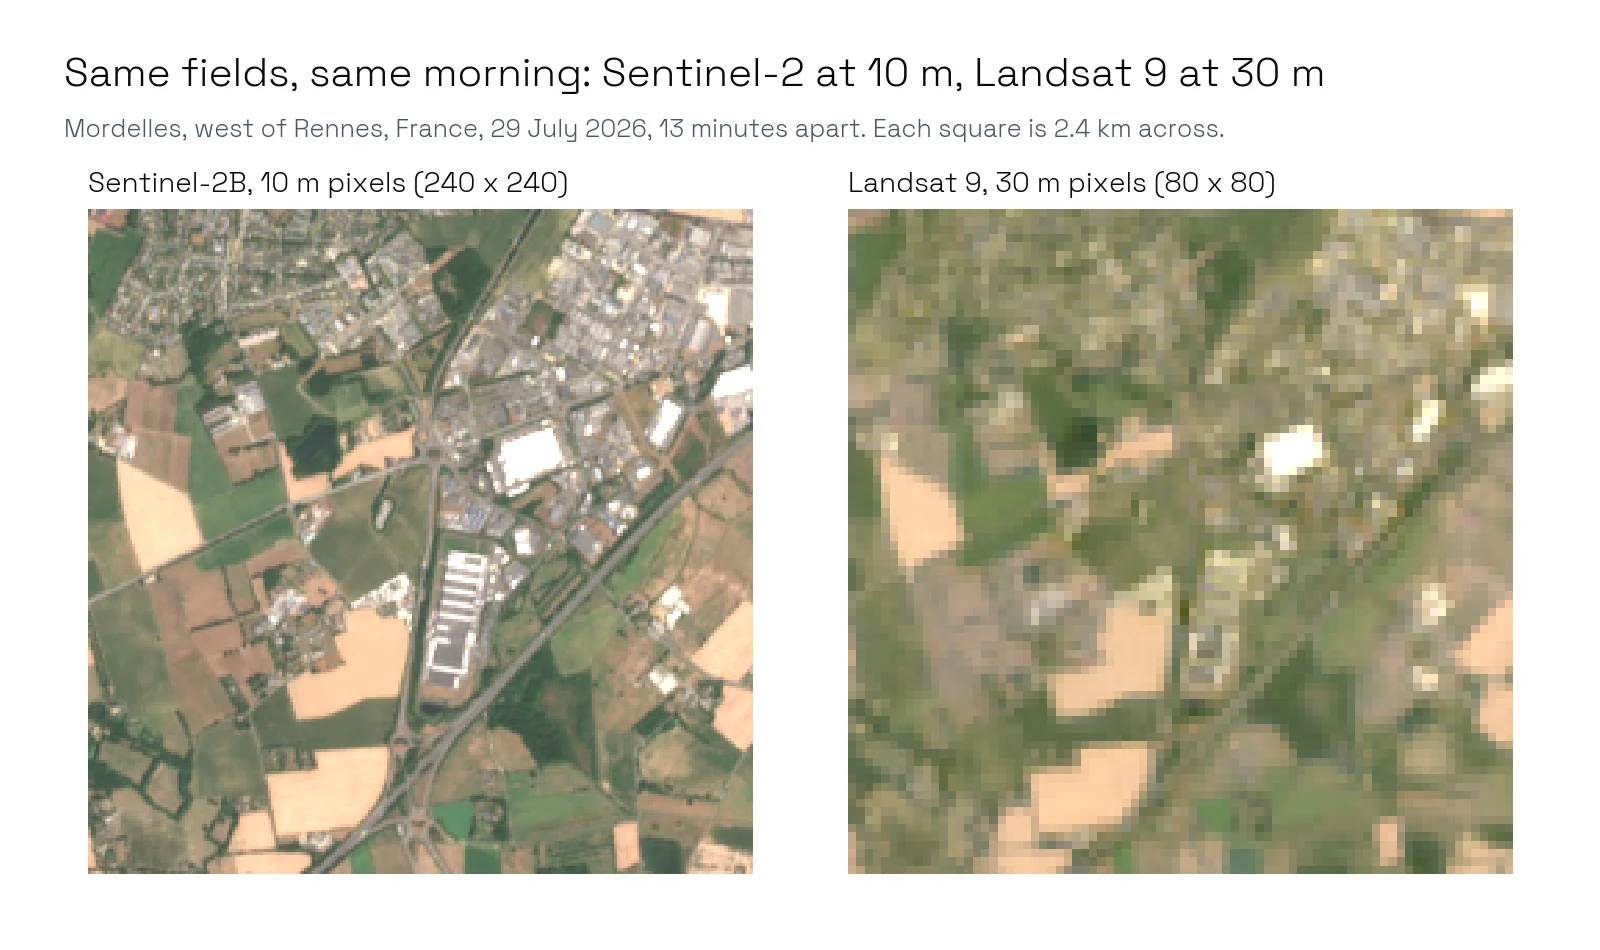
At 30 m a hedge, a lane or a small barn disappears into the pixel next to it. A large field still reads fine.
Sentinel-2 and Landsat bands side by side
Sentinel-2 band B4 is red and Landsat 8 and 9 band 4 is also red, but the numbers stop matching after that: Landsat's near-infrared is band 5, while Sentinel-2's is B8 (or the narrower B8A). Sentinel-2 adds three red-edge bands and a water vapour band, and Landsat adds a panchromatic band and two thermal bands.
| Sentinel-2 band | Centre (S2A) | Pixel | Landsat 8 and 9 band | Range | Pixel |
|---|---|---|---|---|---|
| B1 Coastal aerosol | 443 nm | 60 m | 1 Coastal aerosol | 430 to 450 nm | 30 m |
| B2 Blue | 493 nm | 10 m | 2 Blue | 450 to 510 nm | 30 m |
| B3 Green | 560 nm | 10 m | 3 Green | 530 to 590 nm | 30 m |
| B4 Red | 665 nm | 10 m | 4 Red | 640 to 670 nm | 30 m |
| B5, B6, B7 Red edge | 704, 740, 783 nm | 20 m | None | ||
| B8 Near infrared | 833 nm | 10 m | 5 Near infrared | 850 to 880 nm | 30 m |
| B8A Narrow NIR | 865 nm | 20 m | 5 Near infrared (closest match) | 850 to 880 nm | 30 m |
| B9 Water vapour | 945 nm | 60 m | None | ||
| B10 Cirrus | 1374 nm | 60 m | 9 Cirrus | 1360 to 1380 nm | 30 m |
| B11 SWIR 1 | 1614 nm | 20 m | 6 SWIR 1 | 1570 to 1650 nm | 30 m |
| B12 SWIR 2 | 2202 nm | 20 m | 7 SWIR 2 | 2110 to 2290 nm | 30 m |
| None | 8 Panchromatic | 500 to 680 nm | 15 m | ||
| None | 10 and 11 Thermal | 10.6 to 12.5 µm | 100 m |
Sentinel-2B and 2C centres shift by a few nanometres from 2A. The two band combinations everyone uses translate like this: natural colour is B4-B3-B2 on Sentinel-2 and 4-3-2 on Landsat, and the false colour that turns vegetation red is B8-B4-B3 on Sentinel-2 and 5-4-3 on Landsat. Multispectral vs hyperspectral explains what these bands sample.
How often you can really see your field: measured at three farms
Over twelve months, Sentinel-2 gave a clear view of the same 300 m field on 43 to 57 days, against 21 to 31 days for Landsat 8 and 9 combined, and its longest wait for a clear view was 25 to 45 days against 56 to 96. I counted it for three farms in three climates, from 1 October 2025 to 30 September 2026.
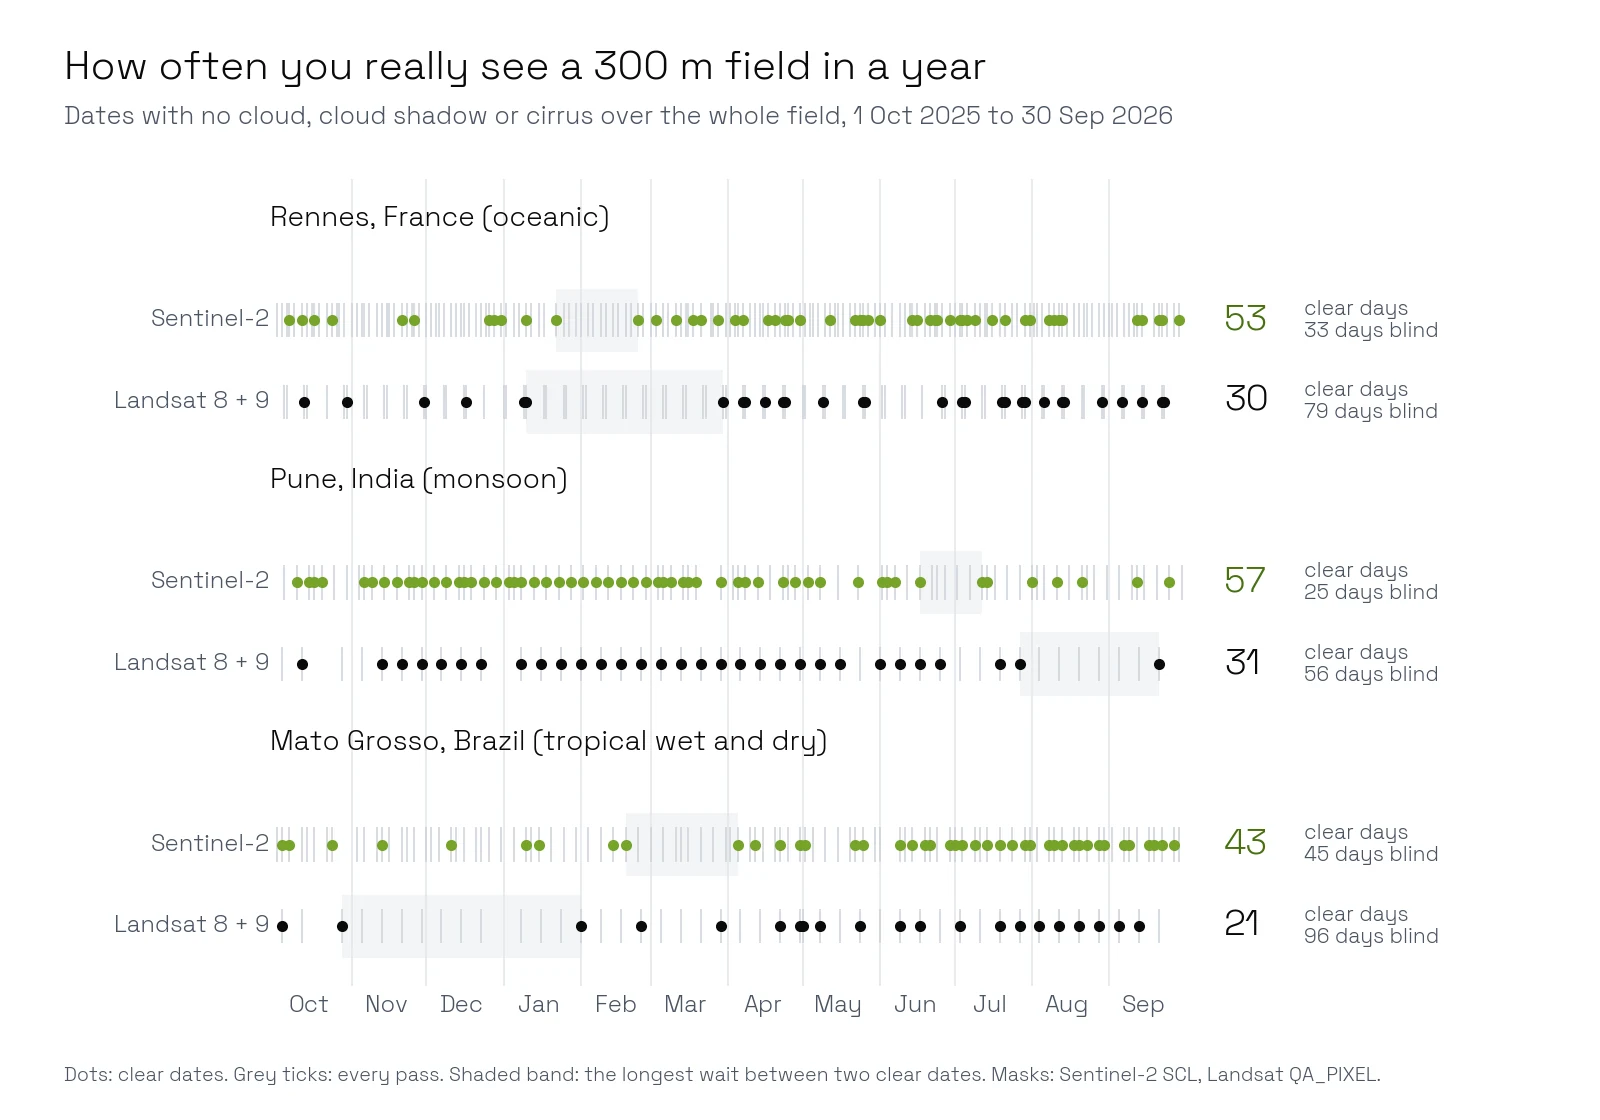
On paper the gap is 5 days against 8. On the ground Sentinel-2 gave about twice as many usable dates and, more useful for planning, halved the longest blind spell. Even so, all three places went a month without a clear view, in a Breton winter, a Maharashtra monsoon and a Mato Grosso rainy season:
| 1 Oct 2025 to 30 Sep 2026 | Sentinel-2 passes | Clear days | Longest wait | Landsat 8 + 9 passes | Clear days | Longest wait |
|---|---|---|---|---|---|---|
| Mordelles, near Rennes, France | 203 | 53 | 33 days | 87 | 30 | 79 days |
| Theur, near Pune, India | 85 | 57 | 25 days | 43 | 31 | 56 days |
| Sorriso, Mato Grosso, Brazil | 98 | 43 | 45 days | 44 | 21 | 96 days |
Rennes gets 203 Sentinel-2 passes because it sits where two orbits overlap and three satellites were flying, yet barely one pass in four was clear. Landsat's worst stretch there ran from 10 January to 30 March 2026.
How I measured this
I searched the Planetary Computer STAC catalogue for every Sentinel-2 L2A scene (2A, 2B and 2C) and every Landsat 8 and 9 Collection 2 Level-2 scene over each point, then read only the cloud mask of a 300 by 300 m window: the scene classification layer (SCL) for Sentinel-2, QA_PIXEL for Landsat. A date counts as clear only when every pixel of the window is free of cloud, cloud shadow, cirrus, snow and missing data. Two scenes from one satellite on one day count once. The limits: three places and one year are not a global average, both masks miss some thin cloud, and Sentinel-2's "unclassified" class decides a lot in Pune (count it as cloudy and Pune drops from 57 to 38 clear days). Sentinel-2A was also still flying next to 2B and 2C in an extended campaign, which adds passes a normal two-satellite year would not have.
Which one for which job in QGIS
In QGIS, pick Sentinel-2 for detail and frequency after 2015, Landsat for history and heat, and both for the densest time series.
- Fields, parcels, crop monitoring, anything after 2015. Sentinel-2. Ten metre pixels and twice the clear dates, so after 2015 I only add Landsat to fill a gap. How to download Sentinel-2 in QGIS compares four ways to get it.
- Change over decades, or anything before 2015. Landsat. Its Collection 2 surface reflectance reaches back to Landsat 4 in 1982, at the same 30 m.
- Surface temperature, urban heat, evapotranspiration. Landsat, the only one of the two with thermal bands.
- A dense time series in a cloudy place. Both, through NASA's harmonized product (see the FAQ).
We build AI Agent, the QGIS plugin that runs a GIS task from one sentence. Asked for the latest cloud-free Sentinel-2 image of the area on the canvas, it checks the candidate dates, skips the cloudy ones and loads the scene, as in the NDVI guide.
Questions people ask
Is Sentinel-2 or Landsat better for NDVI?
Sentinel-2 for anything at field scale: NDVI from B8 and B4 at 10 m, against bands 5 and 4 at 30 m on Landsat 8 and 9. Values are close but not identical between the two. Use Landsat for NDVI before 2015. What is NDVI shows the formula and a full season.
Can I combine Sentinel-2 and Landsat?
Yes. NASA's Harmonized Landsat Sentinel-2 (HLS) resamples Sentinel-2 to Landsat's 30 m grid and corrects the band differences, from 2013 to today. You trade Sentinel-2's 10 m for frequency: on my three farms, the two together gave 57 to 82 clear days a year.
Does Landsat have a 15 m band?
Yes, band 8, panchromatic, 500 to 680 nm. It's in the Level-1 product, not in the Level-2 surface reflectance download, and it sharpens the 30 m colour bands with the Pansharpening tool in the QGIS Processing Toolbox. The result looks sharper, but the colour information is still 30 m.
Are Sentinel-2 and Landsat free?
Both. Sentinel-2 is free and open from the Copernicus Data Space Ecosystem, and Landsat is free from the USGS. Microsoft Planetary Computer mirrors both.
How far back do Sentinel-2 and Landsat go?
Sentinel-2 starts with Sentinel-2A in 2015. Landsat starts with Landsat 1 in July 1972, at 60 m, then 30 m from Landsat 4 in 1982. Landsat 8 began in 2013 and Landsat 9 in 2021.
The QGIS AI hub lists what AI can and cannot do inside QGIS.